
Preface. Climate change and extreme weather will harm oil and gas exploration and production, electric power generation and increase energy demand due to sea level rise, heat, drought, floods, more storms, and blackouts. Extreme heat and drought will force electric power plants to shut down from lack of cooling water. Our continuing exponentially growing population will increase demand on our falling apart energy infrastructure. This report says that climate caused disasters are already costing billions of dollars, and in the future, trillions.
Climate change will makes blackouts and brownouts more common. It already is: Rising heat in the West has driven a steep increase in demand for air conditioning, bringing the electric grid down at times. As have wildfires. And as a preventive measure, utilities in California take the grid down for days if high winds are forecast, leaving millions in the dark. In Texas, an ice storm nearly blacked out the electric grid for months (Douglas 2021).
Related:
EIA (2024) Forecast strong hurricane season presents risk for U.S. oil and natural gas industry
Alice Friedemann www.energyskeptic.com Author of Life After Fossil Fuels: A Reality Check on Alternative Energy; When Trucks Stop Running: Energy and the Future of Transportation”, Barriers to Making Algal Biofuels, & “Crunch! Whole Grain Artisan Chips and Crackers”. Women in ecology Podcasts: WGBH, Financial Sense, Jore, Planet: Critical, Crazy Town, Collapse Chronicles, Derrick Jensen, Practical Prepping, Kunstler 253 &278, Peak Prosperity, Index of best energyskeptic posts
***
USDOE. July 2013. U.S. Energy Sector Vulnerabilities to Climate Change and Extreme Weather. U. S. Department of Energy.
Summary. Natural disasters and climate change are already affecting our ability to produce and deliver energy from oil, natural gas, coal. Climate change will make matters worse:
- Energy infrastructure is at or past its lifetime yet expected to operate in ranges it wasn’t designed for.
- Heat, drought, and floods reduce power output for both fossil fuel and renewable energy generation. Heat increases wildfires, which reduce power output
- Energy infrastructure along the coast is at risk from sea level rise, increasing intensity of storms, and higher storm surge and flooding, potentially disrupting oil and gas production, refining, and distribution, as well as electricity generation and distribution. Sea level rise will flood roads and rail lines, halting receipt or delivery from ships at ports.
- We need 40% more power generation, oil, coal, and natural gas for the 442 million people the USA census bureau in 2012 predicts may be here in 2060.
- Competition for water: Electric generation plants use 13% of water in the USA. Drought can shut power plants down. Agriculture will need even more water as temperatures rise
- Longer and more extreme droughts will lower lake and river levels, making barge delivery of coal, ethanol, food, etc., more difficult or impossible
- Thawing permafrost in the arctic will make oil drilling and exploration more difficult, and may ruin the Alaska pipeline
- Oil and gas production is vulnerable to decreasing water since large volumes of water are needed for enhanced oil recovery, hydraulic fracturing, and refining
Some of the energy infrastructure that will be affected by rising seas, intense storms, high temperatures, frequent droughts include oil wells, hydroelectric dams, and nuclear power plants. It’s already happening.
- Power plants are shutting down or reducing output because of a shortage of cooling water.
- Barges carrying coal and oil are being delayed by low water levels in major waterways.
- Floods and storm surges are inundating ports, refineries, pipelines and rail yards.
- Powerful windstorms and raging wildfires are felling transformers and transmission lines.
- High temperatures and record-setting drought in the Southwest reduced the water available to cool fossil fuel plants and hydroelectric power.
Examples of Impacts from extreme storms, floods, and sea level rise
#21 February 2013: Over 660,000 customers lost power across 8 states in the Northeast after a winter storm brought snow, heavy winds, and coastal flooding, resulting in significant damage to the electric transmission system
#26 July 2011: ExxonMobil’s Silvertip pipeline, buried beneath the Yellowstone River in Montana, was torn apart by flood-caused debris, spilling oil into the river and disrupting crude oil transport in the region.
#27 June 2011: Missouri River floodwaters surrounded Fort Calhoun Nuclear Power plant in Nebraska. The plant was closed all summer due to persistent flood waters
#28 May 2011: Nearly 20% of barge terminals along the Ohio River were closed due to flooding, impacting coal and petroleum transport. Flooding along the Ohio and Mississippi rivers threatened oil refineries and infrastructure from Tennessee to Louisiana
#29 2005: Hurricanes Katrina & Rita inflicted significant damage on the Gulf Coast, destroying 115 offshore platforms and damaging 52 others, damaging 535 pipeline segments, which caused a near-total shutdown of the Gulf’s offshore oil and gas production for several weeks. Nine months after the hurricanes, 22% of oil production and 13% of gas production remained shut-in, equating to the loss of 150 million barrels of oil and 730 billion cubic feet of gas from domestic supplies
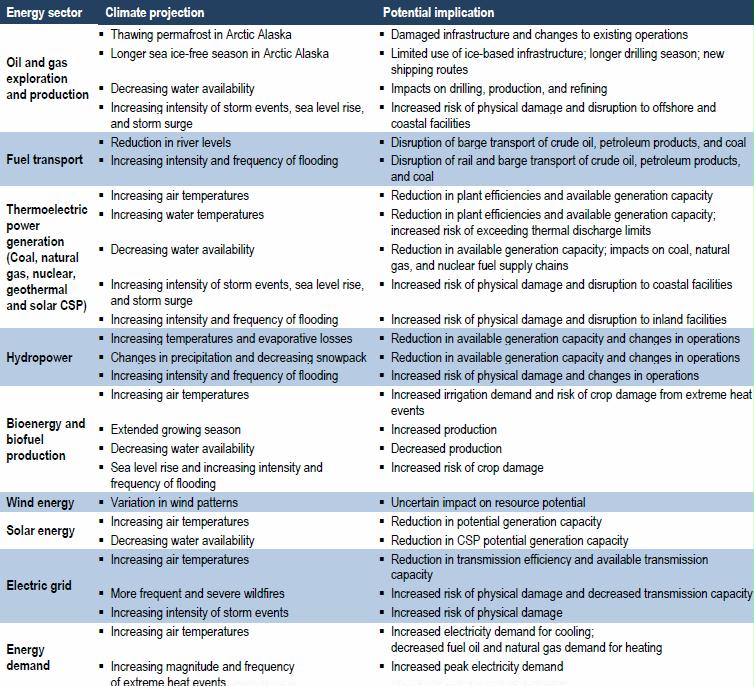
Table ES-1. Climate change and implications for the energy sector
Oil and gas exploration and production
Climate change: 1) Thawing permafrost in Arctic Alaska, 2) decreasing water availability, 3) Increasing intensity of storms, sea level rise, and storm surge
Impact: 1) Damaged infrastructure 2) impacts on drilling, production, and refining, 4) increased risk of physical damage and disruption to offshore and coastal facilities
Fuel transport
Climate change: reduction in river levels, increasing intensity and frequency of floods
Impact: disruption of barge transport of crude oil, petroleum products, and coal
Electric power generation (Coal, natural gas, nuclear, geothermal and solar CSP)
Climate change: 1) increasing heatwaves 2) increasing water temperatures 3) decreasing water availability 4) increasing intensity of storms, sea level rise, and storm surge 5) increasing intensity and frequency of flooding
Impact: 1) reduction in plant efficiency, generation capacity 2) impacts on coal, natural gas, & nuclear supply chains 4) physical damage and disruption of coastal facilities
Hydropower
Climate Change: 1) increasing temperatures and evaporation losses 2) changes in precipitation and decreasing snowpack 3) increasing intensity and frequency of flooding
Impact: 1) reduction in generation capacity 2) physical damage
Bioenergy and biofuel production
Climate change: 1) increasing heat 2) decreasing water, sea level rise and increasing intensity and frequency of flooding
Impact: increased irrigation demand and risk of crop damage from extreme heat, risk of decreased production
Interdependencies (risk of cascading failures)
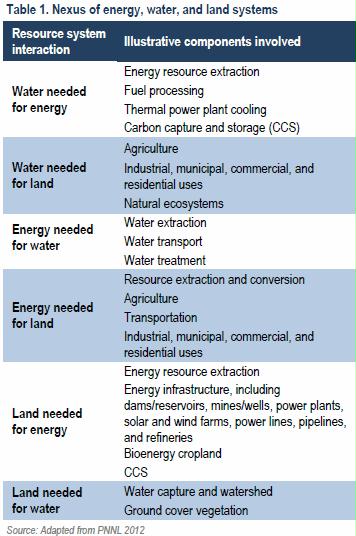
Moving and treating water: 4% of total electricity consumption in the United States, if end users are included, then 13% of total primary energy consumption
- Energy needs Water for fuel processing, cooling of power plants, and fracking.
- Water needs Energy to be pumped, transported, and treated.
- Land needs Water for agriculture, ecosystems, homes, and businesses.
- Water needs Land for storage and ground cover vegetation.
Agriculture and energy compete for water. Irrigation requires energy to pump the water, energy systems need water to cool down with.
- Land needs Energy for transportation, agriculture, commercial and residential uses
- Energy needs Land for bioenergy crops, energy infrastructure such as dams, mines, power plants, power lines, pipelines, and refineries
Transportation uses energy, energy resources (coal, ethanol, etc) need transportation to reach power plants and end users.
- Communication systems need electricity.
- The electric grid needs communications systems to monitor itself (i.e. smart grid).
Most countries, including those the United States imports electricity and fuels from, will face similar impacts, which may in turn impact U.S. energy security
Disruptions in one energy sector can lead to cascading failures, as can be seen from what happened after Hurricane Sandy, which caused a storm surge in New York Harbor 9 feet above average high tide and power outages affecting 8 million customers in 21 states, shut down gasoline fuel pumps, two oil refineries and another four refineries had to reduce output. Ports and several power plants in the Northeast, including nuclear power units, petroleum/natural gas refineries and pipelines, and petroleum terminals, were either damaged or had temporary shutdowns from high winds and floods.
Wildfires
- The wildfire season has increased by nearly 80 days in the past 30 years.
- The average length of large fires has almost quadrupled from 7.5 days to 37 days, and their size of has also increased
- Climate change is expected to increase the frequency, intensity, and total acres burned by wildfires, especially in Alaska and parts of the West
- Warmer temperatures and drought stress forests and make stands vulnerable to mortality from pest infestations such as the pine beetle, increasing wildfire risk
Arctic oil and gas
Oil and gas in Arctic Alaska are very vulnerable to climate change because temperatures in the Arctic are increasing twice as fast as the global average. The region may have up to 90 billion barrels of oil, 1,669 trillion cubic feet of natural gas, and 44 billion barrels of natural gas liquids, about 22% of the world’s undiscovered oil and gas resources
Climate change will make it difficult to get at oil and gas in the Arctic because:
- Thawing permafrost could damage oil and gas infrastructure
- Risks to onshore fossil fuel development could include the loss of access roads built on permafrost, inability to create new roads, problems due to frost heave and settlement of pipelines set on pilings or buried in permafrost, and reduced load-bearing capacity of buildings and structures
- The trans-Alaska oil pipeline was constructed with thousands of pipes that remove heat from permafrost, which are having problems from by increasing temperatures.
- Drilling wastes rely on the permafrost to prevent subsurface movement of the wastes into the environment; thawing permafrost could require alternative waste disposal methods.
- To protect the tundra, the Alaska Department of Natural Resources limits the amount of travel on the tundra, and over the past 30 years, the number of days when travel is permitted has dropped from more than 200 to 100, reducing the number of days that oil and gas exploration and extraction equipment can be used
- Reduced sea ice coverage limits ice-based infrastructure and transportation
- Sea ice melting can result in more icebergs, a risk to oil and gas operations in the Arctic since icebergs can damage rigs and vessels
- Climate change may increase the frequency of polar storms further disrupting drilling, production, and transportation
- In addition to the thawing of permafrost, other risks could increase, including lightning strikes, tundra fire, storm surge, and coastal erosion
Climate change effect on power generation
Higher air and water temperatures plus drought are likely to reduce electricity generation capacity during the summer months. For example, the average summer capacity at thermoelectric power plants by 2031–2060 is projected to decrease by between 4.4% and 16%, depending on climate scenario, water availability, and cooling system type, as compared to the end of the 20th century
Hydropower: Increasing temperatures increase evaporative water losses and water use, decreasing water availability for hydropower, and heat intensifies stratification of reservoirs behind dams, depleting dissolved oxygen in reservoirs and downstream, and degrading habitat for fish and other wildlife.
Agriculture. Increasing temperatures will increase evapotranspiration (ET) rates, which increases water demand; if increased water demand is not met by increased irrigation (or rain), the increased ET rates could reduce average crop yields. Extreme heat could damage crops, and extended periods of drought could destroy entire harvests.
Wind Energy Average annual wind speeds in the United States could decrease from 1 to 3% by 2050, and as much as 3 to14% in the Northwest
Solar Energy Increasing temperatures could reduce potential generation capacity of solar PV by 6%. Photovoltaic (PV) output and efficiency could be lowered by hotter temperatures, changes in cloud cover, haze, humidity, and
Electric Grid The U.S. electric grid is a large and complex system that consists of more than 9,200 electric generating units with more than 1,000 GW of generating capacity connected to more than 300,000 miles of transmission lines. Hotter temperatures will affect the grid significantly in many ways:
- Increasing temperatures are expected to increase transmission losses
- Reduce current carrying capacity
- Increase stresses on the distribution system
- Decrease substation and transmission efficiency and lifespan.
- About 7% of power is lost now in transmission and distribution, and even more will power will be lost as temperatures increase.
- The effects of high temperatures are exacerbated when wind speeds are low or nighttime temperatures are high, preventing transmission lines from cooling. Nighttime temperatures have been increasing at a faster rate than daytime temperatures, and they are expected to continue to increase
- System transmission losses during a heat wave could be significant and contribute to electric power interruptions and power outages.
- Hot temperatures sag of overhead transmission lines due to thermal expansion, which can cause fires and power outages when lines contact trees or the ground.
- More frequent and severe wildfires increase the risk of physical damage to electricity transmission infrastructure and decrease available transmission capacity. The heat, smoke, and particulate matter also lower the capacity of a transmission line. The soot accumulates on the insulators that attach transmission lines to towers, causing leakage currents, and ionized air in the smoke acts as a conductor, causing arcing between lines, which can cause an outage. Fire retardant can foul transmission lines. The probability of exposure to wildfires for some lines in California is projected to increase by 40% by the end of the century.
One study estimates that 34 GW of additional generating capacity will need to be constructed in the western region alone by 2050 to meet the increased peak load due from higher temperatures. Add in another 22% more power for population growth expected by 2035 and you need to spend at least $45 billion in western states alone.
Water & Drought
The largest declines in rainfall from climate change are expected in the summer. In western states, snow water has declined as much as 75% between 1950 and 2000 and is melting earlier.
Droughts have become more common and widespread over the past 40 years in the Southwest, southern Great Plains, and Southeast.
In the Midwest, evaporation rates are projected to increase, water levels decrease, and the frequency, intensity, and duration of droughts are likely to increase.
This combination of more intense droughts and reduced summer rain and stream flows may substantially impact water availability in the summer.
Groundwater depletion is occurring across the United States, including in the High Plains (the location of the Ogallala aquifer) and in the California Central Valley. Future impacts on groundwater resources will result from a combination of changes in precipitation patterns, increases in evaporation rates, increases in droughts, and increasing competition for water among various sectors (e.g., energy, agriculture, industry, and residential). These impacts are expected to continue to decrease groundwater availability, particularly in the central and western regions, as heavily utilized aquifers experience reduced recharge rates.
Implications for the Energy Sector. Decreasing water supplies directly impacts nearly all aspects of energy supply: how electricity is produced; where future capacity may be sited; the cost of producing electricity; the types of generation or cooling technologies that are cost-effective; and the costs and methods for extracting, producing, and delivering fuels. Limited water available for cooling at thermoelectric facilities can affect power plant utilization. Increased evaporation rates or changes in snowpack may affect the volume and timing of water available for hydropower. Decreased water availability can affect bioenergy production. In regions where water is already scarce, competition for water between energy production and other uses will also increase. Future conditions will stress energy production infrastructure in all regions—particularly those with the most water-intensive generation portfolios.
Oil and Gas Exploration and Production. Water is required in many different stages of the oil and gas value chain, from exploration to processing to transport, with the largest volume of water used in the refining process. In exploration and production processes, the largest volume of water is used as a supplemental fluid in the enhanced recovery of petroleum resources. Water is required to a lesser extent for other activities, including drilling and completion of oil or gas wells; work-over of an oil or gas well; creation of underground hydrocarbon storage caverns through solution mining of salt formations; as gas plant cooling and boiler water; as hydrostatic test water for pipelines and tanks; as rig wash water; and as coolant for internal combustion engines for rigs, compressors, and other equipment. Water is not only used in conventional oil and gas exploration and production, but significant volumes of impaired water are produced in the process. This produced water is the largest volume by-product associated with oil and gas exploration and production. The total volume of produced water in 2007 was estimated to be 21 billion barrels, or 2.4 billion gallons per day . More than 98% of this produced water is injected underground: Approximately 59% is injected into producing formations to enhance production and about 40% is injected into non-producing formations for disposal.
Coal and uranium mining. Water is needed for mining operations. Mining tailings can harm surface and groundwater quality.
Coal slurry pipelines. Water is used to transport the slurry, which harms water quality.
Coal-bed methane, tight gas sands, shale oil and gas use huge amounts of water and contaminate it.
Decreasing water availability impact on oil refining. Conventional oil refining requires 0.5 to 2.5 gallons of water per gallon of gasoline equivalent. Additional water may be consumed if reforming and hydrogenation steps are required.
Fuel Transport. Decreased water levels in rivers and ports can cause interruptions and delays in barge and other fuel delivery transportation routes. Crude oil and petroleum products are transported by rail, barge systems, pipelines, and tanker trucks. Coal is transported by rail, barge, truck, and pipeline. Corn-based ethanol, blended with gasoline, is largely shipped by rail, while bioenergy feedstock transport relies on barge, rail, and truck freight. A complex web of crude oil and petroleum product pipelines deliver petroleum from domestic oil fields and import terminals to refineries and from refineries to consumption centers across the United States. The shale oil revolution in areas such as the Bakken in North Dakota and Montana will likely increase barge traffic, with crude oil being transported by barge along the Missouri
Reductions in river levels could impede barge transport of crude oil, petroleum products, and coal, resulting in delivery delays and increased costs. In August 2012, the U.S. Army Corps of Engineers reported groundings of traffic along the Mississippi River due to low water depths from drought. This disrupted the transportation of commodities delivered by barges, including coal and petroleum products. Petroleum exports through New Orleans were valued at about $1.5 billion per month in 2012. When river levels decrease, barge operators reduce their loads. A tow (chain of barges pulled or pushed as a group) on the upper Mississippi, Illinois, and Ohio rivers typically has 15 barges, each capable of carrying more than 1,000 tons. A one-inch (2.5 cm) drop in river level can reduce tow capacity by 255 tons. Likewise, the typical tow on the lower Mississippi has 30– 45 barges, resulting in decreased capacity of up to 765 tons for just a one-inch decrease in river level.
Most coal in the United States is mined in 3 regions: Appalachia, the Midwest, and western states. Barges carry 11% of U.S. coal to power plants. According to the EIA, 63% of coal production is projected to originate from western states by 2030 compared to 54% in 2011, meaning an even larger share of coal produced would be transported long distances. Continued transportation of fossil fuels by barge would make coal power plants vulnerable to supply chain failure from drought-reduced river levels in the future.
Electric power generation uses the largest amount of freshwater in the United States
- 200 billion gallons per day, or 40% of all freshwater withdrawals.
- 90% of thermoelectric power generation in the United States requires water for cooling. Low flow conditions in rivers and low lake levels—due to drought, increased evaporation, or changes in precipitation and runoff patterns—pose an operational risk to thermoelectric facilities
- About 25% of electric generation is in counties projected to be at high or moderate water supply sustainability risk in 2030.
- 350 coal-fired power plants in the United States (out of 580) are located in areas subject to water stress (i.e., limited water supply and/or competing water demand from other sectors).
- Increasing power needs for the growing U.S. population could increase thermoelectric water consumption by as much as 27% by 2035
- Carbon capture and storage (CCS) technologies could contribute to increased water consumption, which are twice as high as coal and natural gas
Water and Coal Power Generation. Decreasing water availability could affect the coal supply chain. Coal provides over 40% of the electric power generated in the United States and uses water for many stages, from extraction to processing and transport. Coal can be mined from deep underground caverns, surface pits, or mountaintops. Coal mining processes can use significant amounts of water: an estimated 70–260 million gallons of water per day, or approximately 50–59 gallons of water for every short ton of coal mined. Water is used at several different stages, including for cooling or lubricating cutting and drilling equipment, dust suppression, fuel processing, and revegetation when mining and extraction are complete. One short ton of coal generates about 1,870 kWh of electricity. Depending on its quality, coal may need to be “washed” with water and chemicals to remove sulfur and impurities before it can be burned in a power plant.
Water and Nuclear Power. Nuclear energy provides about 20% of the electricity in the United States. Over the last decade, U.S. uranium mines have supplied less than 10% of the uranium fuel powering the nuclear fleet, with the rest imported. Water used to mine uranium has traditionally been comparable to the estimates for underground and surface coal mining: between one and six gallons per British thermal unit (BTU). Uranium fuel processing requires additional water (45 to 150 gallons per MWh).
Water and Renewable Energy Resources. The water demand associated with renewable energy technologies varies significantly. Water consumption for thermoelectric power generation based on solar CSP plants or geothermal technologies using once-through or recirculating cooling can be comparable to, or even greater than, that of fossil or nuclear thermoelectric power plants.
While photovoltaic (PV) power generation consumes little, Concentrating Solar Power (CSP) uses steam generation and water cooling and requires significant volumes of water and consume more water than a natural gas, coal-fired, or nuclear power plant. A typical parabolic trough CSP plant with recirculating cooling uses over 800 gal/MWh; most of it for cooling, with less than 2% for mirror washing. These values compare to less than 700 gal/MWh for a nuclear power plant, 500 gal/MWh for a supercritical coal-fired power plant, and 200 gal/MWh for a combined cycle natural gas plant.
Hydropower. Changing precipitation and decreasing snowpack could decrease available hydropower generation capacity. Higher temperatures, less snowpack, and decreasing water availability have reduced the Colorado River’s flow and left Lake Mead more than 100 feet (30 meters) below full storage capacity. Hoover Dam loses 5–6 MW of capacity for every foot (0.3 meter) decline in Lake Mead, because at lower water levels there is less water pressure to drive the turbines as well as a greater potential for air bubbles to form and flow through with the water causing the turbines to lose efficiency. Studies on the effects of stream flow on available hydropower generation in the Colorado River Basin suggest that for each 1% decrease in stream flow, power generation decreases by 3%. For several California rivers, summer hydropower potential is projected to decrease 25% because runoff is projected to occur two weeks earlier under a climate scenario of 3.6°F warming.
Bioenergy and Biofuel Production. Changes in precipitation and runoff may affect bioenergy production. Drought and other changes in the hydrologic cycle may diminish feedstock production efficiency for both traditional and second-generation bioenergy. Increasing competition for water, particularly in times when (and locations where) water is scarce, will affect energy and food production alike. On average, producing one gallon of corn ethanol requires 17–239 gallons of water for irrigation and conversion. One study found that 520–3,281 gallons of freshwater is currently required to produce one gallon of biodiesel from microalgae.
Increasing Storms, Flooding, and Sea Level Rise
- Increasing intensity of storm events, sea level rise, and storm surge put coastal and offshore oil and gas facilities at increased risk of damage or disruption
- Increasing intensity of storm events increases the risk of damage to electric transmission and distribution lines.
- Increasing intensity of storm events, sea level rise, and storm surge poses a risk to coastal thermoelectric facilities, while increasing intensity and frequency of flooding poses a risk to inland thermoelectric facilities.
- Increasing intensity and frequency of flooding increases the risk to rail and barge transport of crude oil, petroleum products, and coal.
As atmospheric temperatures increase, so does the waterholding capacity of the air—generally by about 7% per 1.8°F increase in temperature. As a result, rainstorms become more intense and a greater fraction of precipitation falls during heavy rainfall events, increasing flooding risk. Recent projections indicate that globally, the heaviest precipitation events are likely to occur twice as frequently as they do today by the end of the century. In the United States, high-rainfall events which today occur once every 20 years may occur once every 4-15 years by 2100, depending on location. Such events are also expected to become more intense, with 10%–25% more precipitation falling in the heaviest events. The greatest increases are expected in parts of the Northeast, Midwest, Northwest, and Alaska.
Changes in the timing and amount of precipitation consequently shift the frequency, intensity, and duration of floods
Since the 1970s, the intensity of hurricanes and tropical storms has increased. According to the IPCC, the intensity of category 4 & 5 hurricanes is expected to increase by 80% in 2081-2100 compared to now.
Sea Level Rise
Globally, absolute sea level rose at an average rate of.07 inches per year from 1880 to 2011, but from 1993 to 2011 the average sea level rose at a rate of .11– .13 inches per year. The rate of global sea level rise over the last 20 years is double the rate observed over the last century. Future global sea level rise over the rest of this century is projected to increase at a faster rate than over the last century.
In coastal areas, storm events combined with sea level rise will contribute to greater storm surge impacts, increasing over time as both storm intensity and sea level rise increase
Sea level rise will exacerbate existing vulnerabilities to hurricanes and storm surge because hurricanes and storms damage wetlands and other natural and manmade features that help protect coastal infrastructure from sea level rise, flooding, and hurricanes.
The second-costliest year for weather and climate disasters in the United States was 2012, with estimated damage of approximately $115 billion (NOAA 2013a). These events include severe weather and tornados, tropical storms, droughts, and wildfires. The two major drivers of damage costs in 2012 were Hurricane Sandy ($65 billion) and an extended drought ($30 billion).
Heavy rainfall and flood events in the Midwest and Northeast threaten inland facilities and infrastructure and may impede the transportation of coal to power plants. More intense hurricanes pose a particular risk to ports and energy infrastructure in coastal regions.
The Gulf Coast region exemplifies the high-volume, high-value, complex system of resources, infrastructure, and transportation networks required to convert raw materials such as natural gas and crude oil into fuels. With nearly 4,000 active oil and gas platforms, over 30 refineries, and 25,000 miles of pipeline, the Gulf region’s oil and gas industry produces approximately 50% of U.S. crude oil and natural gas and half of U.S. refining capacity, as well as the U.S. Strategic Petroleum Reserve with 700 million barrels of crude oil
Increasing intensity of storm events, sea level rise, and storm surge put coastal and offshore oil and gas facilities at increased risk of damage or disruption. In 2005, Hurricanes Katrina and Rita shut down or damaged hundreds of oil drilling and production platforms and offshore drilling units, and damaged 457 offshore oil and gas pipelines and significantly damaged onshore oil refining, gas processing, and pipeline facilities, which impacted oil and gas production for months. As energy sector development in the Gulf Coast has proceeded over the last 50 years, including the deployment of deep-water rigs costing as much as a billion dollars, the potential for significant damage from storm events in the region has increased. In addition to causing physical damage to energy infrastructure, an increase in the intensity of storms can decrease fuel supplies. Storm-related disruptions to extraction, processing, refining, and generation also cause losses for downstream businesses and industries.
Business Interruption Costs. The economic impacts of combined sea level rise and storm surge damages to the energy industry in the Gulf region could average $8 billion per year by 2030. Increasing intensity of storm events, sea level rise, and storm surge could impact oil storage facilities and operations.
Fuel Transport
- More frequent heavy rainfall events will increase flood risk across the United States, particularly in the Northeast and Midwest.
- Increased frequency and intensity of flooding will affect water levels in rivers and ports and could wash out rail lines.
- Flooding events could also cause interruptions and delays in fuel and petrochemical feedstock deliveries.
- Increasing intensity and frequency of flooding increases the risk to rail and barge transport of crude oil, petroleum products, and coal.
- Intense storms and flooding can impede barge travel and wash out rail lines, which in many regions follow riverbeds.
- Flooding of rail lines has already been a problem both in the Appalachian region and along the Mississippi River. In 2011, severe flooding throughout the Powder River Basin disrupted trains. Rerouting of trains due to flooding can cost millions of dollars and delay coal deliveries. Approximately 71% of the nation’s coal is transported by rail lines, with the remainder transported by barge, truck, and pipeline.
- As heavy precipitation events become more frequent and the risk of flooding increases, so will the risk of disruptions to coal deliveries. Delivery disruptions could, in turn, interrupt electricity generation at some power plants.
- The amount of crude oil and petroleum products transported by U.S. railways during the first half of 2012 increased by 38% from the same period in 2011. Although the majority of oil is transported by pipeline, railroads play an increasingly important role in transporting U.S. crude oil to refineries. This is especially true for North Dakota’s Bakken formation, which has limited pipeline infrastructure. The formation has more than tripled oil production in the last 3 years to become the 2nd-largest oil producer in the United States.
- The United States produces and transports more than one billion short tons of coal every year. While coal is produced in 25 states, the Powder River Basin, largely in Wyoming, accounted for 468 million tons of production in 2010, or 43% of U.S. coal production
Thermoelectric Power Generation
Numerous thermoelectric power plants line the coasts of the United States.
- 10% are nuclear reactors
- 15% are coal-fired plants
- 75% are oil or natural gas-fired plants.
Many inland thermoelectric power plants are located in low-lying areas or flood plains. Increasing intensity of storm events, sea level rise, and storm surge poses a risk to coastal thermoelectric facilities.
The Atlantic Coast from Hampton Roads, Virginia, and further north, and the Gulf Coast are considered to be particularly vulnerable to sea level rise because the land is relatively flat and, in some places, subsiding.
An increase in sea level of 2 feet would affect more than 60% of the port facilities on the Gulf Coast.
An increase of 4 feet would affect 75% of port facilities.
In addition, assuming higher range projections for sea level rise combined with future 100-year floods in California, up to 25 thermoelectric power plants could be flooded by the end of the century, as well as scores of electricity substations and natural gas storage facilities.
Increasing intensity and frequency of flooding poses a risk to inland thermoelectric facilities. The intake structures, buildings, and other infrastructure at thermoelectric generation facilities that draw cooling water from rivers are vulnerable to flooding and, in some cases, storm surge.
Renewable Energy Resources
Increasing intensity and frequency of flooding could impact the operation of hydropower facilities in some regions. Flooding has the potential to increase river flows and hydropower generation. In extreme cases, floods can prove destructive to dams. The large sediment and debris loads carried by floodwaters can block dam spillways, and powerful masses of water can damage important structural components
Sea level rise and increasing intensity and frequency of flooding could inhibit bioenergy production. In 2008, major corn producing states in the upper Midwest experienced extreme flooding due to heavy rainfalls over an extended period of weeks. This flooding affected early-season planting operations. In coastal agricultural regions, sea level rise and associated saltwater intrusion and storm surge flooding can harm crops through diminished soil aeration, salinization, and direct damage.
Electric Grid. Increasing intensity of storm events increases the risk of damage to electric transmission and distribution lines.
Strong winds associated with severe storms, including tropical storms and hurricanes, can be particularly damaging to energy infrastructure and result in major outages. In addition, heavy snowfall and snowstorms, which have increased in frequency in the Northeast and upper Midwest, and decreased in frequency in the South and southern Midwest, can also damage and disrupt electricity transmission and distribution.
Costs from Power Outages. A Congressional Research Service report estimates that storm related power outages cost the U.S. economy $20–$55 billion annually. Whether from aging infrastructure, increasing development, or increasing storm intensity and frequency, outages from weather-related events are increasing.
A study that only looked at Texas, Louisiana, and coastal communities in Mississippi and Atlanta predicted that by 2030 there will be nearly $1 trillion in energy assets at potential risk from rising sea levels and more intense hurricanes.
Wildfire trends: In 2012, more than 9.2 million acres burned nationwide, with fires setting records in many states both in terms of acres burned (e.g., New Mexico) and economic damages (e.g., Colorado). The wildfire activity of 2012 supplanted 2011 as the year with the 3rd most acres burned, behind 2006 and 2007. Although the number of fires was below average, the size of the fires notably increased. In the western states, the wildfire season has increased by nearly 80 days during the past 3 decades and the average duration of large fires has almost quadrupled, from 7.5 days to 37 days. These increases are attributed to both changes in forest management practices and increasing temperatures coupled with earlier spring snowmelt, drying soils, and vegetation Projected changes: The frequency of wildfires is projected to increase in some parts of the United States, particularly Alaska and parts of the West. Annual mean area burned in the western United States is projected to increase by 54% by the 2050s compared to the present day, and increase by as much as 175% in the Pacific Northwest.
Cloud Cover Historic trends: Cloud cover data from more than 100 stations indicate that, from 1970–2004, total cloud cover increased by approximately 1.4%. Increases occurred in nearly all parts of the United States except the Northwest.
Snowpack Water
Millions of people in the West depend on the springtime melting of mountain snowpack for power generation, irrigation, and domestic and industrial use. Runoff, excess water from rainfall or snowmelt that does not evaporate, flows over the land and ends up as stream flow. Stream flow influences the amount of water available for power generation, irrigation, domestic supply, and other competing uses. The fraction of precipitation falling as rain rather than snow has increased in many parts of the United States during the past 50 years, reducing total snowpack and increasing the risk of water shortages in the summer and fall. Total seasonal snowfall has generally decreased in southern and some western areas, increased in the northern Plains and Great Lakes, and not changed in other areas, such as the Sierra Nevada. In 2012, the nation experienced the third smallest winter snow cover extent in recorded history. Below average snowpack was observed for much of the western United States (NOAA 2013c). This is particularly relevant to the energy sector in areas with snowmelt-driven watersheds, such as the West, where the fraction of precipitation falling as rain increased by almost 10% over the past five decades.
As a result of earlier snowmelt, since the mid-20th century seasonal runoff has been occurring up to 20 days earlier in the West and up to 14 days earlier in the Northeast. The lack of snowfall across the Rockies, Great Plains and Midwest was a precursor to the record breaking droughts that impacted two-thirds of the United States during the summer and fall of 2012.
Snowpack in the mountains of the western and southwestern states are projected to decrease significantly by mid-century. Due to reductions in snowpack, earlier snowmelt, and changes in snowfall patterns, average winter and spring stream flows are projected to increase in the western states, summer stream flows are projected to decrease, and peak runoff is projected to continue to occur earlier. Under a higher emissions scenario (A2), peak runoff at the end of the century in snowmelt driven streams is projected to occur as much as 25 to 35 days earlier compared to 1951–1980/
The greatest decreases in low river flows (reduced river flow for the lowest 10% of daily river flows) are projected for southern and southeastern regions of the United States, where flows are projected to decrease by more than 25% in a lower emissions scenario.
During the past 40 years, much of the Southwest, southern Great Plains, and Southeast experienced an increase in drought conditions, whereas the Northeast, Great Plains, and Midwest experienced a decrease. The first decade of the 21st century was particularly dry in the western states. In 2012, more than 60% of the contiguous United States experienced drought conditions. Projected changes: A greater risk of drought is expected in the future, with dryer summers and longer periods between rainfall events. Under higher emissions scenarios, widespread drought is projected to become more common over most of the central and southern United States. Overall, the frequency, intensity, and duration of droughts are likely to increase and water levels are likely to decrease.
Groundwater Levels: In many parts of the United States, groundwater is being depleted at rates faster than it is being recharged, including:
- High Plains Ogallala aquifer
- California Central Valley
- Chicago-Milwaukee area
- West-central Florida
- Desert Southwest
And others as well. In parts of Kansas, Oklahoma, and Texas groundwater levels were more than 130 feet (40 meters) lower in 2007 than in 1950.
A combination of changes in precipitation and increases in evaporation rates, droughts, and competition for water may decrease groundwater availability, particularly in the central and western states, as heavily utilized aquifers experience reduced recharge rates. By the end of the century, natural groundwater recharge in the Ogallala aquifer is projected to decrease by more than 20%, under warming of 4.5°F or greater.
Heavy Precipitation and Downpours: Heavy downpours have increased, and the fraction of rainfall coming from intense single-day events has also increased. Since the beginning of the 20th century, total rainfall during the most intense precipitation events in the United States has increased by about 20%. Since 1991, the amount of rain falling in intense precipitation events has been above average throughout the continental United States. There are clear trends toward very heavy precipitation for the nation as a whole, and particularly in the Northeast and Midwest,.
Measurements of stream gauges with historical records of at least 85 years show that the greatest increases in peak stream flows have occurred in the upper Midwest (specifically, the Red River of the North), and in the Northeast (especially in New York, New Jersey, and eastern Pennsylvania). However, stream flows in the Rocky Mountains and the Southwest have shown significant declines.
Examples of Impacts from increasing heat
- August 2012: Dominion Resources Millstone Nuclear Power Station in Connecticut shut down a reactor because the temperature of the intake cooling water was too hot for 2 weeks, resulting in the loss of 255,000 MWh of power
- September 2011: High temperatures and electricity demand tripped a transformer and transmission line near Yuma, Arizona, starting a chain of events that led to shutting down the San Onofre nuclear power plant. 2.7 million customes in San Diego county lost power for up to 12 hours.
Examples of Impacts from not enough water
- July 2012: In the midst of one of the worst droughts in American history, natural gas and oil companies that use hydraulic fracturing faced higher water costs or were denied access to water for 6 weeks or more in many states
- Summer 2012: Drought and low river depths disrupted the transportation of commodities, such as petroleum and coal, delivered by barges. The U.S. Army Corps of Engineers reported grounding of traffic along the Mississippi River
- Summer 2012: Reduced snowpack in the mountains of the Sierra Nevada and low precipitation levels reduced California’s hydroelectric power generation by 38% compared to the prior summer
- September 2010: Water levels in Nevada’s Lake Mead dropped to levels not seen since 1956, prompting the Bureau of Reclamation to reduce Hoover Dam’s generating capacity by 23%.
Additional References
Broder JM (2013) Climate Change Will Cause More Energy Breakdowns, U.S. Warns. New York Times.
Douglas E (2021) Texas was “seconds and minutes” away from catastrophic months long blackouts, officials say. The Texas Tribune.