Domestic sources integral to U.S. energy security, but may be vulnerable By Elizabeth Bunn

Domestic sources integral to U.S. energy security, but may be vulnerable By Elizabeth Bunn

U.S. Vulnerabilities

The following facilities represent some the most important oil and petroleum infrastructure in the United States. The vulnerability of these systems depends on several factors, including location, capacity and redundancy.

Port of Houston
Newington, Va., Storage Facility
Louisiana Offshore Oil Port
Cushing, Okla.
Port of Miami
Port Everglades

Colonial Pipeline
Plantation Pipeline
Trans-Alaska Pipeline

Major U.S. Refineries

From Port (to Pipeline) to Pump: How Safe is U.S. Oil?

Nearly eight years ago, the U.S. government identified 15 scenarios in which hypothetical incidents were capable of threatening the nation’s economy and power supply.

One of those scenarios was the possibility of a large hurricane hitting a major metropolitan area such as New York City and causing catastrophic damage including knocking out power to millions, said homeland security expert David McIntyre.

“Although the threat was laid out at the federal level, state and local leaders did nothing to prepare for it,” he said.

The hypothetical became real on October 29 when Hurricane Sandy slammed into New York and New Jersey, idling nearly 70 percent of the East Coast’s oil refining capability, flooding entire neighborhoods and causing more than 100 deaths.

In a December hearing before the Senate Committee on Commerce, Science and Transportation, Patrick Foye, executive director of The Port Authority of New York and New Jersey, testified that the storm will likely cost the region tens of billions of dollars in damages.

Many experts say they believe future storms could be even more damaging. “That’s my concern for petroleum critical infrastructure,” said McIntyre, a former director of the Integrative Center for Homeland Security at Texas A&M. “What low probability but high consequence events are out there, and have we been properly preparing for them?”

Deciding which events to spend money planning for requires setting priorities, and the U.S. government hasn’t done a great job of that, said Todd Keil, former undersecretary of the Department of Homeland Security’s Office of Infrastructure Protection. “Identifying the risk and where you put your resources is the biggest challenge.”

The Department of Homeland Security has a classified list of facilities it has identified as “national critical infrastructure” based on two criteria – economic impact and potential fatalities, Keil said. The energy sector is among the 18 sectors reviewed. “If I had to pinpoint something I’d look to refineries,” said Adm. James Loy, former deputy secretary of the Department of Homeland Security. Refineries convert crude oil into usable petroleum products such as gasoline and jet fuel.

Although the list is classified, some experts have suggested what types of high-priority infrastructure may be considered for it.

Pipelines play a critical role as well, and may be harder to secure and protect, said Paul Rosenzweig, former deputy assistant secretary for policy in the Department of Homeland Security. “If you have an oil refinery, you can put up fences, hire guards and do a pretty decent job of getting yourself together on that,” Rosenzweig said. “If you have a 2,000-mile pipeline from Canada to Texas, you simply cannot protect the entire pipeline.”

The Colonial Pipeline, for example, spans more than 5,000 miles from Houston, Texas to Linden, N.J., and delivers more than 2 million barrels per day of gasoline, diesel fuel and home heating oil from the Gulf Coast to the Northeast. The Colonial Pipeline also delivers jet fuel to major airports, including Atlanta International, Dulles International and Reagan National Airport in Washington.

Natural Disasters

Energy experts say natural disasters pose the greatest risk to energy infrastructure, in large part because most of the nation’s critical petroleum infrastructure is concentrated in and around the Gulf of Mexico.

“The real greatest vulnerability is the rather unsexy natural disaster and accident stream,” Rosenzweig said. “That probably outweighs the terrorist threat, either through physical attack or cyber, by a significant degree.”

Houston alone contains many major refineries that together account for approximately 30 percent of the nation’s refining capacity, Rep. Michael McCaul, R-Texas, said in a 2011 House Homeland Security Committee hearing. Houston’s 25-mile ship channel and surrounding area receives almost 25 percent of all U.S. oil imports.

“If catastrophe struck the port, there is little spare capacity to import and refine crude oil anywhere else in the country,” McCaul said in the statement prepared for the hearing.

Elsewhere in the Gulf of Mexico, hurricanes pose a threat to such critical facilities as the Louisiana Offshore Oil Port, a terminal approximately 18 miles south of the Louisiana Coast. The LOOP is the single largest point of entry for oil tankers carrying crude oil to the United States, and it is the only platform in the nation capable of accommodating oil supertankers.

“The Houston Ship Channel is significant. The Colonial Pipeline is significant. The LOOP is significant,” Keil said. “There would be a significant impact should something happen to any of those.” The impact could range from short-term supply disruptions and price spikes to longer term shortages, depending on the severity of the incident.

When Hurricane Katrina hit the Gulf in 2005, it caused a 95 percent reduction in daily Gulf oil production, according to the U.S. Energy Information Administration. The storm closed refineries, disrupted crude oil and petroleum imports and caused oil prices to skyrocket. And experts say it may get worse before it gets better.

“Most if not all of the predictions are for more storms and for more severe storms,” Loy said. “It is a quite serious matter for both the industry and the people who respond to such events.”

Cyber Threats

National security experts cite cyber safety as another significant – and rapidly growing – concern with respect to the energy sector. “Unfortunately, most of our infrastructure today is in one way or another connected to the Internet,” said Gal Luft, co-director of the Institute for the Analysis of Global Security, a Washington-based think tank. “Once you have access to the Internet, you basically are open to everything that the Internet brings.”

Thomas Cellucci, a former commercialization officer who managed public-private partnerships at the Department of Homeland Security, also emphasized the growing cyber threat. “That’s the biggie,” Cellucci said. “Cyber attacks are really something that ‘govvies’ worry about, and they should.”

Increasingly, refineries and pipelines run on computer-controlled systems called supervisory control and data acquisition – or SCADA – systems. Designed to increase efficiency, the systems also create vulnerabilities.

“The attacks that are most likely to cause real civilian harm are attacks on the industrial control systems,” said Stewart Baker, former assistant secretary for policy at the Department of Homeland Security. “Not the Windows networks, but the industrial systems that are built on software increasingly and that make pipelines work, refineries work.”

Targeting industrial systems is on the rise. In July 2012, a security company discovered the Stuxnet virus. Many speculate that the sophisticated virus was state-sponsored—either by the United States, Israel or both—and designed to infiltrate and undermine Iran’s uranium enrichment facility.

One month later, state-owned Saudi Arabian Oil Co., better known as Saudi Aramco, reported that a virus called Shamoon infiltrated the company’s computers. “More than 30,000 computers that it infected were rendered useless and had to be replaced,” said Secretary of Defense Leon Panetta in an October 2012 speech. “It virtually destroyed 30,000 computers.”

There is no evidence that the U.S. has encountered such an attack on domestic oil infrastructure, Baker said, but the likelihood increases as the tools required to execute an attack get easier to use. “My biggest worry about this is that every year, the kind of damage that can be done by a handful of people grows.”

Baker said he’s also concerned there isn’t enough preparation for mitigating these threats. A lot of the attention has focused on making systems harder to hack, he said, which is really about putting up defenses, and not about what happens if those defenses fail.

Terrorist Attacks

The energy sector, along with the transportation and banking and finance sectors, is one of the most likely to be targeted by terrorists, Keil said. “These three things together I think are very, very primary targets – from an operational perspective and from an ideological perspective.”

In 2006, a group of al-Qaida terrorists launched a well-planned, but unsuccessful attack against the Abqaiq processing facility, one of Saudi Arabia’s most crucial oil facilities. Two days after the attack, according to a report released by the Jamestown Foundation, al-Qaida affiliated cleric Sheikh Abd-al-Aziz bin Rashid al-Anzi published the terrorist group’s religious justification for attacking oil infrastructure called “The Religious Rule on Targeting Oil Interests.” In it, he wrote: “Targeting oil interests is lawful economic Jihad. Economic Jihad in this era is the best method to hurt the infidels.”

Former al-Qaida leader Osama bin Laden also urged his followers to attack the oil industry as a way of striking at the center of gravity of the U.S. and its allies.

Keil said the terrorist threat to energy infrastructure is particularly worrisome when it comes to cyber. “What we were seeing is that [the terrorists] up to this point were using the cyber arena more as a tool rather than a weapon,” Keil said. “But that’s just around the corner. I think we’re probably on the cliff of the established terrorist groups using cyber as a weapon.”

But identifying and prioritizing cyber threats and other infrastructure risks does not mean the U.S. is prepared to deal with such risks, Keil said.

“There was a lot of assessment and risk identification work being done,” he said, “but there were no metrics to determine if actual steps were being taken … we had no idea if anything was being done or not.”

The Department of Homeland Security started developing a way to assess progress a few years ago, Keil said. Current Department of Homeland Security officials declined to comment.

But homeland security veteran McIntyre said it’s still unclear how the federal government prepares for threats, a reality he said is particularly troubling when considering low-likelihood, high-impact scenarios.

To McIntyre, that means an incident on par with shutting down refineries, simultaneously attacking three different parts of a major pipeline, or preventing heating fuel from reaching parts of the Northeast U.S. for a prolonged period of time.

“But unless somebody has some sort of public oversight, we don’t know if that’s been considered,” McIntyre said. “That’s why I think the legislative branch needs to be sure they’re providing oversight on critical infrastructure issues.”


U.S. Incident Timeline

2001
A man fired a high-powered rifle at the Trans-Alaska pipeline, causing oil to spill and forcing officials to isolate a section of the pipeline.

2005
Hurricane Katrina wreaked havoc in the Gulf, destroying or damaging platforms, refineries and pipelines. Following Katrina, U.S. oil supply declined as much as 1.4 million barrels per day.

2006
Federal authorities discovered a website post linked to al-Quida. The detailed post called for attacks on American pipelines using weapons or hidden explosives.

2007
The Department of Justice arrested members of a terrorist group attempting to blow up the fuel pipelines and storage tanks at New York’s JFK airport.

2007
A U.S. citizen was convicted of working with al-Quida to try and blow up the Trans-Alaska pipeline.
2012 Hurricane Sandy idled almost 70 percent of the East Coast’s refining capability. The storm closed two-thirds of the East Coast’s refineries, its biggest pipeline and most major ports.


Posted in Chokepoints | Comments Off on Domestic sources integral to U.S. energy security, but may be vulnerable By Elizabeth Bunn

Reaching Oil Limits – New Paradigms are Needed by Gail Tverberg

Reaching Oil Limits – New Paradigms are Needed

I have written in recent posts that oil limits are more complex than what many have imagined. They aren’t just a lack of a liquid fuel; they are inability to compete in a global economy that is based on use of cheaper fuel (coal) and a lower standard of living. Oil prices that are too low for oil exporting nations are a problem, just as oil prices that are too high are a problem for oil importing nations.

Debt limits are also closely tied to oil supply limits. It is actually debt limits, such as those we seem to be reaching right now, that may bring the whole system to a screeching stop. (See my posts How Resource Limits Lead to Financial CollapseHow Oil Exporters Reach Financial Collapse, Peak Oil Demand is Already a Huge Problem, and Low Oil Prices Lead to Economic Peak Oil.)

We have many Main Street Media (MSM) paradigms that mischaracterize our current predicament. But we also have what I would call Green paradigms, that aren’t really right either, because they don’t recognize the true state of our predicament. What we need now is new set of paradigms. Let’s look at a few common beliefs.

Inadequate Oil Supply Paradigm

As I stated above, indications that oil supply is a problem are confusing. MSM seems to believe, “If the US can be oil independent, our oil supply problems are solved.” If a person believes the goofy models our economists have put together, this is perhaps true, but this is not true in the real world.

Without a huge, huge increase in US oil production (far more than is being proposed), being “oil independent” simply means that we are unable to compete in the world market for buying oil exports. US oil consumption ends up dropping, and we end up on the edge of recession, or actually in recession. Oil exports instead go to the countries that have lower manufacturing costs (that is, use oil more sparingly).  See Figure 1 below. In fact, even some of the oil products that are created by US refineries end up going to users in other countries, because it is businesses in other countries that are making many of today’s goods, and it is these businesses and the workers they hire who can  afford to buy products like gasoline for their cars or diesel for their irrigation pumps.

Figure 1. Oil consumption by part of the world, based on EIA data. 2012 world consumption data estimated based on world "all liquids" production amounts.

The Green version of this paradigm seems to be, “If world oil supply is rising, everything is fine.” This is related to the idea that our problem is “peak oil” production caused by geological depletion, and if we haven’t hit peak oil production, everything is more or less OK. In fact, the limit we are reaching is an economic limit, that comes far before world oil supply begins to decline for geological reasons. See my post, Low Oil Prices Lead to Economic Peak Oil.

The real paradigm is, “Limited oil supply leads to financial collapse.” This is true for both oil exporters and for oil importer. For oil importers, the problem occurs because they cannot import enough oil, and oil is needed for critical parts of the economy. The belief by economists that substitution will take place is not happening in the quantity and at the price level (very low) that it needs to happen at, to keep the economy expanding as it has in the past.

Limited oil supply first leads to high oil prices, as it did in the 2004 to 2008 period; then it leads to government financial distress, as governments try to deal with less employment and lower tax revenue. By the time oil prices start falling because of the poor condition of oil importers, we are well on our way down the slippery slope to financial collapse.

Growth Paradigm

The MSM version of this paradigm is, “Growth can be expected to continue forever.” A corollary to this is, “The economy can be expected to return to robust growth, soon.”

In a finite world, this paradigm is obviously untrue.  At some point, we start reaching limits of various kinds, such as fresh water limits and the inability to extract an adequate supply of oil cheaply.

Economists base their models on the assumption that the economy only needs labor and capital; it doesn’t need specific resources such as fresh water and energy of the proper type. Unfortunately, substitutability among resources is not very good, and price is all-important. In the real world, growth slows as resources become more expensive to extract.

The Green version of the growth paradigm seems to be, “We can have a steady state economy forever.” Unfortunately, this is just as untrue as the “Growth can be expected to continue to forever.” Even to maintain a steady state economy requires far more cheap-to-extract oil resources than the earth really has. (US shale oil resources, which are the new hope for oil growth, can only grow if oil prices are sufficiently high.)

We are very dependent on fossil fuels for making our food supply possible and for our ability to make metals in reasonable quantity. Fossil fuels are also necessary for making concrete and glass in reasonable quantities, and for making modern renewable energy, such as hydroelectric dams, wind turbines, and PV panels. We cannot keep 7 billion people alive without fossil fuels. Perhaps the quantity of fossil fuels consumed can be temporarily reduced from current levels, but with continued population growth, any savings will be quickly offset by additional mouths to feed and by the desire of the poorest segment of the population to have the living standards of the richest.

Unfortunately, the correct version of the paradigm seems to be, “Overshoot and collapse is to be expected.” This is what happens in nature, whenever any species discovers a way to way to increase its energy (food) supply. Yeast, when added to grape juice will multiply, until the yeast have consumed the available sugars and turned them to alcohol. They then die.

The same pattern has happened over and over with historical civilizations. They learned to use a new approach that allowed them to increase food supply (such as clearing land of trees and farming the land, or adding irrigation to an area), but eventually population caught up. Research shows that before collapse, they reached financial limits much as we are reaching now. The symptoms, both then and now, were increasingly great wage disparity between the rich and the working class, and governments that needed ever-higher taxes to fund their operations.

Eventually a Crisis period hit these historical civilizations, typically lasting 20 to 50 years. Workers rebelled against the higher taxes, and more government changes took place. Governments fought wars to get more resources, with many killed in battle. Epidemics became more of a problem, because of the weakened condition of workers who could no longer afford an adequate diet. Eventually the population was greatly reduced, sometimes to zero. A new civilization did not rise again for many years.

Figure 2. One possible future path of future real (that is, inflation-adjusted) GDP, under an overshoot and collapse scenario.

It seems to me that unfortunately overshoot and collapse is the model to expect. It is not a model anyone would like to have happen, so there is great opposition when the idea is suggested. Overshoot and collapse is very similar to the model described in the 1972 book Limits to Growth by Donella Meadows and others.

Role of Economics, Science, and Technology Paradigm

The MSM paradigm seems to be, “Economics and the businesses that make up the economy can solve all problems.” Growth will continue. New technology will solve all problems. We don’t need religion any more, because we now understand what makes people happy: More stuff! As long as the economy can give people more stuff, people will be satisfied and happy. Economics even can allow us to find “green” solutions that will solve environmental problems with win-win solutions (assuming you believe MSM).

The Green version of the paradigm seems to be, “Science and technology can solve all problems, and can properly alert us to future problems.” Again, we don’t need religion, because here we can put our faith in science to solve all of our problems.

I am not sure the Green version of the paradigm is any more accurate than the MSM media version. Science is not good at figuring out turning points. It is very easy to miss interactions that are outside the realm of science, and more in the realm of economics–for example, the fact high-priced oil is not an adequate substitute for cheap-to-extract oil, and it is the lack of cheap oil that is causing a major portion of today’s problem.

It is also very easy to put together climate change models that are based on far too high assumptions of the amount of fossil fuels that will be burned in the future, because economic interactions are missed. If debt collapse brings down the economy, it will bring down all fossil fuels at once, meaning that the vast majority of what we think of as reserves today will stay in the ground forever. A debt collapse will also affect renewables, by cutting off production of new renewables, and by making maintenance of existing systems more difficult.

The real paradigm should be, “Neither science and technology, nor economics can solve the problems of humans. We have instincts similar to those of other species to reproduce in far greater numbers than needed for survival, and to utilize all resources available to us. This leads us toward overshoot and collapse scenarios, even though we have great knowledge.

Because of our propensity toward overshoot and collapse scenarios, humans have a real need for a “moral compass” to tell us what is right and wrong. If there is no longer enough food to go around, how do we decide which family members should get it? Is it OK to start a civil war, if there are not enough resources to go around? There is also a need to deal with our many personal disappointments, such as finding that the advanced degrees we worked so hard on will have little use in the future, and that life expectancies are much lower. Perhaps there is still a need for religion, even though many have abandoned the idea. The “story line” of religions may not sound exactly reasonable, but if a particular religion can provide reasonable guidance on how to handle today’s problems, it may still be helpful.

Climate Change Paradigm

The MSM view of climate change seems to vary with the country. In the US, the view seems to be that it is not too important, and that it can be adapted to. Perhaps the models are not right. In Europe, there is more belief that the models are right, and that local cutbacks in fossil fuel consumption will reduce world CO2 production.

The Green view of climate change seems to be, “Of course climate change models are 100% right. We should rationally be able to solve the problem.” There is only the minor detail that humans (like other species) have a basic instinct to use energy resources at their disposal to allow more of their offspring to live and to allow themselves personally to live longer.

Unfortunately, a more realistic view is that climate change may indeed be happening, and may indeed by caused by human actions, but (1) we are already on the edge of collapse. Moving collapse ahead by a few months will not solve the climate change problem, and (2) collapse itself is an even worse problem than climate change to deal with.  By the time rising ocean levels become a problem, population is likely to be low enough that the remaining population can move to higher ground, and agriculture can move to where the climate is more hospitable.

Climate change may indeed cause population to drop even more than it would if our only problem were overshoot and collapse. But because the cause is related to human instincts (having more offspring than needed to replace oneself and the drive to use energy supplies that are available), changing the underlying behavior is extremely difficult.

Over the eons, the earth has been cycling from one climate state to another, with one species after another being the dominant species. Perhaps natural balances are such that the time has now come that humans’ turn as the dominant species is over. The earth is now ready to cycle to a state where some other species is dominant, perhaps a type of plant that can use high carbon dioxide levels. If this is the case, this is another disappointment that we  will need to deal with.

Nature of  Our Problem Paradigm

The MSM’s paradigm seems to be, “Our problem is getting the economy back to growth.” Or, perhaps, “Our problem is preventing climate change.

In a way, the MSM paradigm of “Our problem is getting the economy back to growth,” has some truth to it. We are slipping into financial collapse, and in a sense, getting the economy back to growth would be a solution to the problem.

The underlying problem, however, is that oil supply is getting more and more expensive to extract. This means that an increasing share of resources must be devoted to oil extraction, and to other necessary activities (such as desalinating water because we are reaching fresh water limits as well). As a result, the rest of the world’s economy is getting squeezed back. See my post Our Investment Sinkhole Problem. Squeezing the world’s economy creates great problems for all of the debt outstanding. The likely outcome is widespread debt defaults, and collapse of the world economy as we know it.

The Green paradigm seems to be, “We have a liquid fuel supply problem.”  If we can solve this with other liquid fuels, or with electricity, we will be fine. Many Greens also emphasize the climate change problem, so their big issue is finding electric solutions for the liquid fuel supply problems. There is also an emphasis on local food production, especially with respect to perishable foods.

Unfortunately, the real problem seems to be, “We are facing a financial collapse scenario that is likely to wreak havoc on all energy sources at once.” Using less oil products may be helpful for a while, but in the long term, we are dealing with an issue of major system collapses. Using less of a particular product “works” as long as the supply chain for that product is still intact, including the existence of all of the factories needed to make the product, and the existence of trained workers to operate the factories. Banks also need to remain open. World trade needs to continue as well, if we are to keep our supply chains operating. The real danger is that supply chains for many essential services, including fresh water, sewage disposal, medicines, grain production, road repair, and electricity transmission repair will be interrupted. As a result, we will need to find local solutions for all of them.

The situation we are facing is not at all good. While we can do a little, it will be very challenging to build a new system that does not use fossil fuels. In the past, when the world did not use fossil fuels, the population was much lower than today–one billion or less.

Also, in the past, we started simple, and gradually added complexity to solve the problems that arose. This time around, we need to do the reverse. We already have very complex systems, that are too difficult to maintain for the long term. What we need instead is simpler systems that can be maintained with local materials. This is not a direction in which science and technology is used to working.

Creating new systems that require only local resources (and a few other resources, if transport can be arranged) will be a real challenge. Areas of the world that have never adopted modern technology would seem  to have the bast chance of making such a change.

Importance of Tomorrow Paradigm

MSM seems to assume that we can save and plan for tomorrow. Greens have a similar view.

Perhaps, given the changes that are happening, we need to change our focus more toward to day, and less toward tomorrow. How can we make today the best day possible? What are the good things we can appreciate about today? Are there simple things we can enjoy today, like sunshine, and fresh air, and our children?

We have come to believe that we can and will fix all of the problems of tomorrow. Perhaps we can; but perhaps we cannot. Maybe we need to simply take each day as it comes, and solve that day’s problems as best as we can. That may be all we can reasonably accomplish.

Posted in Gail Tverberg | Comments Off on Reaching Oil Limits – New Paradigms are Needed by Gail Tverberg

Energy Watch Group. Peak Uranium 2020-2035

Energy Watch Group. March 2013. Fossil and Nuclear Fuels – the Supply Outlook (172 pages)

Uranium production peaks for the same reasons as oil, coal, and natural gas: the depletion of easy and cheap to develop mines.  EWG’s guess is peak will happen between 2020 and 2035.

150 reactors have already been shut down. The 437 reactors still in operation are an average of 26 years old. The average operation time of reactors already shut down was 23 years, even though some reactors achieved operation time s close to 50 years. For the scenario projections , it is assumed that reactors now in operation will on average be shut down after 40 years of service. If no new reactors were constructed, global nuclear capacity would decline by about 70% until 2030 (red broken line in Figure 23). The figure also shows how many new reactors must be grid connected each year just to keep electric power capacity constant (blue bars). This would require a substantial increase in new construction starts with up to 30 GW/yr of total new capacity, plus 7 GW of new construction to match the low scenario forecast by NEA 2011 (lower purple broken line). In order to match the high forecast by NEA 2011, more than 15 GW would need to be added a year (pink bars which correspond to the upper purple broken line).

EWG figure 23 nuclear power plants

Figure 23: Historical development of nuclear power capacity and scenario until 2035. Source:  International Atomic Energy Agency (PRIS), September 2012

Nuclear Power Plants Worldwide

435 operational reactors allocate a total net electric capacity of 370 GW

Nuclear Power Plants Worldwide EWG


  • Green Line: net electrical capacity of plants connected to the grid.
  • Red line (right axis) accumulates the net capacity of all operational nuclear power plants worldwide.
  • Blue Bars: construction starts

In recent years the construction start of nuclear power plants has gained momentum. Since 2006, the construction of reactors with an additional capacity of 48 GW started. Currently a total of 62 GW are under construction including 10 GW of electric capacity with a construction start prior to 2000. Some of those reactors are under construction since the 1980s. If and when this 10 GW reactor capacity will ever go online is very uncertain. The capacity which was shutdown each year is not shown.

The service life for most reactors is between fifteen and forty years. Today the majority of the reactors (and capacity) in operation are more than 25 years old. Only 10 percent of the net electrical capacity is below 20 years of age. This means that the majority of operating reactors will be shut down permanently within the next two decades.

China, Russia, Korea (Rep. of) and India account for 85 percent of the net electrical capacity being under construction right now (not counting construction starts prior to 2000). With a share of over 50 percent, China is currently constructing the largest capacities. The European share (without Russia) adds up to only 6 percent.

To sustain the current net capacity of 375 GW about 250 GW (equalling 66 percent of current global capacity) have to be added until 2035.

The additional required capacity can be supplied either with newly constructed reactors, and/or the prolongation of the life-span of operating reactors, and/or the reactivation of existing reactors currently having the status “longterm shutdown”. The capacity that can be supplied from long-term shutdown reactors is minimal and amounts to only 3 GW (five reactors, shutdown since 1995 and 1997). If the average reactor lifespan is extended from the assumed 40 years to an average of 50 years, the need to construct new reactors is reduced by 95 GW until 2035. With an extended reactor lifespan of 50 years a total of about 150 GW have to be constructed until 2035 to keep the nuclear electricity production at current level.

Assuming a construction time of 5 years, on average the construction of 8 GW per year (50 years reactor lifetime) respectively 14 GW/a (40 years reactor lifetime) has to commence every year between 2012 and 2030 in order to sustain the current production level. To meet the NEA 2011 low case scenario, on average every year a capacity of between 17 GW/yr (50 years reactor lifetime) and 22 GW/yr (40 years reactor lifetime) has to be added.

Future uranium demand and supply

The NEA 2011 forecast on nuclear power capacity (540 GW in the low case, 746 GW in the high case) leads to a uranium fuel demand between 95 and 130 ktU/yr in 2035. Assuming a linear capacity growth, a total of 2,000 to 2,500 kt uranium are needed until 2035 to power all reactors. The reasonable assured resources with extraction costs below 80 $/kgU are not sufficient to meet this demand. If the uranium supply is extended to the cost category <130 $/kgU RAR, this would be barely enough to meet the fuel demand in the NEA low case scenario for the next 10 – 20 years.

Figure 113 shows the fuel demand for both NEA 2011 forecasts. The dark green area indicates the  possible future uranium production from Reasonable Assured Resources with extraction costs below 80 $/kgU. The light green area indicates additional uranium (+ 1,441 kt RAR) that can be produced at cost of 80 to 130 $/kgU. The blue area shows the maximal amount of additional fuel (+ 3,641 ktU) that can be produced at costs below 260$/kgU while also including Inferred Resources.

Nuclear Power Plants Uranium supply EWG


EWG’s best guess at likely uranium production is  somewhere in between Figure 114 and 115 (My comment: but with oil having peaked in 2012 and being needed to grow food rather than mine uranium, and the likelihood aging plants will have a meltdown or other major disaster like Fukushima, means that far fewer nuclear plants are likely to be built than forecast, and far less uranium mined as well):

Nuclear Power Plants Uranium production fig 114 EWG

Nuclear Power Plants Uranium production EWG


ccccccc


Posted in Nuclear Power Energy, Peak Uranium | Tagged , | Comments Off on Energy Watch Group. Peak Uranium 2020-2035

Energy Watch Group 2013 Natural Gas Supply Outlook

Energy Watch Group. March 2013. Fossil and Nuclear Fuels – the Supply Outlook (172 pages)

Summary (see report for details)

This report also contains scenario projections for the future supply of natural gas. These are performed in similar depth as the projections of future oil supply. Important findings are:
Conventional gas production is in decline in Europe and North America which together hold almost 35 per cent of world gas production.

Unconventional gas production, predominantly shale gas production, has increased US production in the last years since the exemption of the gas industry from environmental regulations of the Safe Drinking Water Act (SDWA). Now shale gas has a U.S. market share of 30 percent.

Shale gas production in the USA is unlikely to see a significant further expansion. Due to the particular production dynamics of shale gas it will decline as soon as new wells are not being developed any more at an adequate rate. The decline of shale gas production from 2015 onward will add to the decline of conventional gas production. In 2030 gas production in the US probably will be far below present production levels.

Gas production in Europe has been in decline since the turn of the century and will continue to follow that trend. Shale gas production will not play a role comparable to the one in U.S., since geological, geographical, and industrial conditions are much less favorable. In order to keep gas consumption in Europe flat or rising, imports will need to increase by at least additionally 200 billion m3/yr.

Russia, the second largest natural gas producer closely behind the U.S., faces a struggle between declining production from aging fields and new expensive and time consuming developments in Northern Siberia and offshore. Russian gas production reached a first peak in 1989 when the largest fields passed peak production. Gazprom production never reached that level again. Aging fields force Russia to speed up the development of new fields. The developments of Shtokmanskoye in the Barents Sea and of other fields in Yamal are delayed. If the gas fields in the Yamal Peninsula would be developed in time, they would have produced 310-360 bcm in 2030 according to Gazprom. But even this will not be sufficient to compensate for the decline of aging current fields.

Domestic consumption in Russia and growing demand from Asia will put increasing pressure on volumes available for export from Eurasia to Europe in the coming years.

The Middle Eastern countries Iran and Qatar are expected to feed the rising demand for liquefied natural gas over the next decades. Though these countries have large reserves, it is highly probable that reported reserves are exaggerated.

Posted in Natural Gas | Comments Off on Energy Watch Group 2013 Natural Gas Supply Outlook

No More Oil Exports by 2030

Jeffery J. Brown. 10 Jun 2013. Commentary: Is it only a question of when the US once again becomes a net oil exporterASPO-USA


Key points made in this article:

  • In just 17 years given current trends, China and India would be consuming 100% of all exported oil
  • In order to be crude oil independent by 2023, we would need to add, over 10 years, the productive equivalent of the 2012 crude oil production from Saudi Arabia + Iraq + Kuwait.
  • At a 10% per year decline rate, to maintain a production rate of 7.5 million b/d out to 2023, the US oil industry would have to replace the productive equivalent of every single oil field in the USA–everything from the Thunder Horse Complex in the Gulf of Mexico, to the Eagle Ford Play, to the Permian Basin, to the Bakken Play to the North Slope of Alaska.

In a recent Radio Free Europe/Radio Liberty interview with Daniel Yergin, the interviewer had the following rather remarkable question, “How will the fact that the United States is going from an oil importer to a net oil exporter change its foreign policy calculations?” The underlying premise–that the US would soon be a candidate for membership in OPEC–was not challenged by Mr. Yergin, and he talked about the implications of a steady increase in US and North American oil production.

Given the apparently widespread view that it is not if, but when, that the US becomes a net oil exporter, I thought that it would be a worthwhile exercise to examine the challenges facing the US oil and gas industry, as an ever greater percentage of US oil and gas production comes from very high decline rate oil and gas wells, especially in the context of what has been a post-2005 decline in Global Net Exports of oil (GNE).

ExxonMobil put the annual decline rate from existing well-bores in the 4%/year to 6%/year range a few years ago. For the sake of argument, let’s assume that the decline rate from existing US oil wells was about 5%/year in 2008, when the US hit a recent low crude oil production rate of 5.0 million b/d. Of course, the 2005 Gulf Coast hurricane damage contributed to the 2004 to 2008 decline in production. In this paper, I am using the EIA’s definition of crude oil, which is crude + condensate.

Let’s assume that US crude oil production averages 7.5 million b/d in 2013, and let’s make (in my opinion a conservative) assumption that the decline rate from existing US oil wells averages 10 percent/year over the next 10 years, as an increasing percentage of US production comes from high decline rate shale/tight plays.

At a 10 percent /year decline rate, in order to simply maintain a production rate of 7.5 million b/d out to 2023, the US oil industry would have to replace the productive equivalent of every single oil field in the United States of America–everything from the Thunder Horse Complex in the Gulf of Mexico, to the Eagle Ford Play, to the Permian Basin, to the Bakken Play to the North Slope of Alaska.

Or let me put it this way, at 5%/year decline rate, in 2008 the US lost 250,000 b/d per year due to declining production. At a 10%/year decline rate and a production rate of 7.5 million b/d, we would lose 750,000 b/d this year due to declining production.

In other words, a 50% increase in net production plus an increase in the decline rate from 5 percent /year to 10 percent /year would lead to a tripling in the volume of crude oil production lost every year due to production declines from existing wellbores.

Assuming an annual loss of about 750,000 b/d from existing wellbores, the gross increase in production would have to exceed 750,000 b/d in order to show a net increase in production. For example, let’s assume that we average 7.5 million b/d in 2013, and let’s assume that we lose 750,000 b/d from existing wellbores this year. In order to show a net increase of 0.25 million b/d from 2013 to 2014 (from 7.5 to 7.75 million b/d), the industry would have to show a gross increase in production of 1.0 million b/d, which would be the production from new wells in 2014 that were not producing in 2013.

In regard to the possibility of becoming crude oil self-sufficient, probably the simplest way to look at the US supply and demand situation is to focus on crude oil production versus refinery inputs.

Let’s use the above assumptions, to-wit, annual US production of 7.5 million b/d in 2013, with an overall decline rate from existing wellbores of 10 percent/year. The decline rate will probably continue to increase, but for simplicity, let’s assume that it averages 10 percent/year. As noted above, in order to maintain a constant 7.5 million b/d production rate out to 2023, given a 10 percent/year decline rate, we would have to replace the productive equivalent of 100% of current US crude oil production.

We are currently processing about 15 million b/d of crude oil in US refineries. A portion of the refined product is exported, and then we have refinery gains plus biofuels plus natural gas liquids, but let’s ignore all of that and focus on crude oil production versus refinery inputs. Currently, we are producing about half of the crude oil inputs into US refineries, and importing the other half.

If we want to produce, in 2023, 100% of the crude oil that we currently process in US refineries, based on the above assumptions (especially a 10 percent /year decline rate), we would need to add the 7.5 million b/d, in order to offset declines, plus add another 7.5 million b/d over 10 years, for a total of 15 million b/d of new production, or about 1.5 million b/d per day per year for 10 years. And of course, once we reach the 15 million b/d level, assuming a 10%/year decline rate, we would need 1.5 million b/d of new production, every year, just to maintain the 15 million b/d production rate.

To meet the 1.5 million b/d per year rate, in order to be crude oil independent by 2023, in round numbers we would need to add–every single year–the combined current productive equivalent of the Bakken Play + the Eagle Ford Play. Or, we would need to add, over 10 years, the productive equivalent of the 2012 crude oil production from Saudi Arabia + Iraq + Kuwait.

This exercise illustrates why peaks happen, and it shows why production declines are inevitable. On the upslope of a production increase, new oil wells can offset the declines from existing wellbores, but with time, new oil wells can no longer offset the increasing volume of oil lost to production declines.

And of course the overall decline rate from existing US gas wells is almost certainly even higher than for oil wells.

We are currently averaging about 66 BCF/day (billion cubic feet per day) in dry natural gas production in the US (EIA). If we assume an overall 20%/year decline in natural gas production from existing wellbores, the industry would have to put online the productive equivalent of 100% of current US dry natural gas production over the next five years, in order to maintain a production rate of 66 BCF/day.

So, based on a 10%/year decline rate for oil wells and a 20%/year decline rate for gas production, in order to just maintain a crude oil production rate of about 7.5 million b/d and a natural gas production rate of 66 BCF/day, in round numbers the industry would have to add the productive oil equivalent of one new Bakken play every year and the productive gas equivalent of more than two Barnett Shale plays–every single year, year after year.

Globally, the dominant trend we are seeing is a post-2005 decline in Global Net Exports of oil (GNE), which I define as the combined net oil exports from the top 33 net oil exporters in 2005, as the developing countries, led by China, so far at least have consumed an increasing share of a post-2005 declining volume of GNE. Of course, this means that developed net oil importing countries like the US have to make do with a declining share of a declining volume of GNE. And the US is still dependent on imports for about half of crude oil processed in US refineries. The post-2005 decline in GNE, combined with increasing demand from developing countries were, in my opinion, the primary factors that contributed to global annual (Brent) crude oil prices more than quadrupling from $25 in 2002 to $112 in 2012.

Currently rising US crude oil production is very important, but in all likelihood we will see a continuation of the “Undulating Decline” pattern that we have seen in US crude oil production since it peaked in 1970–set against the backdrop of what will probably be a continuing pattern of developing countries, led by China, consuming an increasing share of a smaller post-2005 supply of Global Net Exports of oil.

In fact, recently released EIA data confirm a continuation of a pattern that we have seen since 2002, to wit, China and India have been consuming a steadily increasing share of GNE. At the 2005 to 2012 rate of decline in the ratio of GNE to China and India’s combined net oil imports, in only 17 years China and India alone would theoretically consume 100% of global net exports of oil.

For more information on Global Net Exports of oil, following is a link to my recent paper on the Export Capacity Index concept.

For a concrete example of how the Export Capacity Index (ECI) concept works, consider two countries that are widely considered to be critically important sources of future crude oil production: Brazil and Iraq. If we extrapolate the 2008 to 2012 rate of decline in Brazil + Iraq’s combined ECI ratio (the ratio of liquids production* to consumption), they would collectively approach zero net oil exports in about 20 years.

Given Brazil’s status as a net oil importer in 2012, even if we count biofuels, it’s instructive to consider what the conventional wisdom was just a few years ago regarding Brazil. In April, 2009 Bloomberg published a column discussing the prospect for Brazil continuing “to take market share away from OPEC.”

We should keep case histories like this in mind when we read in the media about the “Fact” that the US will soon be a net oil exporter, and while there are always uncertainties in forecasting future trends, we can be certain of three objective facts: (1) All oil fields, sooner or later, peak and decline; (2) Global crude oil production is the sum of discrete oil fields that peak and decline and (3) Given an ongoing production decline in an oil exporting country, it is an mathematical certainty that unless domestic consumption in that oil exporting country falls at the same rate as the rate of decline in production, or at a faster rate, the resulting net export decline rate will exceed the production decline rate and the net export decline rate will accelerate with time.

*EIA data, production = total petroleum liquids + other liquids (mostly biofuels in the other liquids category)

The Export Capacity Index (ECI): A New Metric For Predicting Future Supplies of Global Net Oil Exports 

April, 2009: OPEC Cuts Thwarted as Brazil, Russia Grab U.S. Market 

Jeffrey J. Brown is a licensed professional geoscientist. He is responsible for the discovery of several oil and gas fields in West Central Texas, and currently manages an exploration program searching for oil and gas fields in this region. Jeff has conducted analysis of Peak Oil issues for many years, and has authored numerous articles with a special emphasis on global oil exports.


Posted in Exports decline to ZERO | Comments Off on No More Oil Exports by 2030

Why Banks and Wall St will go broke if interest rates ever go up

Dumb Money Day 1 by Charles Marohn, Strong Towns   Jun 10, 2013

This week I want to write about one very technical finance subject and the implications for the housing market and, by extension, for cities and the great reset we are going through). I want to bolster those of you that inherently believe that there is something rotten at the core of the economy. I want to give you context for all the propaganda being thrown at you about how our economy is getting back on track (record stock prices and accelerating housing market being two oft-repeated benchmarks). I don’t want you to slide back into the Ponzi Scheme, especially since the market’s need for dumb money is so intense right now. This week is about giving you confidence to stay the course.

First we are going to start with a lesson on debt and something called the “carry trade.” Let’s start with a very simplified explanation of how debt is used to magnify returns.

Let’s say I have $1,000. I use it all to go out and buy a 30-year treasury note paying 3.5% (roughly the current rate). I now own a $1,000 note that will pay 3.5% ($35) annually for each of the next 30 years, after which my original $1,000 will be returned to me.

With that $1,000 note as collateral, I now go and borrow $900. I have 10% equity here — some skin in the game — but I’m still pledging the entire $1,000 so I can borrow another $900. I get the additional $900 and use that to buy 30-year treasury notes at 3.5%. Understand what I’ve done: I started with $1,000 and now, after one iteration of leverage, I have $1,900 in treasury notes along with a $900 debt. It’s the same amount of money — $1,000 — but deployed differently in the market.

Now I take my $1,900 in treasury notes and I go through this leverage process again, essentially pledging that collateral for a loan of 90%, or $1,710. I promptly buy another $1,710 in AAA rated 30-year US treasuries. Good as gold. My $1,000 has now gotten me $3,610 in treasury notes along with $2,610 worth of debt. I still have more assets than liabilities, meaning I still have equity and everything I owe is fully collateralized with AAA securities.

This cycle continues again and again and again until my $1,000 yields $47,046 in 30-year treasuries along with $46,046 in debt. This is roughly the ratios of leverage that firms like Goldman and Bear Stearns were at when they went under and, reportedly, the levels that many of the remaining Wall Street banks are at today.

Why would a bank take on so much debt? The answer is something called the carry trade. While I said that our $1,000 is being used to buy 30-year notes at 3.5%, I didn’t say what rate we were borrowing at. Obviously, if we had to borrow at a rate higher than 3.5% — which you and I would have to for something like this — we’d lose money in this trade. That’s not how things work for banks, however.

A bank can borrow overnight today at essentially no cost. The bank borrows $46,046 this morning and promises to repay you at the end of the day. There is a tiny charge, but not much. Even if they were borrowing for 90 days — the rate is going to be really low (say, 0.1%) thanks to the Federal Reserve artificially suppressing interest rates. At the end of 90 days, you just roll that debt over into a new 90-day loan.

So the carry trade is simple. You borrow at a low rate and lend back at a high rate. In this case you borrow for 90-days at 0.1% and then lend out at 3.5% for a 30-year note. In the first year, you have to pay 0.1% on your $46,046 debt (that’s $46), but you make 3.5% on your $47,046 in 30-year treasuries (that’s $1,647).

I know this is a lot of numbers, but pause there for a second and understand what you just read. You started this exercise with $1,000. Due to your ability to leverage and the artificially low rates you pay on that debt, you pay $46 in interest expense and have $1,647 in interest earnings. In other words, your $1,000 earned you $1,601 in pure profit. You can sell all your securities, pay off all of your debts and walk away at the end of one year with a profit of 260%. Now just imagine that, instead of $1,000, you were talking about $100 billion.

Generally, it’s not that easy. The carry trade has some obvious risk involved. By financing short term to purchase a long term security, you are taking a very real risk that short term rates could rise and invert the trade. Let’s say short term rates rose to 5%, the historical average over the past thirty years. Now you have a 30-year security paying just 3.5% but you are paying 5% on your financing. You are going to burn through your $1,000 in equity very quickly and then you’re insolvent. Nobody is going to lend to you short term, or any term, and it’s all over.

But what if you just sold your long term notes to pay off the debt? Well, when short term rates rise, long term will rise as well. If I am going to take a long term risk, I’m going to demand a higher interest rate than I could get for a short term risk. So if short term rates go from zero to 5%, long term rates would make at least that bump, from 3.5% to 8.5%.

Why is that important? If I’m in the market trying to buy a 30-year note and I can get one paying 8.5%, how much am I going to be willing to pay you for your $1,000 note that is paying just 3.5%? The answer: a lot less than $1,000. In other words, as those long term interest rates rise, your long term securities are now worth less. This trade is now blowing up on both sides; your financing costs are rising while your asset value is falling. That’s a deadly combination.

So the carry trade has a lot of risk…..that is, unless the Federal Reserve signals very clearly that they are going to keep interest rates low and stable for an extended period of time. When that happens, the carry trade is on and becomes a relatively low risk way to make a lot of money very quickly.

Summary:

  • Big banks and large investors have the capacity to leverage modest amounts of equity into large market positions by taking on debt.
  • One form of the carry trade takes advantage of the interest rate difference between short term and long term securities.
  • Interest rates kept artificially low and stable reduce the risk associated with that form of a domestic carry trade.

Dumb Money Day 2   Jun 11, 2013

Yesterday we looked at how debt is used to generate high returns, particularly for a small subset of the population and especially during times when central policy makers commit to extended periods of low, stable interest rates. Today we’re going to add a couple more pieces of financial background before we move on and apply this to our current situation.

We all understand how savings work. We put our money in a bank and are paid a rate of interest for our capital. The bank then turns around and loans that money out at a higher interest rate, a mechanism by which they (a) make money and (b) pay depositors interest. If you had a lot of money, you could make your own loans, but for most of us (and even for the wealthy) it makes more sense to diversify over many projects and have the bank, made up of financial experts, evaluate projects on your behalf.

So, in normal times, we must save to invest. The bank is not going to have any money to loan out unless people deposit money into it. (If you want a more detailed explanation, note that banks are part of the process in which money is created, a process described eloquently by Chris Martenson in this Crash Course video.)

Here’s the next critical insight: In a normal market system, interest rates represent the supply and demand for capital. If there is a lot of demand for money from businesses and individuals that want to borrow, then a bank will raise interest rates to encourage people to save more. If the bank has too much money and not enough people asking for loans, then interest rates will drop. Now banks borrow money back and forth among each other which tends to even things out across institutions, but every now and then you’ll see one pop up with a rate quite a bit on one side of the curve. Something’s going on — they either have a big deal and they need some capital or they have too much money and are having a tough time putting it to productive use.

Now enter the Federal Reserve System and national, centralized monetary policy. When the Federal Reserve intervenes to manipulate interest rates, it is distorting the relationship between supply and demand of capital. If the Fed raises rates, it will encourage people to save and if the Fed lowers rates, it will encourage people to do something else with their money. This is irrespective of what would naturally be happening in the market.

This is an accepted practice among nearly all economists. According to their theories, when the economy needs a kick in boot, the Federal Reserve should lower interest rates to make capital easier for people to borrow. When the economy is overheated, manipulating interest rates higher is a way to dampen that.

It is important to understand the mechanism the Federal Reserve uses to raise and lower interest rates. To lower rates, the Fed simply buys treasury notes. When they buy the notes from Wall Street banks, those banks then have a lot of cash and so they need more borrowers, fewer savers. Thus interest rates go down. To raise rates, the Fed does the opposite and sells notes. When it does that, it is putting these US treasury certificates — instruments of savings — out there and taking the cash back in return (which they put under their mattress). This reduces the amount of cash the banks have and, to have money to lend, banks then need to raise interest rates.

So let’s put these two things together; When the Federal Reserve determines that the market is not working correctly — generally that growth, unemployment and inflation are not being optimized — they will intervene to manipulate the market interest rate.

There is one more concept you need to understand: the Mortgage Backed Security (MBS). As an analogy, if you created a company, had that company buy a thousand mortgages, then you sold a thousand shares in that company, each of those shares would be an MBS. With that MBS, instead of owning the debt of one mortgage, you would own 1/1000 of each. You are essentially spreading out your risk over a wider pool, just like a bank does when they do multiple loans.

Mortgage Backed Securities are important for one reason: yield. Yield is the interest rate at which the MBS pays. Due to the fact that there is more risk in an MBS than in a Federal Treasury note — even when that MBS is rated AAA — the MBS is going to pay a higher interest rate.

Now go back to yesterday where I described the carry trade. An MBS with a higher yield and a generally shorter maturing period (few mortgages make it the full 30 years w/o a refi) is a much more attractive than a 30-year Treasury note with a higher return and less long term risk, a nice combo when trying to spur home purchasing.

You may remember the Federal Reserve’s Operation Twist. This was a shift by the Federal Reserve from buying short term Treasury notes to long term notes, driving down the interest rates on those longer notes even further. The effect of this is to make those MBS investments even more attractive by comparison.

Summary:

  • In a normal economy, we must save to invest.
  • In a normal economy, interest rates represent the supply and demand of capital.
  • When the Federal Reserve determines that the market is not working correctly — generally that growth, unemployment and inflation are not being optimized — they will intervene to manipulate the market interest rate.
  • Mortgage Backed Securities provide a higher yielding, shorter term investment than long term Treasury notes.

Dumb Money Day 3

On Monday, we showed how banks and large investors have the capacity to leverage modest amounts of equity into large market positions by taking on debt. We also explained one form of the carry trade that takes advantage of the interest rate difference between short term and long term securities, a trade that has much less risk when interest rates are kept artificially low and stable.

On Tuesday, we pointed out that a normal economy requires savings in order to have money that can be loaned out by banks and that interest rates are the market’s mechanism for balancing savings and investment. This equilibrium is manipulated by the Federal Reserve to discourage or encourage savings in an effort to optimize market outcomes. Finally, Mortgage Backed Securities — a financial product consisting of home mortgages — provide a higher yielding, shorter term investment than long term treasury notes.

So let’s move on to the red flags, as indicated by the Federal Advisory Council, a group that regularly advises the Federal Reserve. Here is how the FAC is described on the Fed’s website:

The Federal Advisory Council (FAC), which is composed of twelve representatives of the banking industry, consults with and advises the Board on all matters within the Board’s jurisdiction.

The most recent FAC meeting was May 17, the minutes of which can be found here. While the fifteen pages are generally full of statements that support current Fed policies and give endorsement to the notion of a gradual recovery in the economy, the last page has some very revealing insights. The FAC asked their opinion on current Fed policy, which is essentially manipulating the overnight borrowing rate to zero and using quantitative easing to further manipulate downward short term and long term treasuries. Here are some of their statements, which I’ll provide some comments on.

The Fed’s securities purchases have reduced mortgage yields and, to a lesser extent, Treasury yields. Current low bond yields are disruptive to management of fixed-income portfolios, retirement funds, consumer savings, and retirement planning. They may encourage unsophisticated investors to take on undue risk to achieve better returns.

The first sentence is essentially what we’ve been discussing here — yield is the interest rate and the Fed has been driving down rates. The second and third sentences can be read like this: because your savings account is not paying any interest (or your pension fund, 401(k), etc…), in order to have some earnings, you need to put your money elsewhere.

That’s the “undue risk” part, AKA: dumb money.

When your pension fund, for example, is underfunded by 25% and that already assumes an 8% annual return from now on, very low interest rates on risk-free securities means that, to avoid falling further behind, the fund needs to invest more and more into higher risk areas. While we may think of the unsophisticated investor as the kid betting on dot.com stocks, we can just as easily think of them as the pension fund manager being sold the comparatively high-yielding Mortgage Backed Security that is very risky yet rated AAA by Moodys.

If you want to remove for yourself the veneer of sophistication surrounding Wall Street and investment in general, read Liar’s Poker or The Big Short, two essential Micheal Lewis novels.

Unsophisticated is essentially a euphemism for “dumb money,” which includes everyone not part of the inside operation (and even many of those that are.) This is not a commentary on intelligence, but access to information and, increasingly, access to bandwidth.

The FAC is indicating that, with interest rates directed by the Fed to remain low for a long time, capital is moving from safe to risky investments. Junk bonds are now paying around 5%. Junk bonds are the packaged debt of high risk corporate borrowers. Just a few years ago, these very risk funds paid over 20% interest. So much money is flowing out of zero-interest, safe havens and into high risk places that is huge competition for even junk.

MBS purchases account for over 70% of gross issuance, causing price distortion and volatility in the MBS market. Fixed-income investors worry that attractive mortgage-backed securities are in very tight supply.

Mortgage backed securities (MBS) pay a higher rate of interest than a treasury note. With the rates on treasury notes being artificially depressed, investors like your pension fund are looking to mortgage backed securities to increase the return.

Here’s the problem: the Fed is buying 70% of all mortgage backed securities. The remaining 30% are in high, high demand because they have a slightly higher rate of return and so are fought over by investors (i.e. a fixed income pension fund).

This all drives mortgage rates down, down, down to historic lows. Any mortgage that can make it through the origination process can be purchased, securitized and sold in short order.

Many are concerned about the Fed’s significant presence in the market. They have underweighted MBS in favor of corporate, municipal, and emerging-market bonds.

The term “underweight” here is meant to denote that investors (keep thinking pension funds) are not holding a normal share of MBS and instead are buying other, more risky, bonds. In other words, the Fed is essentially forcing investors not inclined to risk into risky investments. This is why junk bond yields are so low. If fixed-income investors could get their yield in a normal mortgage market, they wouldn’t be buying junk bonds and the interest rate on junk bonds would rise.

There’s also another risk here with the Fed dominating the mortgage market: the carry trade. If the Fed starts to exit the MBS market, rates will go up. That makes the low rate securities actually drop in value (remember: I’m not going to pay you full face value if I can get a higher rate somewhere else). Since few people are going to refinance when rates rise — we’re essentially mining the refi market right now with these low rates — MBS holders could be stuck with low yielding notes for a long time. Corporate bonds, emerging market bonds and other instruments have a quicker turnover and give a little bit more flexibility in a market where rates are rising.

There is also concern about the possibility of a breakout of inflation, although current inflation risk is not considered unmanageable, and of an unsustainable bubble in equity and fixed-income markets given current prices.

Let’s focus on the unsustainable bubble in equity and fixed-income markets.

The equities market is the stock market. The FAC is saying that all of this money printing and frantic search for yield could encourage a lot of people to invest in stocks, something that would drive up prices to unjustified — and thus “unsustainable” — levels. On the way up, this is a self-reinforcing effect; the more stocks rise and the more safer yields are depressed, the more the “dumb money” is lured into the rally. That the “smart money” counts on this reaction is a tragic reality.

Further, current policy has created systemic financial risks and potential structural problems for banks. Net interest margins are very compressed, making favorable earnings trends difficult and encouraging banks to take on more risk.

Banks can’t pay much interest. With banks competing against the Federal Reserve for places to put money, they are left with the same choices everyone else has: make no money or take uncomfortably high risks. Banks that takes risks face huge problems when the market changes.

The Fed’s aggressive purchases of 15-year and 30-year MBS have depressed yields for the “bread and butter” investment in most bank portfolios; banks seeking additional yield have had to turn to investment options with longer durations, lower liquidity, and/or higher credit risk.

With the Federal Reserve crowding everyone else out of the mortgage backed securities market — and thus sucking all the mortgages out of banks (the originators) and into the secondary market — what’s a bank to do? Two things. More transactions, meaning originate more loans and essentially make your money on fees (a dwindling market as the number of homes that could refinance but haven’t is shrinking rapidly) and take on more risk.

For at least a portion, that means that carry trade — taking short term money (deposits that can be redeemed at any time) and buying longer term notes that fewer people want (which is what is meant by “lower liquidity”). This makes the bank financially very fragile.

Finally, the regressive nature of the artificially compressed savings yields creates pent-up demand within bank deposit portfolios; these deposits may be at risk once yields begin to rise and competitive pressures increase.

Here’s the million dollar statement. Or perhaps the trillion dollar statement.

Regressive nature: the Federal reserve policy of low rates and money printing is hitting ma and pa investor really hard.

Artificially compressed savings yield: this means banks are not paying any interest because the Fed is manipulating the rate downward.

Pent-up demand within bank deposit portfolios: Without good options, people are sitting on cash. They wish they could be putting that money someplace productive, yet not overly risky.

Let’s put that together: Federal Reserve policy is hitting the average saver really hard. Those savers are going to bolt to something that pays a market rate of interest when they get a chance.

So when you read the rest of that statement — deposits may be at risk once yields begin to rise and competitive pressures increase — it could be taken one of two ways (or both).

1)      When the Fed stops intervening in the market and things go back to normal, depositors bolt immediately to higher yielding securities, say a normal 90-day Treasury paying 5%. Banks, which have been forced to invest in longer term, less liquid instruments risk losing their depositors if they don’t raise rates to match their competition. No depositors, no money, fire sale, out of business. But if they raise rates, they are struck with the downside of the carry trade and burn through their equity with the same result: no equity, fire sale, out of business.

2)      I’m not sure if the FAC is going Cyprus on us here, but they could be saying that deposits are at risk, meaning the insolvency of the banks and the sheer scale of the problem could be so great that it would exceed what a depleted FDIC could bail out. If that were the case, then your actual deposit — the money you have put in the bank — could be at risk for a partial or complete loss.

Imagine the US government saying, sorry, the FDIC is insolvent and so we’re going to take twenty cents of every dollar you have in the bank and put it into the bank itself. We’ll give you (non-redeemable) shares in the bank, though, so if it ever earns a profit you can share in that. That’s Cyprus, and probably not what the FAC meant (although some members may have).

Either way, this is not a fun time for the dumb money that is left holding the bag.

Uncertainty exists about how markets will reestablish normal valuations when the Fed withdraws from the market. It will likely be difficult to unwind policy accommodation, and the end of monetary easing may be painful for consumers and businesses.

The Fed may have things under control today, but it is not clear how they are going to remove the fingers from the dike without the whole thing collapsing. And, by the way, the water is building behind the dike and so this can’t go on forever, there needs to eventually be a change in policy back to normal markets.

But look; the entire economy is shifted to either (a) those in cash and desperate for a return to market rates so they can bolt or (b) those who have positioned themselves at great risk with assurances that the Fed will continue to keep rates low. The more people that shift from (a) to (b), theoretically the better the economy will get since there will be less hoarding (saving) and more investing and spending. The problem is, the more people following strategy (b), the more critical it is to suppress rates as rising rates will sink their investment.

And there’s the problem. The Fed is stuck in a trap of its own making. If it stops intervening, bank positions go bad, the equities market falls and mortgage rates climb, depressing housing prices, all at once. If it continues to intervene, it is only making these distortions worse, setting itself up for an even more painful unraveling, a reality summed up in the final sentence from the FAC.

Given the Fed’s balance sheet increase of approximately $2.5 trillion since 2008, the Fed may now be perceived as integral to the housing finance system.

What is your house worth? What is a company’s stock worth? What is your dollar worth? Nobody really knows because there isn’t actually a market for any of those things. Now there’s a “market” where things are bought and sold, but not a market where price discovery plays a role in determining what something costs. The very value of the currency is being manipulated, forced into risky and speculative places where it would not naturally go. We’re living through the greatest, high stakes, financial experiment in human history.

Dumb Money, Day 4   Friday, June 14, 2013 | Charles Marohn

The inspiration for this entire series was a set of people who, independently, expressed to me that there were thinking about either (a) investing in the stock market or (b) buying a home. All cited recent reports of upward trends in the price of stocks and houses as justification for their moves.

I’ve also experienced a lot of enthusiasm for municipal investments to induce growth, borrow more money to get things going and essentially get back to the economy of 2005, which is going to happen really soon for those that get in the game. I also wanted to shatter this delusion.

And finally, I’m just so frustrated with the narrative from the Krugman Keynesians. As they hold out the king-sized candy bar and tell everyone that, if we just ate another, the sugar rush would get us up off the floor and we’d then have the strength in our economy to prosper. It’s true, we can get up off the floor with another candy bar, but a lot of good, prudent and innocent people are going to get slammed hard when the sugar rush goes away. Statements to the contrary are comforting and convenient, but ultimately are reckless and harmful.

Abundant capital is a great thing. On it’s face, that is clearly true. For an economy, abundant capital will provide for investment and growth. Continuing with the human body analogy (another complex system), it is a little like saying “energy” is a great thing. When we have a lot of energy, we can accomplish a lot of things.

(I’ll also note here that too much capital causes inflation while too much energy causes hyperactivity and insomnia — abundant capital/energy has limits, for certain, but what we’re talking about here is a lack of sluggishness.)

We all understand that a body can get energy in productive ways and unproductive ways. Good sleep habits, a healthy diet and plenty of exercise is the healthy way for a body to have energy. This requires discipline and balance and, even when it is not pleasant, it requires one to listen to their body. That sore muscle is telling you something; maybe you need to stretch it more, or make sure it isn’t neglected in your routine. That headache is a good thing if it is warning you that you are dehydrated.

So the human body, a complex machine, experiences volatility and gives off warning signs when things are not optimal. Sometimes we can respond to those signs in a way that is clearly productive — we can drink more water or alter our exercise to be more balanced — but sometimes we have to resort to other means. We can’t solve a torn ACL with diet and exercise; for that we need some surgery followed by some antibiotics and pain killers.

He’s the fine line; we all understand that we ultimately need to shed the pain killers. Even Ben Bernanke and Paul Krugman will say, we ultimately need to shed the pain killers — the low interest rates and quantitative easing —  and let this patient (a sick economy) learn to walk again. The trillion dollar question is: when?

This gets me back to the statement I made on Tuesday.

In normal times, we must save to invest.

Savings is the diet and exercise of a healthy economy. We save money — delay the immediate reward of consumption — for the promise of a greater future reward. These savings, in turn, can be productively invested by others today, resulting in growth. The natural regulator between savings and investment is the interest rate.

What economic stimulus does — whether it is manipulation of the interest rate, printing of money or deficit spending — is to give us investment without the need for savings. So we get energy without the need for a healthy diet and exercise.

We can see how, in an emergency situation or on a really bad day, it might be convenient to drink a Red Bull or eat a candy bar to give ourselves an energy boost. A steady diet of Red Bull and candy bars, however, can only lead to disaster.

I have 3 graphs that show how the steady, 60 year diet of Red Bull and candy bars every time our economy has felt a little sluggish has deformed our economy. I particularly want to give some context to the recent stock market highs and housing data.

Here’s our overall economic growth as compared to debt. As we proceeded through the second life cycle of the Suburban Experiment, the lack of real productivity in the economy was replaced with Red Bull (debt). This kept the economy going, allowed us to continue to grow our GDP, but allowed us to also become increasingly unproductive. By 2005, the height of the housing boom, our ability to sustain growth was almost entirely based on Red Bull (debt) and even then, we needed to grow debt at a faster rate than the economy just to manage meager growth.

The gains we are seeing now in the stock market — paper gains — are not based on real productive growth. They are largely the result of cheap credit, something only sustainable so long as the Red Bull continues to flow at accelerating amounts. The crowding out of real savings by the Federal Reserve also means that people are being enticed into stock markets as a way to have any earnings at all. Although people have been shown to be unwilling to gamble where they can lose, when the momentum shifts and perceptions change, people are more than willing to gamble when they believe they will win.

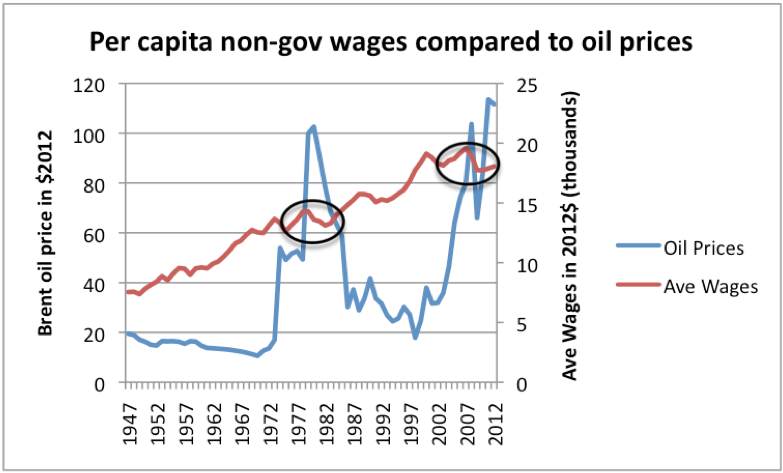
In terms of housing, this was the chart that brought together everything that I’m seeing. We’ve been treated to the media reports that median homes prices are rising. This graph shows how this relates to median incomes.

Home prices might be rising, but it is not a product of us having an economy where people are making more, earning more and having more money to invest in housing. It is an artificial creation of cheap credit. If we were transitioning to a real economy — something stable — that graph should be trending down, not up.

We must save to invest. As we got into the second life cycle of the Suburban Experiment and the growth from horizontal expansion slowed, we replaced savings with Red Bull, putting off a difficult conversation about the wisdom of our approach and, in the process, creating an even larger deformation that we will ultimately have to deal with.

This is an incredibly fragile economy. That fragility is not the construct of recent bailouts, natural economic cycles, greedy politicians, a prolific consumer, lazy freeloaders, the 99%, the 1% or any of the other groups we like to pin the blame on. It is the result of sixty years of deformation, of responding to the aches and pains with Red Bull and pain killers.

Yes, that approach – what has evolved into a supply side, Keynesian amalgamation — allowed us to grow faster, much faster, than we otherwise would have. It allowed us to live large, have an enormous standard of living, and accomplish many, many things that we would not have been able to do were we not taking economic steroids.

Smoothing of the business cycle and decades of this faux-prosperity has all come at a price, however. That price is a great unwinding. On Day 5, I’m going to provide an optimistic roadmap for how a great unwind could happen. On Day 6, I’ll give a less generous version.

Dumb Money, Day 5  June 17, 2013  Charles Marohn

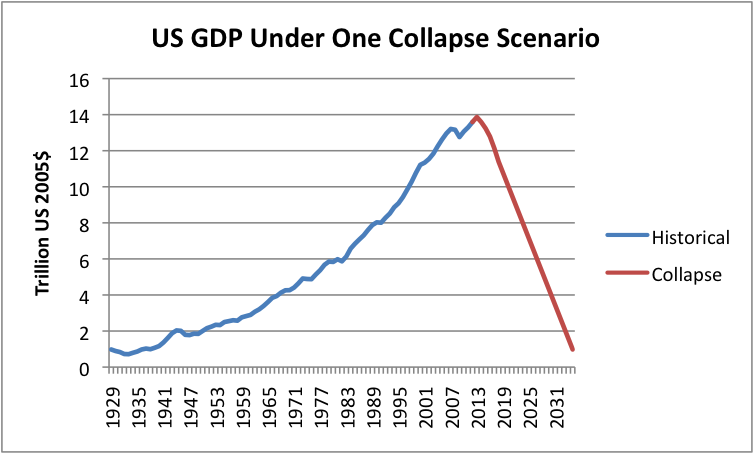
The optimistic and the pessimistic view of the future. He gives the optimistic scenario a less than 5% chance of happening.

If the Federal Reserve’s Quantitative Easing program that artificially suppresses interest rates ends, I explain what would happen in the housing market, the stock market and the federal budget.

On Day 4 I explained that: (1) stock markets gains are not real but simply a byproduct of cheap credit, (2) rising housing prices reflect this same bubble and likewise are not real and (3) we can’t make up for a lack of savings by simply printing money.

Assume, in a very optimistic sense, that Fed interventions have the desired effect, the economy begins to grow on its own and the Fed is then able to reduce QE and allow interest rates to return to market prices.

The housing market is then going to have some huge downward pressure. First, the main buyer of Mortgage Backed Securities (MBS) is now the Fed, which purchases 70% of all new mortgages that wind up on the secondary market (nearly all). Without the Fed buying MBS’s, rates will rise. Optimistically, this will present a buying opportunity for those that have kept cash under the mattress (granted — not sure who those people would be as QE and the other Fed interventions have been designed to get all that cash into the market) and others who are looking for higher yields, perhaps from overseas investors looking for a place to put their dollars (and not worried about recent history in the housing market).

As rates go up, those investors that own low rate MBS sell them to avoid getting burned in the carry trade (see Day 1). While this wave of selling makes rates spike, once the shock passes and banks (and pension funds) have taken their losses, the market stabilizes at a new normal of moderate interest.

Interest rates will rise, by definition, as the Fed stops artificially suppressing them. As rates rise, purchasing power declines as the same payment now buys less house. While this has traditionally exerted downward pressure on home prices, the vigor of the recovery and the pent up demand (?) for housing convinces those (few) people who qualify yet don’t own a home to overlook the fact that they didn’t buy at historically low interest rates. This, along with immigration, allows the housing market to remain healthy.

As part of this, home-builders begin to correct the imbalance between single family homes and households of single individuals. Many 1 and 2 BR unites will be constructed while the number of new 4+ bedroom units declines rapidly. This is a different approach for home builders, appraisers, lenders, brokers, realtors and insurers — not to mention inconsistent with our tax and regulatory structure — yet there are market incentives to make the shift and so it occurs in relative order.

As Baby Boomers seek to sell their suburban homes and relocate to other areas, there are enough Millennials — as well as recent immigrants — with sufficient affluence to purchase all of these homes at higher rates. Some places of the country fare better than others, but the worst performers are not sufficiently bad as to drag down the national economy.

As this is going on, the stock market continues to climb steadily. Stock prices are a reflection of earnings and earnings a reflection of sales and margins. A climbing stock market indicates that companies are still expected to make increasing earnings, improve sales and increase their profit margins while interest rates rise.

Rising interest rates will certainly dispatch some high growth companies whose business models rely on low borrowing costs to build new stores and expand their market position. Rising rates will also force the liquidation of a number of companies that are highly indebted when those companies now have to take their narrow profits and pay competitive rates of interest. These bankruptcies will only make room for other competitors to gain in the market.

As interest rates rise, consumers — particularly the prolific spenders that are carrying high debt levels — will be squeezed by higher debt payments. Home equity loans will no longer be as readily available or as lucrative. Despite this, the growing economy increases optimism about the future.  People feel they will have increased capacity in the future so they begin to take on (even) more debt for consumption purposes, despite the higher rates. This allows businesses to continue to grow and expand justifying elevated stock prices.

Despite higher interest rates, commercial construction continues as national chains, and local enterprises, expand to more and more locations. In contrast to the established approach for national retailers, their protocols for store siting, their chains of suppliers and the entire regulatory and tax structure, business models begin to shift to respond to a new geography. Fewer strip malls are being built and business expansion is now taking place within traditional neighborhoods. This transition represents something of a new market niche and profits continue to soar, justifying broadly higher stock prices.

Finally, as interest rates climb and the Federal Reserve backs out of being the primary buyer of US Treasury bills, Congress is forced to deal with the rising deficit problem. A national debt of $17 trillion financed at less than half a percent interest suddenly becomes unwieldy when rates rise to 5%. The “devastating” sequester of $83 billion looks paltry in the face of what is now an additional $800 billion annually just in interest.

So Congress is forced to act decisively. A 2–4% increase in tax rates relative to GDP along with steep declines in military spending (and military commitments) and means testing of Social Security, Medicare and whatever emerges once Obamacare is implemented. These policy changes are made without any defaults and without any downgrading of the US credit rating. Foreign governments remaining willing (and able) to pick up the gap now that the Fed has exited the market, with Europe, China and Japan now buying trillions of dollars of US debt each year.

All of this allows the US economy to sail on, the Great Recession a nasty episode that we resolved by learning the lessons of the Great Depression and acting aggressively in times of crisis.—

A couple of late evening additions….a friend of mine (a banker) emailed me this article from the NY Times. The article elegantly made some of the points I tried to make earlier in this series.


Dumb Money, Finale  July 1, 2013  Charles Marohn Also a 5% chance of happening? He thinks this is more likely, but how much more?

Above is the optimistic scenario for how the post-2008 economy resolves itself, an entry that was full of wishful thinking and, in my opinion, a lot of rosy assumptions that have very little likelihood of coming to fruition. I do not think we’ll run the table, that Quantitative Easing ends with a gradual taper, leaving the housing market to rise despite rising interest rates, the stock market to climb despite increased borrowing costs and Congress able to act decisively, in a way that does not negatively impact the economy, when the carrying costs on the national debt soars. While I’ve not conducted a statistical analysis, I would give the optimistic scenario a less than 5% chance it will come to fruition.

That is not so say that the pessimistic scenario I’m outlining today has a high likelihood either, although I do find it more likely. A 5% chance that it will all work out weighed against even a 5% chance that the worst case scenario will happen should raise some doubt on how much we are risking and to what end. Ultimately, our economy is in need of a massive retooling. We’re doing everything we can to keep that from happening. If we succeed, we get the optimistic scenario I outlined, a malaise with modest improvement over where we are today. If we fail, here is one way this could go.

The Federal Reserve is not going to be able to end its QE program. Just the mild suggestion that someday in the future there will be a tapering put the bond markets in an uproar. Nobody wants to be the last one to exit this market, and so everyone sitting on a carry spread has one eye always on the exit. Note that the Fed is not suggesting a return to market rates of interest — they still intend to keep rates artificially low — just that they are going to slow that rate at which they pound rates lower with a weekly QE sledgehammer. There is a prisoner’s dilemma at work here.

So the Fed keeps printing and printing and printing. That is, until inflation shows up on our shores.

There are two important things to understand about inflation. First, the Fed’s actions have produced inflation and are continuing to produce inflation, it is just not the kind reported in the vaunted CPI. For many economists, housing prices can artificially triple from cheap credit and it isn’t inflation so long as milk prices don’t rise. Also, we are exporting our inflation. When our cheap credit allows us to buy imported goods, that money winds up in some emerging economy, driving up their prices.

Think those protests in Brazil, Egypt and Turkey have nothing to do with US monetary policy? The spark may be domestic, but the underlying fuel that burns is rising prices.

The second important thing to understand is that inflation is like ketchup in a glass bottle. You want a little ketchup so you tip the bottle upside down. One shake – nothing. Two shakes – nothing. Three. Four. Five. You give it a sixth shake and a third of the bottle spills out all at once. In other words, it is not like there is an inflation dial you can just gradually move up and down. Inflation could easily spiral if all of those foreign holders of dollar-backed debt (not to mention domestic holders, although they are easier to coerce) logically decided they would rather own acres of cornfield in Nebraska, some oils wells, a couple factories or a few trillion in other real assets rather than a currency that is being aggressively debased.

So the Fed keeps printing until they are forced to stop by a spike in inflation. They may still be unwilling to act, even in the face of double digit inflation, but ultimately they will be forced to abandon QE and raise interest rates. A return to the double digit rates of the early 1980’s would not be without precedent (and may ultimately be an underestimate, given where we are today compared to then).

When interest rates climb, it’s over. The Fed has lost control — or the illusion of control is gone — and the correction that was put off is now in full, unabated motion.

A federal debt of $17 trillion now has annual interest in the $2 trillion range, making things like the 2012 interest payment ($220 billion), the difficult decision of the fiscal cliff ($60 billion) and the horrors of the recent sequestration ($85 billion) seem quaint in comparison. Raising taxes, slashing entitlements, gutting the military and every other formerly unthinkable action now becomes the low hanging fruit in a debate over a federal budget that is nearly 50% interest payments.

Things at the state level are perhaps even worse. Many states have simply given up — states like Illinois, New Jersey and California — and have declared bankruptcy. [JBK Pension? Those pension obligations that were dependent on rates of return 250% greater than historic growth rates are now simply discharged, the pensioners getting pennies on the dollar in a lump sum check. Things like maintaining roads — let alone building new ones — are sporadic, where they happen at all. High speed rail systems half built with borrowed money seem like a cruel joke.

Rising interest rates — and the steep reduction in government contracts — force many businesses to go bankrupt, the artificial gains during the cheap money era now gone exposing poor underlying business models and weak balance sheets. Those that remain have higher prices and a shrinking market. Unemployment consequently spikes and the Misery Index (inflation plus unemployment) is revived. In nominal terms, the stock market may be higher or lower, but who cares because in real terms (inflation taken into account) it is dropping dramatically.

Unlike the early 1980’s, however, housing prices do not inflate, their value already too high from prior attempts to prop up the housing market. These prices remain sticky, refusing to drop substantially. The stagnation in price freezes markets, preventing people from being able to sell and move for new work or better opportunity or being liquidated by price deflation. This is extra unfortunate as price inflation is making everything else associated with home ownership — local taxes, replacement shingles for the roof, fixing a broken window — vastly more expensive. This problem — can’t sell but can’t afford not to — is the most pronounced in auto-based neighborhoods, where demand for housing is lowest, jobs fewest and mobility problematic in the face of inflating gas prices, now over $6 per gallon in some places (even though Americans are using less).

In the end, the economy reaches equilibrium. A market rate of interest is restored, but not until the other imbalances of the economy are largely addressed. Median wages have increased bringing median house prices — which have stayed flat — back in line with income. This has not provided the average family with more resources, however, as it now takes twice as much to fill up the refrigerator and the car each month. Americans become savers again, not by choice but because they can’t afford credit, their houses and 401(k) plans have not kept up with inflation and interest rates on savings are once again respectable. The quality of life for most Americans is dramatically changed to the negative, devastating the poorest of the poor. Riots and large protests are now a common occurrence (although the government, thanks to the NSA, are able to head off the worst of the latter by detaining “evil doers” that are stirring things up).

Finally, following the inevitable path of all great empires, the dominance of the dollar is relinquished. After 70 years as the world’s reserve currency, the dollar now competes with a gold-backed Renminbi, a gold-backed Russian Ruble, and a new, northern-bloc Euro backed by a basket of commodities and currencies. The dollar, too, finds international stability only when it ceases to be a fiat currency and, once again, pegs its value to some sort of “barbarous relic” that is beyond the reach of a government or central bank to devalue. 

I’ll close by saying again that this is not a prediction as much as it is an exercise in imagining possibilities. I contend that we’re so fixated on maintaining the status quo that we’re not even considering the likelihood that we’ll be successful (low, in my opinion) or the risk that something calamitous could happen (by no means certain, but much higher than I am comfortable with).

For the time being, we’re simply content with being dumb money.


My comment: I don’t agree with all of the above, but many good points are made, especially about the sneak accounting tricks that make banks seem like they’re doing well, when all they’re doing is borrowing more and more at our and future generations expense.  There has to be deflation first, but after that inflation is a possibility.  Also it’s unlikely that gold will ever be our currency. 


Posted in Banking, Crash Coming Soon, Interest Rates, Ponzi Schemes | Comments Off on Why Banks and Wall St will go broke if interest rates ever go up

Gail Tverberg on Inflation, Deflation, or Discontinuity?

Gail Tverberg. July 1, 2013. Inflation, Deflation, or Discontinuity? ourfiniteworld.com

A question that seems to come up quite often is, “Are we going to have inflation or deflation?” People want to figure out how to invest. Because of this, they want to know whether to expect a rise in prices, or a fall in prices, either in general, or in commodities, in the future.

The traditional “peak oil” response to this question has been that oil prices will tend to rise over time. There will not be enough oil available, so demand will outstrip supply. As a result, prices will rise both for oil and for food which depends on oil.

I see things differently. I think the issue ahead is deflation for commodities as well as for other types of assets. At some point, deflation may “morph” into discontinuity. It is the fact that price falls too low that will ultimately cut off oil production, not the lack of oil in the ground.

Even with little oil, there will still be some goods and services produced. These goods and services will not necessarily be available to holders of assets of the kind we have today. Instead, they will tend to go to those who produced them, and to those who win them by fighting over them.

Up and Down Escalator Economies

It seems to me that economies operate on two kinds of escalators–an up escalator, and a down escalator. The up escalator is driven by a favorable feedback cycle; the down escalator is driven by an unfavorable feedback cycle.

For a long time, the US economy has been on an up escalator, fueled by growth in the use of cheap energy. This growth in cheap energy led to rising wages, as humans learned to use external energy to leverage their own meager ability to “perform work”–dig ditches, transport goods, perform computations, and do many other tasks that machines (powered by electricity or oil) could do much better, and more cheaply, than humans.

Debt helped lever this growth up even faster than it would otherwise ramp up. Continued growth in debt made sense, because growth seemed likely for as far in the future as anyone could see. We could borrow from the future, and have more now.

Unfortunately, there is also a down escalator for economies, and we seem to be headed in that direction now. Such down escalators have hit local economies before, but never a networked global economy. We are in uncharted territory.

Many economies have grown for many years, hit a period of stagflation, and ultimately collapsed. According to research of Turchin and Mefedov documented in the book Secular Cycles, such economies have typically gotten their start by learning to exploit a new resource, such as using land cleared for farming, or learning to use irrigation, or in our case more recently, learning to use fossil fuels. These economies typically start out by growing for many years, thanks to the opportunity for more population and more goods and services from the new resource.

After a while, a period of stagflation is reached. Population catches up to the new resource, and job opportunities for young people become less plentiful. Wage disparity grows, with wages of the common worker lagging behind. The cost of government rises. Because of the low wages of workers, it becomes increasingly difficult to collect enough taxes from workers to pay for rising government costs. To work around these problems, use of debt grows. This scenario tends to end very badly.

Our situation today sounds a great deal like the down escalator situation. As I have discussed previously, wages stagnate as oil prices rise. In fact, most increases in wages have taken place when the real price of oil was less than $30 barrel, in today’s dollars.

Figure 1. High oil prices are associated with depressed wages. Oil price through 2011 from BP’s 2012 Statistical Review of World Energy, updated to 2012 using EIA data and CPI-Urban from BLS. Average wages calculated by dividing Private Industry wages from US BEA Table 2.1 by US population, and bringing to 2012 cost level using CPI-Urban.

As oil prices rise, wage-earners hit a second problem–higher costs for fuel and food, since fuel is used in growing and transporting food. Wage-earners are hit on two sides–flat income and higher payments for necessities, leading to less discretionary income.  Governments find that they need more taxes to pay for increased benefits for the many who no longer have jobs. Higher taxes place another burden on those who are still working. Businesses find their profits pinched by higher oil prices, and respond by outsourcing to a low wage country, or automating processes to cut costs, lowering the amount local citizens earn in wages further, and globalization tends to pull US wages down as well.  All of these issues tend to add to the down-escalator phenomenon for the US economy.

In past years, governments and businesses have made promises of many types, such as bank account balances, pensions, Social Security, Medicare, insurance policies, stock certificates, and bonds. The question becomes: what happens to these promises, as we step off the up escalator, and onto the down escalator? All of these promises could be paid when we were on the up escalator. The amount that gets paid is much less clear, if we are on the down escalator.  In this post, I would like to examine what happens.

The General Price Trend: Downward, with Discontinuities

Each year, an economy produces various kinds of goods and services. It grows crops, and extracts minerals. It uses energy products to process the crops and minerals into finished goods, and to transport them to their final destination. The amount produced depends on the amount of goods and services potential buyers can afford. If wages are stagnant, and the government’s share keeps rising, the amount wage-earners can afford (in inflation adjusted dollars) keeps falling.

Since the early 2000s, the cost of extracting oil products has been rising, because the oil that was cheapest to extract was extracted first, and the “easy oil” is now gone. There tends to be a relatively small amount of a resource available cheaply, and increasing amounts available at higher and higher prices (Figure 2, below).

Figure 2. Resource triangle, with dotted line indicating uncertain financial cut-off.

In fact, minerals of all types tend to follow the same pattern as oil for two reasons: (1) Mineral extraction follows the same pattern–cheapest to extract first, moving to the more expensive to extract, and (2) Oil is generally used in extraction. If the cost of oil is rising, its cost tends to get passed on. Of course, in some instances, technological improvements can offset rising prices, but for most of the time since the year 2000, cost of commodity extraction has tended to rise.

There has been a lot of publicity recently about more oil being available, and more natural gas being available. This additional availability is because of high price. It doesn’t bring the cost of extraction down. In fact, if price drops, extraction is likely to drop. This drop will not occur immediately, because much of the cost has already been paid on wells that have already been drilled, so extraction from these wells tends to continue. But future investment is likely to drop off quickly if prices drop, bringing supply down, with a lag.

Because of the downward escalator the economy is on, wage-earners don’t really have enough money to pay the higher prices that are needed for increasingly costly extraction of oil and other minerals. Instead, prices tend to be volatile. The general trend can be expected to be downward, because even if  oil prices rise when the economy is functioning fairly well, at some point, the higher price leads to adverse feedbacks, such as consumers defaulting on debt and cutting back on discretionary purchases. The result can be expected to be recession, and again lower oil prices.

The big danger is that lower oil prices will lead to lower oil production, and this lower oil production will become a problem for business and commerce around the world. The United States is likely to be one of the countries whose oil production will be affected most by lower oil prices, for three reasons:

  1. We have most tight oil production, and tight oil production is very expensive to produce, and production drops off quite quickly if drilling stops.
  2. Shale gas drillers use a lot of debt. Shale drillers will especially be hit if interest rates rise because of debt problems.
  3. Taxes and fees related to oil production in the US (unlike many countries) do not vary with the price of oil. The US government will continue to get most of its revenue (estimated to average $33.29 per barrel on a $80 barrel of US tight oil by Barry Rogers, Oil & Gas Journal, May 2013), even as companies find themselves short of funds for new drilling.

If oil production is down, US oil consumptionwill be lower as well. The reason for low oil price is likely to be recession and greater job loss. With fewer jobs, less oil is needed for making and shipping goods. Furthermore, the many unemployed cannot afford cars. The pattern of  declining demand in the European Union, and Japan is likely to continue, and get worse. (See my post, Peak Oil Demand is Already a Huge Problem.)

Figure 3. Oil consumption based on BP's 2013 Statistical Review of World Energy.

In 2008-2009, the economy was able to somewhat recover, so commodity prices increased again. This recovery was not based on US economy fundamentals–a large part of it seems to be related to artificially low interest rates and deficit spending. As interest rates rise, and as deficit spending is eliminated through higher taxes/lower benefits, the US economy seems likely to head back into recession, with more job loss, probably worse than last time.

Countries with low wages to begin with may be spared of some of the down-escalator economy dynamics for a few years, because their low wage levels will continue to make them competitive in a world economy. These countries will attract a disproportionate share of new jobs, allowing them to continue grow for a time, even as the US, the European Union, and Japan continue to lose jobs.  Thus, world oil prices may be able to bounce back, but probably not to as high a level as in the recent past. Eventually, these countries will tend to follow the rest of the world into stagflation and collapse, because of the interconnectedness of the global economy, and the similar dynamics that all countries are subject to.

Chance of Discontinuity

In order for the models to work in the expected way, business as usual must continue. A few obvious problems come into play:

(1) “Demand,” as defined by economists, is what consumers can afford to pay. Therefore, a jobless individual without any type of government compensation, would have no demand for food, clothing or shelter–at least using the term in the way economists use the word. All of us know that in the real world, lack of a job and lack of government benefits causes problems. At some point, marginalized people will riot and  overthrow governments. Civil war may take place, or war against another country.

(2) Part of Business as usual is continuing availability of debt. At some point, it will start to become clear that the economy has gotten off the up escalator, and moved to the down escalator. On the down escalator, much less debt makes sense. It probably still makes sense to use debt on a short-term basis to cover goods in transit, and it may make sense to use debt to finance investments with a high expected rate of return. Debt is likely to become much less common, greatly worsening the down escalator problem.

(3) As long as the economy was on an up escalator, increasing economies of scale were part of what caused a positive feedbacks. When the economy is on a down elevator, we have the reverse effect–higher fixed costs relative to production. This is even an issue when reduction in sales are intentional–for example, increased water conservation tends to lead to higher fixed costs, per unit of water sold, and greater use of high-efficiency light bulbs leads to greater electricity fixed costs (such as grid costs) per kWh sold. These higher fixed costs tend to push up prices for services further, increasing the down escalator effect.

(4) Investment in a capitalistic system does not work on a down economic escalator. Who wants to invest, if it is probable that the economy will shrink, leading to increasing diseconomies of scale?

What Happens to Government and Business Promises?

There are many kinds of promises currently outstanding:

1. Government promises

  • Social Security
  • Medicare
  • Unemployment insurance
  • Continued maintenance of roads
  • Free education for all through high school
  • Government debt (Federal, state, and local)
  • Financial help after hurricane damage
  • Guarantees of bank accounts and pension plans

2. Insurance and bank promises

  • Life insurance policies
  • Annuities
  • Long term care policies
  • Pension plans
  • Auto and homeowners policies, etc.
  • Bank account balances

3. Promises by companies of all types

  • Stock – implied promise it will be worth more in the future
  • Loans borrowed will be paid back (to banks or on bonds)
  • Pension plans
  • Implied guarantee of future 24/7 electricity availability; grid maintenance

What happens to these promises? Over time, it is clear that pretty much all of them will disappear. They are up-escalator benefits that work when there are plenty of fossil fuels and the economy is expanding. They don’t work for very long on a down escalator.

Promises to Individuals

At the level of the individual, one of the implied promises has been is that an individual who gets a good education will be able to get a good paying job. This is one of the promises that is already disappearing.

There is also a second implied promise–people who actually perform the work, will be compensated for it. This promise is falling by the wayside, as wages fall (partly due to globalization, and partly due to other down escalator effects). At the same time, governments need higher tax rates, to pay for all the promises made to those who are retired, unemployed, or have wages that are too low to support a family.

Goods and Services Produced in a Given Year

In any year, there will be a mixture of people buying goods and services:

  • People who are currently in the work force
  • Retirees
  • People who own assets and want to sell them

One thing that may not be obvious without thinking about it, is that all of the people wanting goods and services have to compete for the same set of goods and services that are available at that time.

For example, we grow a certain amount of corn and rice, and we extract a certain amount of oil and coal and copper, and we make a certain amount of electricity in electric power plants. Because of inventories, there is a little flexibility in these amounts, but basically, the amount that is available is determined by market prices and availability of supply lines. If the amount of goods and services produced is decreasing, because we are on a down escalator economy, this smaller quantity of goods and services needs to be shared by the entire population.

If there is relatively little available in total, and those who produced it don’t want to part with it, a person trying to trade accumulated “assets” for current production will not receive very much scarce production in return for his accumulated wealth, no matter what form it may take. In the case of most assets (stocks, bond, gold, silver, etc,) this means that the value of the asset tends toward $0. If currency is viewed as another asset, its value may go to close to zero as well. In fact, if there has been a government change, its value of the currency may be exactly zero.

How about Quantitative Easing?

Quantitative Easing (QE) represents an attempt to re-inflate the economy by making more credit available to the economy, at lower interest rates. It also has the effect of reducing the interest rate the government pays on its own long-term debt, thus holding down that taxes the government needs to collect.

In terms of inflation/deflation effects QE has, its primary effect seems to be to artificially inflate asset prices–stocks, bonds, home prices, and agricultural land prices. The announced goal of the Japanese QE attempt was to try to raise the inflation rate (generally) in Japan to 2%, but it has not had that effect. In fact, the same link shows that in general, QE has not led to inflation.

The primary effect of QE is to create asset price bubbles. The price of bonds is raised, because of the artificially low interest rates.  The price of stocks is raised, because people switch from bonds to stocks, to try to get yield (or capital gains). To get better yield, businesses find it worthwhile investing in homes, with the idea of renting then out on a long-term basis. Very little of QE actually gets through to wages, which is where the major shortfall is.

QE will at some point stop, and the asset price bubble will deflate.

(Crunch Time: Fiscal Crises and the Role of Monetary Policy points out that QE is not viable as a long-term strategy.) This is likely to add to deflation woes. The higher interest rates and the need for higher taxes to cover the higher interest the government needs to pay will add to the down escalator effects, making the trends noted previously even worse.

76 Responses to Inflation, Deflation, or Discontinuity?

Gail: I think rising interest rates and a need to raise taxes are the big problems will we be running into in the near future. The government may also realize it can’t keep raising the debt level either, because of the high cost of servicing the debt. (Not to mention the problems in Europe, China, and Japan.)

If China and Asia slow down the world economy escalator significantly flattens. We are increasingly approaching the situation where the whole world is on a down escalator. Their flattening moves us significantly along in this direction.

The lack of good solutions, and the possibility that good individual solutions will make the situation for the group as a whole worse, makes a person wonder whether even discussing this subject is even worthwhile. This is one (of several) reasons why The Oil Drum has not wanted to touch the issue.

One thing that comes out of this analysis is that each of us should make the best use of the time we have now, before collapse, that we can. Appreciate each day. Don’t worry about spending money if you have savings. A penny saved in a bank is a penny ultimately lost (unfortunately). This solution actually works in the direction of delaying collapse, as well.

There is at least some chance that knowing what we have gotten ourselves into will give us some insights as to what might mitigate the problem. For example, as collapse gets underway, (to a greater extent than it already is), we will need to learn ways of coping. An increasing proportion of people will not have jobs, even those with good educations. What does one do to cope with this situation? Most people will not be well enough off to own land. This is ultimately the problem we need to mitigate–how do we keep this problem from overwhelming the system? Perhaps insightful people can help fashion a new system, at least for some small areas. But this would probably require land redistribution, and a plan of lower population. This will be resisted by those who currently own land, and by families who want several children.

I think the major issue with farmland is whether it will be taken over, perhaps by a new government, and run in a way that is viewed to be better–give everyone a small piece, or use very large plots, overseen by someone who is supposedly knowledgeable and has access to tools, and can optimize water use and rotation of livestock over various parts of the land.

Another issue is that land prices have been run up the way everything else has been run up–by artificially low interest rates, and by the view that commodities are the only things that can go up. You would think that land that is good for crops and is in a good location would hold up better in value than other things, though.

Without fossil fuels, it will take quite a bit more land to feed a person than it does today. (At least, that is the way it worked in the past, without metal fences and pesticides and herbicides). From that point of view, the productivity of land will be a lot lower. Logically, its price should relate to it productivity.

Someone asked if the US$ would remain viable currency, Gail replies:

The short answer is “No”. If things really go to pieces, it is hard for a government to continue in power. There are various ways this could happen–a new group could come in and promise great things, with a new constitution. Or the Unites States could break up, more in the way the Former Soviet Union broke up. Or the richer states could decide to secede. If there is a new government, there could very well be a totally different currency.

Posted in Gail Tverberg, Inflation or Deflation | Comments Off on Gail Tverberg on Inflation, Deflation, or Discontinuity?

29 Things to Keep in Mind about buying Real Estate

This is an edited down version of 30 Reasons To Get Out Of Real Estate And Into REAL Assets by “Don’t Tread on Me” at businessinsider.com.

The shift from paper assets to real assets is driven by money/debt creation. Since our dollar IS debt, it is necessary for more debt to be created every year in excess of the debt AND interest accrued the year before. The majority of this debt was created during boom times when no one feared debt. When the inevitable slow down came, the Elite created more money/debt to keep the system going.

This cycle has been successfully managed by the Elite in the past with the creation of Bretton Woods, the closing of the gold window, the Petro Dollar, Paul Volker slaying the inflation dragon in the 80s with 22% interest rates, the banker bailout and QE 1 & 2.

This time around, there is no way out except for a default. How that default plays out is still up in the air. I believe that we will get another deflationary shock to scare Congress and us into more money creation.

One of the most common misconceptions of real tangible assets is that Real Estate is a real tangible asset. After all, it is called REAL Estate. But it’s more of a paper asset since the bank owns your part of your home until you pay it off.   We are on the verge of another leg down in Real Estate and the name of the game is wealth preservation. Beyond wealth preservation, I believe that those that hold their wealth in real assets will see a massive increase in their real purchasing power.

1. Real Estate is not a tangible asset. Yes, the property is real and tangible, but its value is dramatically affected by the paper/debt market. Almost all Real Estate is bought with mortgages/debt paper and leverage. Even if a property is paid in full with cash, its value was affected by competing bidders using leveraged debt. Ask yourself how “real” it is if interest rates were at 10% instead of 4%. What is the cash value of your property if there is no credit market at all? That’s what happens in a big deflationary crash. Prices keep going down, so people don’t buy anything, so prices go down further. What is the value of your property if/when the dollar collapses? The answer should show that the value of Real Estate is much more determined by paper/debt market than its real tangible value.

2. Most of your Real Estate is not an asset at all because it produces no income. If your property isn’t a positive cash flow asset, it’s a liability. Factor in taxes, interest, maintenance and upgrades, and it can even be a negative asset. Yes it has value, but it’s not an asset.

3. Even in a hyper inflationary environment owning property is not a “no brainer.” In a hyperinflation the value of the mortgage debt would essentially become worthless. That is great for owning your property outright. The reality is that there are going to be other factors that will dramatically affect the real value of the property. In a hyper-inflation the food in your freezer drawer will be worth more than you mortgage. The cost on running your home will become exorbitant. What if you cannot afford the higher water, electricity and gas bills? What is property worth if these utilities are not even working or available?

4. Real Estate is an illiquid asset/liability. What if you are in the “wrong” area when this goes down? Having a better part of your wealth tied to an asset that cannot move is highly disadvantageous during a period of social upheaval. We’ve all seen pictures of refugees leaving their homes with the few possessions they own. What if you are in an area going to go through massive social upheaval or has low carrying capacity?

5. If you have the majority of your fortune tied to an area that is essentially a war zone, you are putting your life and fortune at risk unnecessarily. This is magnified by the fact that if the dollar collapses there will be NO market what so ever for selling.

6. You never truly own Real Estate. Even if you own your home outright you still have to pay taxes on it. If you do not pay the taxes you will see who has the real ownership of your property.

7. Taxes will be raised as local governments get more desperate. During the boom, few people saw or cared about their property taxes. They figured as long as the asset went up the taxes were sure to follow. Many figured if the property value fell, the taxes would naturally go down. Wrong. Local governments either kept taxes the same when property values fell or worse raised the rate or taxable property valuation to steal more money from you. The sad thing is we have not seen anything yet. When the dollar collapses governments will become more desperate and take extraordinary actions to maintain their power. For a local government the best place to steal money is the property owner. (For a Federal government the best place to steal is your retirement funds.) The local government can raise rates and there is nothing you can do about it. If you don’t pay they will simply take your property and sell it at a tax sale. Or what if they create a massive sales tax on the sale of Real Estate?

8. What they can’t tax, they will take. Governments have many other tools in their pocket to steal your property, like zoning. What if they mandate that your home must be energy neutral before you can sell it? What if they use eminent domain to give your property to corporate pirates? What if there is a new zoning law that says you cannot build with in 500 feet of any water source or endangered species?

9. Income producing property is at risk also. The value of income producing property is directly tied to the economy. If the economy cannot support businesses, the value of all of the underlying property is worth less. Overnight the property turns from an income producing asset into a cash sucking liability. I have seen franchises go broke and once prime property losses 50% of its value overnight. With so many empty properties on the market it acts a drain to your ability to hold rents up.

10. When the economy deteriorates, domestic violence and drunken disorderly conduct rises. People steal air conditioners and strip homes clean. If people don’t have jobs, they cannot pay for their rent. Towns may enact laws to prevent you from getting rid of non-paying renters. People stop caring about the upkeep of a property. Even if you do get rent, the real value of that rent is falling as things get tougher. If things get really bad, people will be paying more for food and heat and may not have the money to pay the rent. Finally, they may also look at you as the cause of all of their problems. You probably look like a Rothschild or Rockefeller to most of these renters, and they may take out their frustrations on the guy taking money from them.

11. Renters have no buffer. Half of all Americans cannot come up with $2,000 in one month for an emergency. Rent is often the easiest expense to skip out on.

12. The Existing Homes inventory is going back up. Wait until after the next financial crisis. Many people simply cannot afford to sell because they owe too much on their house. (May 2014, New York Times, “What Housing Recovery?” One-fifth of homes are still underwater, 9.8 million homes, are at risk of joining the 5 million households that have had foreclosures).

13. Flippers make up a huge portion of those sales. The sales numbers are skewed because there are a lot of homes that are bought and then sold. So the real buyers that are actually moving into new homes is much lower than we are lead to believe.

14. The Shadow Inventory. On top of the homes on the market there are MILLIONS of homes not on the market. These are homes that have been foreclosed upon by the banks and they are not even attempting to sell these homes. They know that if they dump these homes on the market it will crush all of their performing mortgages as homes prices sink further and more people just stop paying.

15. Millions more beyond the Shadow Inventory. Even if we somehow get past the gut of existing and shadow inventory there are millions more beyond even that. There are homeowners that have simply stopped paying their mortgages and they have not been foreclosed upon, even though they should. They pay their property taxes and utilities. These homes tend to be on the lower end in undesirable areas. These people also draw strength away from the renter market. If they are not evicted they don’t need to rent your property. There are also the Strategic Defaulters that purposely don’t pay their mortgages even though they can.

16. We still have another year of mortgage resets. We are not done yet…Beyond the existing…Beyond the Shadow…Beyond the as of yet to be foreclosed, we have millions more that will fall into default as their mortgages reset or they lose their job in a ever worsening economy. You might remember that this housing mess all got going because people got in over their heads not only with the Real Estate but also the mortgages. People with no jobs or income now had exploding mortgages that reset at double the payments. The adjustable ARMs and Alt As are coming due and the properties are worth a lot less and peoples financial and job situation are much worse. This coupled with stricter lending is a potent combination.

17. The MERS monster. Mortgage Electronic Registration Systems is a scheme cooked up by the banksters to slice and dice huge pools of mortgages into tranches, so that they can then resell the pools of mortgages all over the world. This is a huge problem since there is now no clear owner of the title of the properties, banks cannot foreclose on properties in default. Would you feel comfortable buying a property from a bank knowing that millions of mortgages are involved in this mess. You may wake up only to find that the property you thought was a steal is actually someone else’s property. Much of the paper work that was done, was done very wrong.

18. Tougher lending standards mean fewer buyers. Credit requirements are tougher as banks seek to sober up their balance sheets. They require more money down and are much more stringent in their lending. Nearly 27% of all mortgage applications are rejected now.

19. The boomers have lost a great deal to the paper stock and the paper housing bubble, and it seems like it is too late for a second chance. Without this generational demand it is going to take years to fill the massive glut of homes we have built. We are going to see American Ghost towns again.

20. My comment: when people retire, they often downsize to smaller homes and use the profit to help fund their retirement. This is partly what popped the Japanese asset price bubble 22 years ago and Japan has had deflation since then.  But they were in much better shape than we are, because everyone had a lot of savings.  And the younger generations can’t even pay off their student loans, let alone pay high prices for boomer homes. Don’t be fooled by the rising stock market — it just means the next crash will be even worse since there have been no meaningful reforms, and the level of debt and corruption is unprecedented in history – and can’t be “fixed” anyhow, except with enough market crashes to the point where we start over.

21. The Generation below is broke. If the Boomers are scared and downsizing there must be a generation below that will pick up the slack as they grow, right? My generation is destroyed. There is now an unprecedented $1.2 Trillion dollars in student loan debt chained to my generation. And thanks to Bush, that debt can NEVER be gotten rid of through bankruptcy. So here you have a generation with $20,000 to $250,000 dollars of debt before they even earn one penny in the real world. Never mind the credit card, auto and home debt. This debt is keeping my generation from starting families and having any disposable income. They are just getting by now, wait until the next shock comes. If this debt is holding back families from having kids, this acts as a further throttle to the growth in long term housing trends.

22. Multi-generational housing is coming back. Not only does this make sense financially, it makes sense emotionally. We are going to be going through very tough times and we need to have a strong family to rely upon. This trend will leave a lot of unnecessary homes on the market, as sons, daughters, and grand parents live together once again.

23. Obsolete housing. Many huge homes will simply become abandoned. [My comment: especially as energy prices rise, McMansions will be too big to heat affordably].

24. Obsolete towns. The value of properties in areas has a lot to do with the companies that provides jobs. I am in Cleveland and I can tell you first hand that the amount of jobs that has left the area has been huge. If cities and towns cannot keep their businesses they are doomed. All along the rust belt you can see this very clearly. Now the towns that went up with the housing boom are the ones that are the biggest bust.

25. Possible Illegal Immigrant exodus. History has shown that foreigners tend to take the brunt of the frustration of the populace during extreme economic collapses. When the economy heads south again, the illegals may head south of the border as opportunities get slim and social pressure mounts.

26. Political, financial and eventually military power is shifting to Asia. This shift of power will affect property values as real money would rather be in Hong Kong or Shanghai rather than New York or London.

27. The most important factor in the housing market is JOBS. We are on a death spiral for jobs. Our manufacturing was gutted and sold overseas by the Elite to make a bonus. Do you remember Ross Perot and his “Giant Sucking Sound?” He said that until the price of labor here is on par with the slave labor in other countries, jobs will never come back. The other factor is 70% of the economy is part of the consumer economy.

28. I recommend people buy in a safe area near water and food. Owning a home is much more desirable to renting during a financial crisis. Most rentals are near other desperate people. Having a “castle” to defend is vital to surviving a collapse. You need to have a place to safely stages your preps. Being evicted during a collapse is a very dangerous experience. Just remember the 3 most important rules of Real Estate, location, location, location.

29. My comment: because of the net energy cliff (2015-2020 according to experts), the economy will never grow again, but shrink until we are back to pre-fossil fuel carrying capacity, about 1 billion people world-wide, 100-150 million people in the United States. Therefore, if you buy a house now for $200,000 with mostly borrowed money, and the value drops to whatever people can afford to pay in cash (say $25,000) when deflation strikes again after the next crash (due to credit vanishing, again), then the Banksters are going to take your house back. Even if you’re renting it out, you can’t count on the renters to still have jobs to pay rent so you can pay the mortgage.   Better to buy real goods now (tools, grain mills, emergency food supplies, etc.) and wait to buy a home free and clear with cash after the next crash. But if you’ve got $500,000 then buy the house now so you don’t end up without a chair when the music stops.  If you can’t buy a home now free and clear, don’t wait too long after the crash, because although home prices may keep dropping, your cash will be worthless if the dollar fails in a sovereign default, or currency is re-issued, or people realize how dire the situation is and don’t sell to make sure they have a roof over their heads, or you’re in a safe area and are outbid by the wealthy 10% fleeing large cities once peak oil awareness is commonplace knowledge, which will crash stock markets world-wide according the German Military peak oil study.

Bottom Line: Have cash under your mattress since you won’t be able to get it out of the banks for a while (I could be wrong about that though, there’s a good chance of nationalization this time around).  Regardless, be ready to buy real estate after the next downturn, which may not be the bottom of the market, but who cares, once the net energy cliff begins, and the money/energy transition begins in earnest, money will mean nothing, and living in an area under carrying capacity with real goods (many of which won’t be available anymore as businesses fail) will mean everything.  And you’d better have the skills to continue to pay property taxes so that you don’t lose your home. Also, a modest home so that it’s not a target of gangs, mafias, or local government officials when social disorder occurs.

Posted in Investing advice, Real Estate | Comments Off on 29 Things to Keep in Mind about buying Real Estate

Disarray by James Howard Kunstler

Feb 21, 2008  DISARRAY  by James Howard Kunstler

The dark tunnel that the U.S. economy has entered began to look more and more like a black hole recently, sucking in lives, fortunes, and prospects behind a Potemkin facade of orderly retreat put up by anyone in authority with a story to tell or an interest to protect – Fed chairman Bernanke, CNBC, The New York Times , the Bank of America… Events are now moving ahead of anything that personalities can do to control them.

The “housing bubble” implosion is broadly misunderstood. It’s not just the collapse of a market for a particular kind of commodity, it’s the end of the suburban pattern itself, the way of life it represents, and the entire economy connected with it. It’s the crack up of the system that America has invested most of its wealth in since 1950. It’s perhaps most tragic that the mis-investments only accelerated as the system reached its end, but it seems to be nature’s way that waves crest just before they break.

This wave is breaking into a sea-wall of disbelief. Nobody gets it. The psychological investment in what we think of as American reality is too great. The mainstream media doesn’t get it, and they can’t report it coherently. None of the candidates for president has begun to articulate an understanding of what we face: the suburban living arrangement is an experiment that has entered failure mode.

I maintain that all the “players” – from the bankers to the politicians to the editors to the ordinary citizens – will continue to not get it as the disarray accelerates and families and communities are blown apart by economic loss. Instead of beginning the tough process of making new arrangements for everyday life, we’ll take up a campaign to sustain the unsustainable old way of life at all costs.

A reader sent me a passel of recent clippings last week from the Atlanta Journal-Constitution . It contained one story after another about the perceived need to build more highways in order to maintain “economic growth” (and incidentally about the “foolishness” of public transit). I understood that to mean the need to keep the suburban development system going, since that has been the real main source of the Sunbelt’s prosperity the past 60-odd years. They cannot imagine an economy that is based on anything besides new subdivisions, freeway extensions, new car sales, and NASCAR spectacles. The Sunbelt, therefore, will be ground-zero for all the disappointment emanating from this cultural disaster, and probably also ground-zero for the political mischief that will ensue from lost fortunes and crushed hopes.

From time-to-time, I feel it’s necessary to remind readers what we can actually do in the face of this long emergency. Voters and candidates in the primary season have been hollering about “change” but I’m afraid the dirty secret of this campaign is that the American public doesn’t want to change its behavior at all. What it really wants is someone to promise them they can keep on doing what they’re used to doing: buying more stuff they can’t afford, eating more bad food that will kill them, and driving more miles than circumstances will allow.

Here’s what we better start doing.

Stop all highway-building altogether. Instead, direct public money into repairing railroad rights-of-way. Put together public-private partnerships for running passenger rail between American cities and towns in between. If Amtrak is unacceptable, get rid of it and set up a new management system. At the same time, begin planning comprehensive regional light-rail and streetcar operations.

End subsidies to agribusiness and instead direct dollar support to small-scale farmers, using the existing regional networks of organic farming associations to target the aid. (This includes ending subsidies for the ethanol program.)

Begin planning and construction of waterfront and harbor facilities for commerce: piers, warehouses, ship-and-boatyards, and accommodations for sailors. This is especially important along the Ohio-Mississippi system and the Great Lakes.

In cities and towns, change regulations that mandate the accommodation of cars. Direct all new development to the finest grain, scaled to walkability. This essentially means making the individual building lot the basic increment of redevelopment, not multi-acre “projects.” Get rid of any parking requirements for property development. Institute “locational taxation” based on proximity to the center of town and not on the size, character, or putative value of the building itself. Put in effect a ban on buildings in excess of seven stories. Begin planning for district or neighborhood heating installations and solar, wind, and hydro-electric generation wherever possible on a small-scale network basis.

We’d better begin a public debate about whether it is feasible or desirable to construct any new nuclear power plants. If there are good reasons to go forward with nuclear, and a consensus about the risks and benefits, we need to establish it quickly. There may be no other way to keep the lights on in America after 2020.

We need to prepare for the end of the global economic relations that have characterized the final blow-off of the cheap energy era. The world is about to become wider again as nations get desperate over energy resources. This desperation is certain to generate conflict. We’ll have to make things in this country again, or we won’t have the most rudimentary household products.

We’d better prepare psychologically to downscale all institutions, including government, schools and colleges, corporations, and hospitals. All the centralizing tendencies and gigantification of the past half-century will have to be reversed. Government will be starved for revenue and impotent at the higher scale. The centralized high schools all over the nation will prove to be our most frustrating mis-investment. We will probably have to replace them with some form of home-schooling that is allowed to aggregate into neighborhood units. A lot of colleges, public and private, will fail as higher ed ceases to be a “consumer” activity. Corporations scaled to operate globally are not going to make it. This includes probably all national chain “big box” operations. It will have to be replaced by small local and regional business. We’ll have to reopen many of the small town hospitals that were shuttered in recent years, and open many new local clinic-style health-care operations as part of the greater reform of American medicine.

Take a time-out from legal immigration and get serious about enforcing the laws about illegal immigration. Stop lying to ourselves and stop using semantic ruses like calling illegal immigrants “undocumented.

Prepare psychologically for the destruction of a lot of fictitious “wealth” – and allow instruments and institutions based on fictitious wealth to fail, instead of attempting to keep them propped up on credit life-support. Like any other thing in our national life, finance has to return to a scale that is consistent with our circumstances – i.e., what reality will allow. That process is underway, anyway, whether the public is prepared for it or not. We will soon hear the sound of banks crashing all over the place. Get out of their way, if you can.

*** Prepare psychologically for a sociopolitical climate of anger, grievance, and resentment. A lot of individual citizens will find themselves short of resources in the years ahead. They will be very ticked off and seek to scapegoat and punish others. The United States is one of the few nations on earth that did not undergo a sociopolitical convulsion in the past hundred years. But despite what we tell ourselves about our specialness, we’re not immune to the forces that have driven other societies to extremes. The rise of the Nazis, the Soviet terror, the “cultural revolution,” the holocausts and genocides – these are all things that can happen to any people driven to desperation. ****

==========================

May 5, 2008 The Risk Economy

As the West’s industrial regime sputters toward a cheap-energy-crackup conclusion, there have been attempts to recast what our economy is actually about, how to account for whatever wealth we manage to produce, and project what our society will actually be organized to do in the years ahead.

For a while in the 1990s, the idea was a “service economy,” kind of like the old fable of the town whose inhabitants made a living by taking in each other’s laundry — only in our case it was selling hamburgers to tourists on vacation from their jobs making hamburgers elsewhere, or something like that.

Then came the idea of the “information economy” in which making things of value would no longer matter, only the processing and deployment of information (sometimes misidentified as “knowledge”). This model seemed to suggest a yin-yang of software engineers who made up games like “Grand Theft Auto” serving the opposite cohort of people who bought and played the game. If nothing else, it certainly explained how lifetimes could be frittered away on stupid activities.

That illusion yielded to the housing bubble economy, which actually did produce a lot of things, but not necessarily of value — for instance, houses made of particle board and vinyl 38 miles outside of Sacramento. It was a tragic and manifold waste of resources, as well as an insult to the landscape. But the darker side of the housing bubble lay in the world of finance, where a vast empire of swindles was constructed to support the Potemkin facade of production homebuilding.

Now we are in a strange period when those swindles are unwinding. The people who run the finance sector — the Wall Street investment banks, hedge funds and ratings agencies, the Federal Reserve, and the US Dept of the Treasury — in desperately trying to prevent the unwind, have rapidly ramped up another new economy based entirely on the buying and selling of risk. Risk, as a pure abstraction unconnected to any real capital activity, is all that’s left to buy and sell after all other plausibly practical vehicles for finance have failed.

While a lack of transparency in the individual risk vehicles has been an object of complaint over the past year, the system as whole is transparently absurd. The system is also abstruse enough to prevent most mortals (including many employed in the system) from understanding its operations. But the general public and the news media are virtually helpless to intervene in this last gasp racket, so the probability increases that it will do tremendous damage to whatever remains of the US economy. One feature of the risk economy is the Federal Reserve’s new willingness to absorb any sort of crap collateral in exchange for massive cheap loans to insolvent companies and institutions. The Fed has, in effect, made itself the world’s largest financial shit-magnet. It has already taken in a few hundred billion in securities based on non-performing real estate loans, and has now opened the window to securities based on non-performing credit card debt, car loans, and other miscellaneous IOUs still drifting un-hedged in the banking ether.

It’s a mark of our collective desperation to avoid the consequences of so much reckless behavior that no credible authorities have stepped up to denounce this racket — no Fed governor, no politician of standing (including the candidates for president), no newspaper-of-record. The Attorney-general of New York, Andrew Cuomo, may be quietly cooking up some cases in the deep background, but the SEC and the federal banking regulators hung up their “out-to-lunch” signs on this long ago.

Meanwhile, the basic situation is this: the world is awash with bad investment paper. The standard of living in the US can’t be supported on debt anymore. The people of the US don’t produce enough real value to service their debts. Institutions can no longer be supported on debt gone bad. Something’s got to give — meaning something has to bring the US standard of living down to a level consistent with our declining actual wealth.

Everything else going on right now is a dodge. The Fed maneuvers, the “coordinated actions” of the western central banks, the postponements of default, the non-disclosure of contents in bank portfolios, the pretense that risk alone is a kind of fungible resource that can be endlessly traded to generate fees — all this fucking nonsense will only make the eventual unwinding much worse.

Personally, I doubt that it can go on more than a few more months. The velocity of everything is going up past the “red line” where things really fly apart. The increased velocity of non-performing mortgages and deadbeat credit card accounts is one thing that can’t be hidden or escaped. America will feel and see very vividly when the repossession teams rush families from their homes, when the pickup truck is taken away, and when the pink slip appears in the pay envelope. Meanwhile all the higher-end banking shenanigans will only debase the dollar and make it more difficult for people already in distress to buy gasoline and food.

If the bankers and treasury officials collude to prop up one more failing big bank a la Bear Stearns, the political fallout for Wall Street could be lethal. In any case, I think we will have a way different sense of ourselves as a society by the time the election comes.

Posted in Expert Advice | Comments Off on Disarray by James Howard Kunstler

Vulnerabilities pose risks in top U.S. oil suppliers Elizabeth Bunn

Many of the countries the U.S. depends on for oil and petroleum products have corrupt governments at varying levels, crime problems and face civil unrest. Whether initiated by al-Quida in Iraq, militant groups in Nigeria or armed rebels along the Columbia-Venezuela and also the Columbia-Ecuador border, attacks on the oil and gas industry can cripple and cause major economic damage.  The United States spends a tremendous amount of time and money to secure our oil and counter the threats that disseminate throughout the global supply chain.

The U.S. receives nearly 60 percent of its oil and petroleum imports via tanker, according to a 2011 report from the American Petroleum Institute. Many of the tankers arriving in U.S. ports carry crude oil and petroleum from Mexico, Saudi Arabia, Venezuela and Nigeria. Threats to production in these crucial supplier countries – whether from natural disaster, crime, or terrorist or cyber attacks – threaten both the global supply chain and the Unites States’ access to oil.

Top exporters to the U.S. A look at some of the major threats to the U.S. oil supply today:

oil risk by country and disaster

Canada is by far the largest supplier of foreign oil to the United States, accounting for approximately 25% of U.S. crude oil imports in 2011. The majority of Canada’s estimated 180 billion barrels of oil reserves come to the U.S. via pipeline from the oil or tar sands in Alberta’s Athabasca region. “If you have a 2,000-mile pipeline from Canada to Texas, you simply cannot protect the entire pipeline“. – Paul Rosenzweig, former deputy assistant secretary for policy, Department of Homeland Security

Mexico. The United States imported roughly 1.1 million barrels of crude oil per day from Mexico in 2011, making it the third largest net exporter of oil to the United States. Almost all of Mexico’s exports arrive in the U.S. by oil tanker. “The national pipeline network [is practically taken over] by organized crime gangs, associated with heavily armed groups.” – Petroleos Mexicanos, or PEMEX, the Mexican state-owned petroleum company, August 2012

Saudi Arabia. Oil powerhouse Saudi Arabia is still the hub of the global oil market, although its importance as a supplier to the U.S. has declined in recent years. In terms of infrastructure, Saudi Arabia is a unique case because of the concentration of a lot of oil – five or six million barrels per day – running through only a few facilities each day. “Abqaiq or Ras Tanura is what Wall Street is for the financial system. What Hollywood would be for the movie industry.” – Gal Luft, Institute for the Analysis of Global Security and author of several books on oil security

Venezuela boasts the second largest oil reserves in the world, but many of the country’s fields require heavy investment to maintain production capacity. Turmoil within the country – opposition to socialist policies touted by former President Hugo Chávez, civil unrest and high crime rates, especially along the Venezuela-Colombia border – discourage foreign investment and consequently pose a challenge to the country’s profit-driving oil industry.

Nigeria. Militant groups seeking a share of Nigeria’s oil wealth – such as the Movement for the Emancipation of the Niger Delta, or MEND – repeatedly attack the country’s oil infrastructure and personnel. Since 2005, when Nigeria reached its oil production peak, the county has seen a steep increase in pipeline vandalism, kidnappings and militant takeovers of oil facilities in the Niger Delta, the heart of Nigerian oil production. “There has been attacks on oil pipelines, and foreign oil workers are being held hostage… this escalating attack is also helping drive up oil prices.” – Testimony of economist George N. N. Ayittey, U.S. House of Representatives hearing, “Nigeria’s Struggle with Corruption,” 2006

Posted in Chokepoints | Comments Off on Vulnerabilities pose risks in top U.S. oil suppliers Elizabeth Bunn