Energy Overview. Oil is butter-fried-steak wrapped in bacon. Alternative Energy is lettuce.

cartoon peak oil gas coal uranium

Why oil is so hard to replace

1) How much fossil fuel energy is burned?

In 2013, the United States burned 96.5 quads (96.5 quadrillion BTU’s) of energy a year, 84% was fossil fuels: 36 petroleum, 26 natural gas, 18.5 coal. In 2013, the United States generated about 4,058 billion kilowatt hours of electricity, 67% from fossil fuels (coal 39%, natural gas 27%, and petroleum 1%), 19% nuclear, and 7% hydropower.

Renewables are a tiny fraction of that, with biomass at 1.48%, geothermal 0.41%, solar 0.23%, wind 4.13%. At the rate they’re growing, it would take thousands of years to replace fossils, which since 2013 have continued to grow in overall energy production far more than renewables.

Electricity is just 15% of our energy use.

So using wind and solar to replace the 67% of electricity from fossil fuels doesn’t make even a tiny dent in the way the other 85% of energy is used which comes from fossil fuels, for essentials such as transportation, manufacturing, and heating.

2) This is a liquid fuel crisis because nearly all FREIGHT transportation runs on oil, mainly diesel.

I like to fly and drive cars, but they don’t plant, harvest, and deliver food — tractors, harvesters, and trucks do that.  We might not like it, but we can live without cars and airplanes.  But not without trucks, railroads, and ships.

These billions of diesel-engine-powered vehicles and equipment represent trillions of dollars of investment with lifespans of 20 to 40 years, so you can’t just wave a magic wand and instantly replace them, and their billions of tons of steel, copper, aluminum, and so on, which also require energy.

Diesel is available at over 160,000 service stations in the U.S. alone.  Whatever you think a “something else” might be, that’s a huge distribution system that also has to be replaced.

3) We can’t electrify the transportation that matters most: medium and heavy trucks, tractors and harvesters, ships, mining equipment, etc.

Batteries and fuel cells aren’t energy carriers – they store the electrical energy generated mainly by  non-renewable natural gas and coal.

Diesel & gasoline (46 MJ/kg) have up to 92 times the energy density of a lithium battery and 271 times the energy density of a lead-acid battery.

A truck can’t move even an inch with a battery 92 to 271 times the size and weight of its current diesel-fuel containing tank.

The maximum possible energy density, according to laws of physics and thermodynamics, of a perfect battery is 3 MJ/kg, which is still 15.3 times less than diesel, so you’d still need a “gas” tank 15.3 times larger.  I explain in “Who Killed the Electric Car” why it’s unlikely such a battery will ever be developed.

And the lifespan of batteries isn’t nearly as long as diesel engines.

Read all about it in “Diesel is finite. Trucks are the bedrock of civilization. So where are the battery electric trucks?” and the related article links within.

4) Scale. World-wide, we burn 1 cubic mile of oil a year.  Here’s what you’d need to do to replace that energy 

1 cubic mile of oil

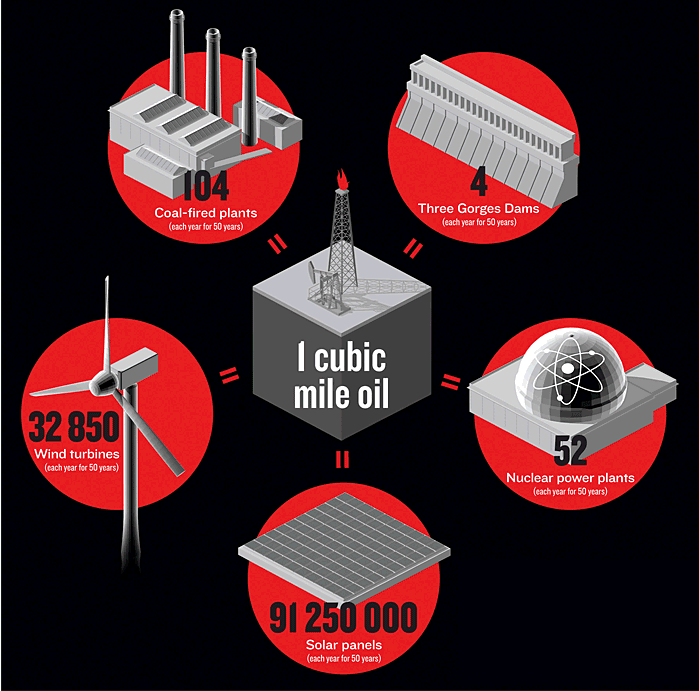
Allowing fifty years to develop the requisite capacity, 1 Cubic Mile of energy per year could be produced by any one of these developments (source Joules, BTUs, Quads-Let’s Call the Whole Thing Off – IEEE Spectrum):

5) Energy Density

Oil is a butter fried steak wrapped in bacon.  Solar, Wind, and most other alternative energy resources are lettuce. You’d get all of your 2,000 calories a day from one and a quarter pounds of bacon-wrapped steak, versus 31 pounds of lettuce.

Oil is second only to uranium in energy density. This is because a gallon of gas comes from 100 tons of prehistoric plant matter (40 acres of wheat), condensed like moonshine over millions of years into the densest form of solar energy on the planet.  If you look at just the gasoline consumed every year in America, 131 billion gallons, that’s equal to 25 quadrillion pounds of prehistoric biomass.

6) Fossil fuels not only provide the energy to make goods, they are also physically used as a feedstock in over 500,000 products — the basis of the petrochemical industry

Here are just a few: Medicines, Ink, Hand lotion, Nail polish, Heart valves, Toothbrushes, Dashboards, Crayons, Toothpaste, Luggage, Parachutes, Guitar strings, DVDs, Enamel, Movie film, Balloons, Antiseptics, Paint brushes, Purses, Sunglasses, Footballs, Deodorant, Glue, Dyes, Pantyhose, Artificial limbs, Oil filters, Ballpoint pens, Skis, Pajamas, Golf balls, Perfumes, Cassettes, Contact lenses, Shoe polish, Fishing rods, Dice, Fertilizers, Electrical tape, Trash bags, Insecticides, Floor wax, Shampoo, Cold cream, Tires, Cameras, Detergents

7) If you wanted to invent an ideal energy source, you’d make oil

Oil has extremely high energy density, and is the most convenient form of energy ever discovered. As a liquid, it’s easily stored, transported, and used. It’s wonderfully combustible, but with a high enough flashpoint that it doesn’t explode easily.

Oil is a liquid, easily transported in pipelines (by far the least energy to move versus rail, truck, or ship). It takes very little time to pour gas or diesel into a vehicle gas tank. Compared to natural gas or hydrogen, petroleum takes up very little space.

Solids like wood, coal, oil shale, and biomass can’t be put into a pipeline (the cheapest way to move energy), and it takes energy to convert them to a liquid fuel.  They’re less convenient to transport than a liquid or gas.

Gases take up so much space, you need to compress or liquefy them, and that takes both energy and time.

Energy from wind or solar can’t easily be transported, first you have to build apparatus to harness the wind or sun, then you have to convert the energy to something that can travel, such as electricity, which requires an expensive electric grid.

8) Alternative energy resources are dependent on fossil fuels from start to finish and beyond to operations & maintenance

For example, consider a windmill.  A windmill farm in the Escalante desert, built to produce 5.55 TWh of power, would require 13.8 million pounds of aluminum, 2.8 trillion pounds of concrete, 639 billion pounds of steel, etc.  The wind farm would occupy over 189 square miles.  In 1992 dollars such a wind farm would cost $200 million, which doesn’t include labor, future operational, and maintenance costs, and would serve less than 1% of the United States population (Pacca).

After fossil fuels are gone, the windmills must be able to generate enough energy to maintain themselves and reproduce new windmills, including all of the equipment and tools used to mine the metal and concrete, forge metal into blades and towers, the energy needed to deliver 8,000 parts from all over the globe by ship, rail, or truck and build/maintain all ships, railroads, and trucks (which corrode/rust and need replacement every 6 (trucks) to 29 (ships) years, and the roads the trucks drive on to deliver the windmills to be delivered to their sites.  Windmill energy must also provide the energy to build and maintain the electric grid and storage infrastructure, and all of the workers involved in the process from birth, to school, to the vehicles they arrive at work in 18+ years later.  Any extra energy generated beyond these needs can now be used to run the rest civilization.

9) At the heart of our dilemma is the fact that Oil is the MASTER RESOURCE that UNLOCKS ALL OTHER RESOURCES.

Nothing is impossible if you have oil:

  • As long as you have oil, you have fresh water, because you can drill down and pump it up from 500 feet below or desalinate it
  • As long as you have oil, you can go to the most distant parts of the ocean to find the last schools of fish with sonar and spotting planes.
  • As long as there is oil, even ore with a very low percent of metal can still be used to get metals to make stuff with, such as alternative energy contraptions
  • Food is grown with oil-based pesticides, planted, harvested, distributed, packaged, cooked, and so on with fossil fuels.
  • When oil declines, where will we get the energy to do phenomenal things like moving  The Tallest structure ever moved by Mankind? 

10) TIME. We’re running out of it.

The Department of Energy paid Robert Hirsch to do a Peak Oil study in 2005. Hirsch concluded you’d want to start at least 10, or better yet, 20 years ahead of time before peak oil to prepare for the transition to other energy resources.

Conventional oil peaked world-wide in 2005 (Kerr 2011, Murray, IEA World Energy Outlook 2010) and we’ve been on a plateau ever since then.  We don’t have 10 or 20 years. Unconventional oil is nasty, heavy, difficult and very expensive to get at and has a very slow rate of flow — very soon (between now and 2025) it will not be able to make up for the decline rate of conventional oil.

11) Why we can NOT substitute natural gas, liquefied coal, tar sands oil, and other liquid fuels for diesel 

Not enough Natural Gas to use for Transportation

The National Resource Council noted that we don’t have enough natural-gas to use as a feedstock for transportation-fuel production. So we’d have to import it and we don’t have the infrastructure to do that or distribute it. We also increasingly are using natural gas for electricity production and to keep the grid from blowing up from intermittent alternative energy like wind and solar with NGCC plants.   Natural Gas vehicles aren’t a solution — there aren’t enough fueling stations, and the tanks take up most of the trunk space, their range is at best 100-150 miles, and the public thinks of natural gas as too explosive.

Local truck fleets can use CNG and LNG or diesel made with GTL, but there just isn’t enough natural gas in the USA for this to last very long – the fracking boom is temporary. So it doesn’t make much sense to build fleets of trucks that can use CNG at a time when supplies are about to end, and NG is also needed to generate electricity and balance wind and solar power.  CNG/LNG aren’t likely to be added to over 100,000 gas stations either.

Coal-to-liquids would use half the energy contained in the coal to make it and require doubling of coal production. If Carbon sequestration were used, then another 40% of the energy would be used. Oh, and we’re at peak coal too, certainly energy-wise – we’ve used most of the easy, high-energy coal. More research needs to be done to determine exactly what the reserves are now though, since it hasn’t been done since 1974.  But the few studies done since then have found less reserves, not more in the areas studied.

Dimethyl ether (DME) has about half the energy content of diesel fuel, so a truck will have to carry about twice the amount of DME for a given range – a penalty that’s worse than CNG and LNG. Two gallons of DME weigh 11 pounds compared to diesel’s 7.5 pounds, so a DME-fueled truck or tractor will be heavier than a diesel-fueled truck, and is better suited to local than long-haul distances. Diesel engines need a special injection system and different cylinder heads to handle the high fuel flow of DME, and steel fuel tanks to store it aboard a truck.  The refining process from natural gas to DME may have too high an EROEI as well. As with other gas-to-liquids processes, the first step is conversion to syngas, a mixture of hydrogen, carbon monoxide, and carbon dioxide. This syngas is then synthesized into methanol. Finally, DME is produced through a methanol dehydration reaction.The primary challenge facing the use of DME is the lack of an infrastructure for distribution. Other disadvantages include low viscosity, poor lubricity, a propensity to swell rubber and cause leaks, and lower heating value compared with conventional diesel (NAS 2009).  DME costs twice as much to make as methanol, an intermediate product in the methane-to-DME refining process, and is also more expensive to make than diesel fuel, so refiners prefer to sell methanol.  DME is mainly used as aerosol propellant to replace chloroflurocarbons in paints and cosmetics. World-wide production of DME in the world is less than 150,000 tons per year.

12) Economic, political, social obstacles

Can we really afford to spend trillions on new vehicles and renewable energy and fix our broken infrastructure, and pay for medicare, social security, and so on?

How much energy will be needed to fight wars to keep the oil flowing?

There’s a lot of social opposition to building new dams, LNG facilities, wind turbines, and so on.

Alternative Energy Sources

In the news:

Fact Check: Las Vegas does NOT run on renewable energy, just 140 government offices

1) Renewables are INTERMITTENT and UNRELIABLE

Renewables are far worse off than fossil fuels and even wood when it comes to another crucial energy quality: continuity of supply. A coal-fired power plant can be cranked up as needed; not so sun or wind.

Coal-fired, gas-fired, or nuclear power plants operate 75% to 90% of the time. But wind turbines typically operate between 20 and 35% of the time. The sun is always unavailable half the time, plus whenever there’s cloud cover.

Often wind power or solar power is generated when it is least needed, wind power at night, and solar power much less in the winter when there’s both less sunshine and the angle of the sun generate less power.

Worse yet, building wind and solar doesn’t mean you can get rid of coal, natural gas, or nuclear power plants at all. In fact, often utilities have to build natural gas combined cycle plants to quickly kick in to make up for the power lost when the wind stops blowing or the sun stops shining.

Wind and solar make the grid LESS RELIABLE:

“Within minutes of wind or solar disappearing, a thousand megawatts of electricity — the output of a nuclear reactor — can disappear and threaten stability of the grid. To avoid that calamity, fossil fuel plants have to be ready to generate electricity in mere seconds. That requires turbines to be hot and spinning, but not producing much electricity until complex data networks detect a sudden drop in the output of renewables. Then, computerized switches are thrown and the turbines roar to life, delivering power just in time to avoid potential blackouts. The state’s electricity system can handle the fluctuations from existing renewable output, but by 2020 vast wind and solar complexes will sprawl across the state, and the problem will become more severe.”

Renewable energy adds unprecedented levels of stress to a grid designed for the previous century.  Green energy is the least predictable kind.  “The grid was not built for renewables,” said Trieu Mai, senior analyst at the National Renewable Energy Laboratory. The role of the grid is to keep the supply of power steady and predictable. Engineers carefully calibrate how much juice to feed into the system as everything from porch lights to factory machines are switched on and off. The balancing requires painstaking precision. A momentary overload can crash the system (Halper).

Engineers haven’t yet developed energy storage devices suitable for storing solar and wind power, and they would add to the ultimate cost.

2) Patchiness

Many of the windiest and sunny regions in the world are virtually uninhabited, so electricity would have to be moved long distances to cities. The same patchiness holds for other renewables, from geothermal to hydro energy. For biomass, everyone has some arable land for growing energy crops, but much of it is already spoken for. And even if the land were available, energy crop yields would fall short of the need.

3) TIME

Check out this post by Roger Andrews, Renewable Energy Growth in Perspective, which shows how insignificant wind and solar are in the amount of overall energy used by society (and hydro and geothermal as well).

The “sobering reality,” Smil says, is that there is only one renewable—solar energy—that could by itself meet future energy demands. Wind power could conceivably make a significant contribution, but the rest—hydro, biomass, ocean waves, geothermal, ocean currents, and ocean thermal differences—would provide just one-tenth to one-ten-thousandth of today’s energy output from fossil fuels. So the bulk of the burden will fall on solar, but turning the sun’s rays into useful energy has a long way to go, Smil notes. Today, photovoltaic electricity accounts for less than 0.1% of the world’s electricity. Solar heating, such as solar water heaters, accounts for less than 0.1% of total global energy production. Such numbers would have to grow rapidly for a long time to make a difference, but renewables’ handicaps do not bode well for speeding up the next energy transition. Fossil fuels “were phenomenally attractive,” yet it still took 50 to 70 years to bring them into widespread use, says IIASA’s Grübler. That’s because, no matter how attractive a fuel might be, it takes time to create the infrastructure for extracting and transporting the resource, converting it into a usable form, and conveying it to the end user. It also takes time for inventors to develop enduse technologies—such as steam engines, internal combustion engines, and gas turbines—and for consumers to adopt them and create demand. Renewables “will be slower because they’re less attractive,” says Grübler. “They don’t offer new services; they just cost more.” (Kerr)

4) Dependence on other stuff

You have to build windmills to harness wind, solar plants to harness solar power.  These apparatus need all kinds of materials depleting faster than even oil, coal, and natural gas.  There isn’t a single object or step that doesn’t have fossil fuel inputs – ore is mined with ore trucks, crushed to extract the ore, smelted, fabricated, delivered.

5) Environmental Impact

Biofuels deplete topsoil and aquifers, nuclear energy plants can melt down and there’s nowhere to put the waste, dams displace people, mining the metals for wind and solar PV harm the environment, and so on. Dams emit a lot of carbon dioxide during construction from the massive use of cement, methane is released from drowned plants, habitat is destroyed, water quality changes, gravel and sand are trapped behind the dam walls, affecting beaches, estuaries, and rivers downstream, prevent salmon from spawning, and so on.  Any kind of reactor that uses water to cool down with (coal, nuclear) heats the water which can harm the habitat.

6) Is the resource renewable?

What’s the point in replacing fossil fuels with something temporary?  We want something sustainable that will last forever.  Wind and sunlight are renewable, but the equipment to capture the wind and sunshine are not renewable, because the equipment requires non-renewable metals, minerals, and significant amounts of non-renewable oil, coal, and natural gas to make.

Wood is renewable, but only if not too much is harvested. John Perlin documents many civilizations that fell because they harvested too much wood in his wonderful book “A Forest Journey: The Role of Wood in the Development of Civilization”

7) Scale — see #3 above – there is nothing we could build that would replace a cubic mile of oil every year

8) Is the resource close enough to get?

We’ve built millions of miles of natural gas pipelines at over a million dollars per mile.  There are a lot of natural gas reservoirs we’d love to exploit, but it would cost too much to run pipelines to them, more than what the natural gas could be sold for.

Most of our wind is in Montana, North Dakota, and South Dakota, far from the big cities where people live. The cost of harvesting wind in these states and building up the electric grid to deliver the electricity is simply too much money, plus 10% of the electricity is lost as it travels such long distances.  And as we heat up from climate change, the risk of the wires starting forest fires grows.

Solar power is best in the far Southwest, again, far from the main population centers (except for southern California and Arizona).

Most of the power from the ocean (Wave, Tide, Ocean Current, OTEC) or rivers is too far to hook up to the electric power grid (and vulnerable to corrosion, hurricanes, large waves, bio-fouling, high capital costs, etc).

9) Energy Density (also see #4 above)

Weight density. An electric battery typically is able to store and deliver only about 0.1 to 0.5 MJ/kg, and this is why electric batteries are problematic in transport applications: they are very heavy in relation to their energy output. Thus electric cars tend to have limited driving ranges.

Volume (or Volumetric) Density This refers to the amount of energy that can be derived from a given volume unit of an energy resource (e.g., MJ per liter). Obviously, gaseous fuels will tend to have lower volumetric energy density than solid or liquid fuels. Natural gas has about .035 MJ per liter at sea level atmospheric pressure, and 6.2 MJ/l when pressurized to 200 atmospheres. Oil, though, can deliver about 37 MJ/l. In most instances, weight density is more important than volume density; however, for certain applications the latter can be decisive. For example, fueling airliners with hydrogen, which has high energy density by weight, would be problematic because it is a highly diffuse gas at common temperatures and surface atmospheric pressure; indeed a hydrogen airliner would require very large tanks even if the hydrogen were super-cooled and highly pressurized.

The greater ease of transporting a fuel of higher volume density is reflected in the fact that oil moved by tanker is traded globally in large quantities, while the global tanker trade in natural gas is relatively small. Consumers and producers are willing to pay a premium for energy resources of higher volumetric density.

Area density This expresses how much energy can be obtained from a given land area (e.g., an acre) when the energy resource is in its original state. For example, the area energy density of wood as it grows in a forest is roughly 1 to 5 million MJ per acre.  Area energy density matters because energy sources that are already highly concentrated in their original form generally require less investment and effort to be put to use.

If the energy content of the resource is spread out, then it costs more to obtain the energy, because a firm has to use highly mobile extraction capital [machinery], which must be smaller and so cannot enjoy increasing returns to scale. If the energy is concentrated, then it costs less to obtain because a firm can use larger-scale immobile capital that can capture increasing returns to scale. Thus energy producers will be willing to pay an extra premium for energy resources that have high area density, such as oil that will be refined into gasoline, over ones that are more widely dispersed, such as corn that is meant to be made into ethanol.

10) High Energy Returned on Energy Invested

At the start of the oil age, the net energy — the amount produced versus how much energy was used to produce it  was 100:1.

That left 99 other units of energy to build houses, roads, bridges, airports, railroads, schools, hospitals, drinking water and sewage treatment plants, chemicals, amusement parks, drive across the country, heat and cool structures, build millions of electronic gadgets, toys, and so on.

Charles A. S. Hall estimates you’d need an EROEI of at least 12 to 13:1 to run civilization as we know it.

Solar PV has an EROEI of only 2.45 in sunny Spain, and somewhere between 1.6 and 2 in Germany.

Richard Heinberg defines EROEI as

  • The amount of useful energy that’s left over after the amount of energy invested to drill, pipe, refine, or build infrastructure (including solar panels, wind turbines, dams, nuclear reactors, or drilling rigs) has been subtracted from the total amount of energy produced from a given source.
  • If 10 units of energy are “invested” to develop additional energy sources, then one hopes for 20 units or 50 or 100 units to result.
  • “Energy out” must exceed “energy in,” by as much as possible. Net energy is what’s left over that can be employed to actually do further work. It can be thought of as the “profit” from the investment of energy resources in seeking new energy.
  • The net energy concept bears an obvious resemblance to a concept familiar to every economist or businessperson—return on investment, or ROI. Every investor knows that it takes money to make money; every business manager is keenly aware of the importance of maintaining a positive ROI; and every venture capitalist appreciates the potential profitability of a venture with a high ROI. Maintaining a positive energy return on energy invested (EROEI) is just as important for energy producers, and for society as a whole.
  • The transition to alternative energy sources must be negotiated while there is still sufficient net energy available to continue powering society while at the same time providing energy for the transition process itself.

Heinberg prefers EROEI over EROI because the latter might lead readers to think it means energy returned on money invested.  Money is meaningless, an abstract concept to grease the wheels of commerce, not something you can put in your gas tank and drive on.  It’s best to leave money out of net energy (EROEI) considerations.  I don’t use EROEI as much as I’d like to because people just don’t get it, and change the discussion, or reply with objections in terms of  money, which they’re more familiar with.

I also despair of discussions about EROEI, because corporate scientists who always publish in non-peer-reviewed journals easily fool the public by setting the boundaries too narrowly.  For instance, researchers who found ethanol production to have a positive EROEI above 1:1 only considered the energy used at the ethanol refinery.  They left out the energy to make tractors, the energy to plant, fertilize, harvest, and deliver the corn to the ethanol plant, and trucks and trains delivering the ethanol after it’s been made (it can’t go in a pipeline).

Another problem is that the EROEI of each wind or solar plant will vary depending on how old it is, where it is, and so on.

Back when we depended on wood before coal, and grew all of our food, it took 90% of the population to produce enough food to feed themselves and another 10% of town folk who were merchants, artists, soldiers, or gentry.  Even as recently as 1850 over 65% of work done was muscle-powered, versus only 1% today now that machines do most of the work.  Just 1 liter of oil is equal to a person working two weeks of 10-hour days (Pimentel).

11) Electricity doesn’t solve our problems

Smelting requires coal.  Not electricity.  Large vehicles will never be able to run on (electric) batteries or fuel cells.  They’re too heavy, and the laws of physics mean that per unit weight, they can only carry a small fraction of the energy the same weight of energy-dense oil can:

“Today’s lead acid batteries can store about 0.1 mega-joules per kilogram: 500 times less than crude oil (50 MJ/k).  Lithium ion batteries are able to deliver .5 mega-joules per kilogram: 100 times less than oil.  The theoretical maximum a battery could ever deliver is 5 mega-joules per kilogram, 10 times less energy than oil”, according to Kurt Zenz House, Chief Executive of C12 Energy.

Who cares about cars?  Since the billions of diesel engines that do all of the work of society that keeps us alive — tractors, harvesters, trucks, trains, and ships can’t be converted to run on electricity, we’re back to the age of wood again, and 2 billion people or less on the planet.

12) Scaling up is hard to do

No matter what the technology, bringing something that works in the lab to commercial scale is hard to do. See Lester et al., (2015) “Closing the Energy-Demonstration Gap” from Issues in Science and Technology, Volume XXXI Issue 2 for details

13) Renewables are Expensive!

FYI, here are the so-called Leveraged Cost of Energy figures of various electricity generating sources:

eia-2016-lcoe-2022-fossil-nukes-renewable

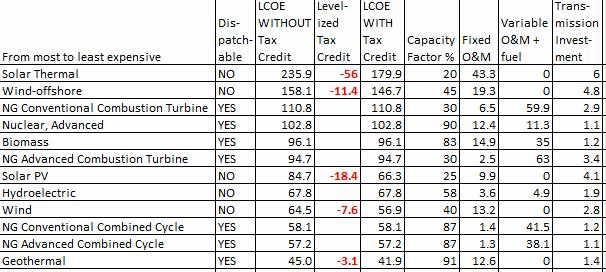
Table 1b. Estimated LCOE (simple a verage of regional values) for new generation resources, for plants entering service in 2022    Source: EIA. August 2016. Levelized Cost and Levelized Avoided Cost of New Generation Resources in the Annual Energy Outlook 2016. Energy Information Administration.

I have several problems with the numbers in Table 1b above

The cost of wind and solar may seem cheap, but:

  1. Power that’s dependable and available whenever you want it around the clock if need be (high capacity factor) is more valuable than intermittent, unpredictable, variable power like wind and solar. The EIA doesn’t consider hydropower dispatchable because it varies seasonally and is often not available since it’s being held back for agriculture, drinking water, and maintaining a healthy ecology, especially for the fishing industry.
  2. Wind and solar power DEPEND on backup power, from mostly natural gas (because coal and nuclear don’t ramp up and down quickly enough) to keep the electric grid in exact balance between supply and demand.
  3. Some fraction of the LCOE for fossil and nuclear plants and energy storage should be added to the LCOE costs of wind and solar since they can’t exist on their own.
  4. Subsidies make renewable costs look better than they are. Tax credits in 2022 will be LOWER than what they are now, so the actual LCOE figures with subsidies NOW are HIGHER than in the future

The table has higher capacities than reality that make renewables sound better than they are:

  1. Hydropower capacity is 37.3%, not 58%.
  2. Wind capacity is 33%, not 40%, and since most of the best wind is already built out in most states, it is likely wind capacity will go DOWN in the future.
  3. Geothermal is 73.1 not 91
  4. Biomass is 56.1 not 83
  5. The above are from EIA Table 6.7.B. Capacity Factors for Utility Scale Generators Not Primarily Using Fossil Fuels

Natural gas production is expected to peak in 2020, yet huge amounts of coal and nuclear plants have already retired or will over the next 20 years, which accelerates depletion even faster.  Coal plants can’t come back because we are 1) past peak coal, 2) Carbon Capture and Storage (CCS) technology is far from commercial and 3) uses far too much energy to ever be commercial, about 40% of the power generated.

Overviews

  1. David Fridley, LBNL scientist
  2. No single or combination of alternative energy resources can replace fossil fuels
  3. Wind & Solar need thousands of tons of steel, aluminum, cement, concrete, copper but produce little energy
  4. High-Tech can’t last: Limited minerals & metals essential for wind, solar, microchips, cars, & other high-tech gadgets
  5. Alternative Energy Reading List
  6. Heinberg, Richard. September 2009. Searching for a Miracle. “Net Energy” Limits & the Fate of Industrial Society. Post Carbon Instutite.  Heinberg concludes there will be no combination of alternative energy solutions that might enable the long term continuation of economic growth, or of industrial societies in their present form and scale.

Issues by type of Alternative Energy Resource

Also go to the energy and books sections of energyskeptic to get more detailed information on specific kinds of energy.

The only hope to replace the problem we face — the need for liquid transportation fuels — would be biomass converted to diesel.  We don’t have enough biomass to do this. Even if you burned every single plant in America, including their roots – which is much more energy producing than converting all of this biomass to liquid fuels, you would still produce less energy than we burn in a year, and you’d be left with a barren moonscape.

Biofuels have a low EROEI (possibly negative in fact), and are tremendously ecologically destructive — they deplete topsoil, aquifers, are the 3rd major source of carbon dioxide from cutting down rainforests to grow palm oil, runoff of fertilizer to grow biomass creates vast dead zones in waterways, make food prices far more expensive as corn is diverted to make fuel instead, and much more (see “Peak Soil“).

Biomass

Most forms of alternative energy create electricity, which doesn’t solve the main problem, the need for LIQUID TRANSPORTATION FUELS.  There are enormous issues with the electric grid which wind, solar, and other kinds of generated electricity travel over

Electric Grid

Batteries

Fusion

Geothermal

Hydrogen

Hydropower

Methane Hydrates

Nuclear Power

Solar

Wave and Tidal

Wind

The best books and articles to understand in detail the problems with the various kinds of energy are:

References

Bucknell III, Howard.  1981.  Energy and the National Defense.  University of Kentucky Press.

Frumkin, H. Energy and Public Health: The Challenge of Peak Petroleum.  http://www.ncbi.nlm.nih.gov/pmc/articles/PMC2602925/

Hall, C.A.S., R. Powers and W. Schoenberg. 2008. Peak oil, EROI, investments and the economy in an uncertain future.  in Pimentel, David. (ed). Renewable Energy Systems: Environmental and Energetic Issues. Elsevier London

Halper, E. Dec 2, 2013.Power struggle: Green energy versus a grid that’s not ready. Minders of a fragile national power grid say the rush to renewable energy might actually make it harder to keep the lights on. Los Angeles Times.

Huber, Peter. Nov 27, 2006. Love Uranium. Forbes.

IEA World Energy Outlook 2010 (world oil peaked in 2006).

Kerr, Richard. 13 Aug 2010. Do We Have the Energy For the Next Transition? Past energy transitions to inherently attractive fossil fuels took half a century; moving the world to cleaner fuels could be harder and slower. Science Vol 329.

Kerr, Richard. 25 March 2011.  Peak Oil May Already Be Here. Science Vol. 331 no. 6024 pp. 1510-1511

Murray, J., and King, D. 26 January 2012. Oil’s tipping point has passed.  Nature, Vol 481 pp 43-4

NAS 2009. America’s Energy Future: Technology and Transformation. 2009. National Academy of Sciences, National Research Council, National Academy of Engineering.

NAS 2010. Hidden Costs of Energy: Unpriced Consequences of Energy Production and Use. 2010. Committee on Health, Environmental, and Other External Costs and Benefits of Energy Production and Consumption; National Research Council

NAS 2013. Transitions to Alternative Vehicles and Fuels Committee on Transitions to Alternative Vehicles and Fuels; Board on Energy and Environmental Systems; Division on Engineering and Physical Sciences; National Research Council

Pacca, S. et al. July 15, 2002. Greenhouse Gas Emissions from Building & Operating  Electric Power Plants. Environ Sci Technology 36(14):3194-200.

Pimentel, David et al. 2008. Food, Energy and Society,Third Edition.

Posted in Alternative Energy, An Overview, Energy, Oil, Peak Oil | Tagged , , , , , , , , , , , , , , , , | 2 Comments

Why World War III Could Start In Space Forbes

Why World War III Could Start In Space

April 25, 2014. We are inextricably linked to hundreds of spacecraft racing around our planet.  But near-Earth space is reaching a saturation point — a detail driven home in James Clay Moltz’s new space history — Crowded Orbits: Conflict and Cooperation in Space. And the idea that such orbital competition could potentially trigger a global conflict is one of the book’s major themes.

In “Crowded Orbits,” Moltz — an expert on space policy and national security issues — covers the civil, military and commercial space sectors, but also includes chapters on diplomatic space initiatives and future trends. Forbes.com turned to the author, a professor at the Naval Postgraduate School in Monterey, California, to learn more.

Is space warfare in our future?

If one tracks current trends and the increasing rate of military spending on space by a variety of countries, one has to worry. These militaries are going to have to engage in mutual restraint if conflict is going to be avoided.

We managed to do so during the Cold War through U.S.-Soviet non-interference pledges, ongoing talks, and a shared belief that satellite security was critical to nuclear stability and arms control. It is less clear that such restraint will prevail in the 21st century.  This decade nearly a dozen countries will have the ability to test space weapons and/or attack enemy spacecraft.

You argue that warfare in earth orbit would create totally uncontrolled projectiles traveling 17,000 mph. What would be the immediate effects?

China’s 2007 ASAT (anti-satellite weapons) test created over 3,000 pieces of large orbital debris (larger than 4 inches in diameter), which will now continue to hurtle around the Earth at orbital speeds (over 17,000 mph) for some 40 or more years; until they finally re-enter the atmosphere and burn up.

Any piece of this debris field could hit a satellite or, worse, a manned spacecraft and cause serious damage, depressurization, and death. A space war involving even just a dozen similar attacks on satellites would create such a large field of hazardous debris that it could render low-Earth orbit too dangerous for astronauts or high-value spacecraft —making near-Earth space essentially unusable.

Does Iran or North Korea possess the technology for space-to-space warfare?

Not yet. The challenge will be whether existing space-faring countries can convince newly-emerging space actors to behave responsibly. One possible incentive is that in space, destructive acts — such as the release of orbital debris from weapons tests — harm everyone in orbit. So, China, Russia, and other developed space powers share an interest in ensuring safe access to space.

What effect has the 1967 Outer Space Treaty had on deterring an all out arms race in space?

The Outer Space Treaty and other agreements have created strong norms of restraint. A current effort—started by the European Union—to create an International Code of Conduct for Outer Space Activities would enhance cooperation in space situational awareness and traffic control; encourage non-interference and debris mitigation; and require yearly consultations among signatories on space security issues.

Whether these mechanisms will be enough to prevent future space conflict and the possible ruination of critical orbits remains to be seen. There are still loopholes for weapons testing and deployment within existing treaties that could create serious future problems.

You mention that during World War II, the Nazis had planned a military space bomber aimed at attacking the U.S. Could you elaborate?

It was a rocket-powered manned aircraft that would enter space en route to its target. Its planned flight profile was in some respects similar to Virgin Galactic’s SpaceShipTwo—which has a conventional take-off and then a rocket assist to get into space. But the so-called “Amerika” bomber had military aims and a weapons payload.

The commercial space sector has grown into an industry that grosses nearly $300 billion annually. What do you see as its primary Achilles’ heel going forward?

The primary challenges faced in the coming years by the commercial space industry are: possible degradation of the geostationary orbital belt (22,300 miles up) by orbital debris and satellite crowding; exhaustion of the available radio-frequency spectrum; and inaction by countries in reining in illegal jamming of satellite communications.

How will the cubesat revolution exacerbate these already crowded orbits?

Cubesats typically have no means of propulsion. This means that they cannot get out of the way of impending collisions and frequently are delivered into low-Earth orbit in batches, meaning that the cubesats all look alike from the ground because of their identical shape and small size. This poses a problem in cases involving damage liability.

The U.S., Russia, and China are all known to have offensive space weaponry. Anyone else?

At present, only three countries have tested devoted space weapons. But a number of other countries are capable of doing so, and India and a few others have already stated their intention to develop these capabilities.

Although U.S. and Soviet nuclear weapons tests took place in space from 1958-62, they are now prohibited by the 1963 Partial Test Ban Treaty. Countries might decide to violate this agreement, but they would risk the ire of all space-faring nations since electromagnetic pulse radiation would harm all unhardened satellites indiscriminately.

What about kinetic weapons?

Kinetic space weapons include direct-ascent systems (that move straight from launch—using a radar or infrared seeker—to collide with their target) and co-orbital systems (that maneuver over several orbits into the same altitude and inclination of their target satellite and then destroy it). Fortunately, both types have specific limitations.

Less discriminate kinetic weapons include the distribution of sand, pebbles, or other objects into crowded areas of space, which could destroy random satellites. Presumably, such a weapon would only be used by a terrorist (and only if they afford a rocket).

And lasers and killer satellites?

High-powered lasers based on the ground or in space could harm sensors or cause spacecraft fuel tanks to explode. They include satellites capable of space-to-space capture or kill activities, or possible microwave weapons, which could damage a satellite’s electronics. Weapons with less permanent effects include electronic jammers, which interfere with broadcast signals or satellite controls. Fortunately, few effective space weapons have been tested to date, and even fewer deployed. So, there is still a reasonable potential to stop their proliferation.

If satellite launches jump from under a 100 per year, at present, to a 1000 or more by 2020, what sort of political tension will this create?

The coming increase in satellite numbers will make collisions far more likely and give added impetus to efforts to improve space situational awareness and traffic control, especially in low-Earth orbit.

What’s the worst satellite collision to date?

The most serious was the 2009 collision of a functioning Iridium [telecommunications] satellite with a dead Russian Cosmos spacecraft. No liability came into play because the Russian spacecraft was not operational, so the loss for Iridium could not be “blamed” on the Russians.

A more serious incident might be one involving a U.S., Russian, or Chinese military satellite in a time of crisis, where there could be considerably more tension, mistrust, and possible counter-actions. It is not hard to see such an incident bringing countries to the brink of war.

Posted in War | Comments Off on Why World War III Could Start In Space Forbes

Gail Tverberg on why Oil Decline will be FAST

Will the decline in world oil supply be fast or slow?

April 11, 2011 by Gail Tverberg

Below are excerpts, read the link above to see all of this excellent article. Gail makes the case that the downslope of energy production is likely to steeper than Hubbert’s Curve would predict.

(1) A slow decline assumes that the only issue is geological decline in oil supply, and the economy and everything else can go on as usual. Technological advances and switches to alternatives might also be expected to help keep supply up.

(2) A fast decline can be expected if one or more adverse factors make oil supply decline faster than geological factors would suggest. These might include:

  • Liebig’s Law of the Minimum – some necessary element for production, such as political stability, or adequate food for the population, or adequate financial stability, is missing or
  • Declining Energy Return on Energy Invested (EROEI) interferes with the functioning of society, so the society generates too little net energy, and economic problems ensue, or
  • Oil becomes so high priced that there is little demand for it. This would quite likely be related to declining EROEI.

The faster decline scenario is likely, because we will hit limits that interfere with oil production or oil demand.

Declining EROEI

EROEI means Energy Returned on Energy Invested.  Wikipedia says: When the EROEI of a resource is equal to or lower than 1, that energy source becomes an “energy sink, and can no longer be used as a primary source of energy. The situation is worse than that.

An economy needs a certain level of energy just to keep its infrastructure — roads, bridges, schools, medical system, etc. — repaired and working. So energy resources need an EROEI significantly higher than 1 to maintain the system at its current level of functioning.

[MY NOTE: Charles A. S. Hall, one of the founders of EROEI, estimates you’d need an EROEI of least 12 or 13 to maintain civilization as we know it now]

If the average EROEI available to society is falling because oil is becoming more and more difficult to extract, an economy with a high standard of living, the US will be more affected than countries with a lower standard of living, like China or India.  Ultimately, though, the world is one economy, so problems in one country are likely to affect the economies of other countries as well.

More issues related to declining EROEI:

1. High cost to extract. Sources of oil or natural gas or coal that are difficult (high cost) to extract tend to be lower in EROEI than sources that are low-cost to extract. So high cost of extraction tends to be a marker for low EROEI. We are increasingly running into this issue, for both oil and natural gas.

2. Declining Net Energy. EROEI is closely related to “Net Energy,” which is the amount of usable energy that is left after deducting the energy that it takes to make energy. When net energy decreases, we have less energy to run society, making it difficult to do things like maintain bridges and roads, and fund schools.

What did M. King Hubbert Say?

M. King Hubbert in various papers such as these (195619621976) talked about a world in which other fuels took over, long before fossil fuels encountered problems with short supply.

In such a world, there would be plenty of net energy from alternative fuels to run society. Because of this, even if fossil fuels ran low, it would be easy to maintain the economy’s infrastructure, without disruption. In Hubbert’s 1962 paper, Energy Resources – A Report to the Committee on Natural Resources, Hubbert writes about the possibility of having so much cheap energy that it would be possible to essentially reverse combustion–combine lots of energy, plus carbon dioxide and water, to produce new types of fuel plus water. If we could do this, we could solve many of the world’s problems–fix our high CO2 levels, produce lots of fuel for our current vehicles, and even desalinate water, without fossil fuels.

He also showed this figure in his 1956 paper:

In this figure, most of the additional energy comes from nuclear energy, while a smaller amount comes from “solar” energy. By solar energy, Hubbert would seem to mean solar, wind, tidal, wood, biofuels, and other energy we get on a day-to-day basis, indirectly from the sun. His figure seems to suggest that solar energy would basically act as a fossil fuel extender, and would not last beyond the time fossil fuels last. The primary long-term source of energy would be nuclear.

In such a world, applying Hubbert’s Curve to world oil supply would make perfect sense, because there would be plenty of other energy, to provide the energy needed to keep up the infrastructure needed to main extraction of oil, gas, and other fuels as long as they were available. Even liquid fuels and pollution wouldn’t be a problem, if they could be manufactured synthetically.

Another Approach to Forecasting Future Oil Supply: Limits to Growth Type Modeling

Another approach estimating the shape of the decline curve is applying modeling techniques, such as used in the 1972 book Limits to Growth by Donella Meadows et al. The factors in this model were population, food per capita, industrial output, pollution, and resources. Resources were modeled in total — oil wasn’t separated from other types of resources. 24 scenarios were run. The base scenario suggested that the world would start hitting resource limits about now (plus or minus 10 or 20 years). There have been several analyses regarding how this model is faring, and the conclusion seems to be that it is more or less on track. This is a link to such an analysis by Charles Hall and John Day.

With this type of model, according to Limits to Growth (p. 142), “The basic mode of the world system is exponential growth of population and capital, followed by collapse.” This type of decline would seem to be substantially faster than the decline predicted by the Hubbert Curve.

The Limits to Growth model leaves out our debt-based financial system. Since so much capital is borrowed in today’s world, it seems like including such a variable would tend to make the system even more “brittle”, and perhaps move up the date when collapse occurs.

Demand for Oil (or other Fossil Fuels)

Even if there is plenty of high-priced oil extracted from the ground, if potential buyers cannot afford it, there can be a problem, leading to a decline in oil production. Demand can be thought of as the willingness and ability to purchase oil products. Many people would like to have gasoline for their cars, but if they are unemployed, or have a part-time minimum wage job, they are likely not to have enough money to buy very much.

US energy consumption in general, and oil consumption in particular, has been relatively flat in the 2000-2009 period, and declining at the end of that period, indicating low demand. Prior to this period, it was rising.  More or less the reverse has happened in China and India. Growth in oil use and energy products in general was moderate prior to 2000, but increased rapidly after 2000.

When we look at the percentage of the US population that is employed (Figure 9), it has been decreasing since 2000, so there are fewer people earning wages, and thus able to buy oil and other products. Prior to 2000, the percentage of the US population working was increasing.

In fact, over time, in the US, there is a high correlation between number of people employed and amount of oil consumed.

This high correlation is not surprising for two reasons: (1) jobs very often involve often use oil in producing or shipping goods, and because (2) people who are earning a salary can afford to buy goods and services that use oil.


Posted in EROEI remaining oil too low, Gail Tverberg, Oil Shocks | Comments Off on Gail Tverberg on why Oil Decline will be FAST

External costs of coal: probably over $500 billion per year in USA

Paul R. Epstein, et al. 2011. Full cost accounting for the life cycle of coal in “Ecological Economics Reviews.” Robert Costanza, Karin Limburg & Ida Kubiszewski, Eds. Ann. N.Y. Acad. Sci. 1219: 73–98.

This paper tabulates a wide range of costs associated with the full life cycle of coal, separating those that are quantifiable and monetizable; those that are quantifiable, but difficult to monetize; and those that are qualitative.

Our comprehensive review finds that the best estimate for the total economically quantifiable costs, based on a conservative weighting of many of the study findings, amount to some $345.3 billion, adding close to 17.8¢/kWh of electricity generated from coal. The low estimate is $175 billion, or over 9¢/kWh, while the true monetizable costs could be as much as the upper bounds of $523.3 billion, adding close to 26.89¢/kWh.

These and the more difficult to quantify externalities are born by the general public.

These figures do not represent the full societal and environmental burden of coal. In quantifying the damages, we have omitted:

  1. impacts of toxic chemicals and heavy metals on ecological systems, plants and animals
  2. many of the long-term impacts on the physical and mental health of those living in coal-field regions and nearby MTR sites
  3. The direct risks and hazards posed by sludge, slurry, and CCW impoundments;
  4. The full contributions of nitrogen deposition to eutrophication of fresh and coastal sea water
  5. The prolonged impacts of acid rain and acid mine drainage;
  6. the full assessment of impacts due to an increasingly unstable climate.

The true ecological and health costs of coal are thus far greater than the numbers suggest.

Below are some excerpts from this 26 page paper of some of the external costs:

With 70% of U.S. rail traffic devoted to transporting coal, there are strains on the railroad cars and lines, and (lost) opportunity costs, given the great need for public transport throughout the nation. There are direct hazards from transport of coal. People inmining communities report that road hazards and dust levels are intense. In many cases dust is so thick that it coats the skin, and the walls and furniture in homes. This dust presents an additional burden in terms of respiratory and cardiovascular disease.

Coal mining and combustion releases many more chemicals than those responsible for climate forcing.

Coal also contains mercury, lead, cadmium, arsenic, manganese, beryllium, chromium, and other toxic, and carcinogenic substances. Coal crushing, processing, and washing releases tons of particulate matter and chemicals on an annual basis and contaminates water, harming community public health and ecological systems. Coal combustion also results in emissions of NOx, sulfur dioxide (SO2), the particulates PM10 and PM2.5, and mercury; all of which negatively affect air quality and public health.

Chemicals in the waste stream include ammonia, sulfur, sulfate, nitrates, nitric acid, tars, oils, fluorides, chlorides, and other acids and metals, including sodium, iron, cyanide, plus additional unlisted chemicals.

Emissions and seepage of toxins and heavy metals into fresh and marine water were significant. Elevated levels of arsenic in drinking water have been found in coal mining areas, along with ground water contamination consistent with coal mining activity in areas near coal mining facilities.

In 2005, coal was responsible for 82% of the U.S.’s GHG emissions from power generation.

In one study of drinking water in 4 counties in West Virginia, heavy metal concentrations (thallium, selenium, cadmium, beryllium, barium, antimony, lead, and arsenic) exceeded drinking water standards in 25% of homes.

Of the emissions of carcinogens in the life cycle inventory (inventory of all environmental flows) for coal-derived power, 94% were emitted to water, 6% to air, and 0.03% were to soil, mainly consisting of arsenic and cadmium.

Ecological impacts

Appalachia is a biologically and geologically rich region, known for its variety and striking beauty. There is loss and degradation of habitat from MTR; impacts on plants and wildlife (species losses and species impacted) from land and water contamination, and acid rain deposition and altered stream conductivity; and the contributions of deforestation and soil disruption to climate change. Globally, the rich biodiversity of Appalachian head water streams is second only to the tropics. For example, the southern Appalachian mountains harbor the greatest diversity of salamanders globally, with 18% of the known species world-wide

Acid precipitation

In addition to the health impacts of SO2, sulfates contribute to acid rain, decreased visibility, and have a greenhouse cooling influence.  The long-term Hubbard Brook Ecosystem Study104 has demonstrated that acid rain (from sulfates and nitrates) has taken a toll on stream and lake life, and soils and forests in the United States, primarily in the Northeast. The leaching of calcium from soils is widespread and, unfortunately, the recovery time is much longer than the time it takes for calcium to become depleted under acidic conditions.

Mercury

Coal combustion in the U.S. releases approximately 48 tons of the neurotoxin mercury each year. The most toxic form of mercury is methylmercury, and the primary route of human exposure is through consumption of fin and shellfish containing bioaccumulated methylmercury. Methylmercury exposure, both dietary and in utero through maternal consumption, is associated with neurological effects in infants and children, including delayed achievement of developmental milestones and poor results on neurobehavioral tests—attention, fine motor function, language, visual-spatial abilities, and memory. Seafood consumption has caused 7% of women of childbearing age to exceed the mercury reference dose set by the EPA, and 45 states have issued fish consumption advisories.

Direct costs of mercury emissions from coal-fired power plants causing mental retardation and lost productivity in the form of IQ detriments were estimated by Trasande et al. to be $361.2 million and $1.625 billion, respectively, or 0.02¢/kWh and 0.1¢/kWh, respectively. Low-end estimates for these values are $43.7 million and $125 million, or 0.003¢/kWh and 0.007¢/kWh; high-end estimates for these values are $3.3 billion and $8.1 billion, or 0.19¢/kWh and 0.48¢/kWh.

There are also epidemiological studies suggesting an association between methylmercury exposure and cardiovascular disease.


Posted in Chemicals, CO2 and Methane, Coal, Hazardous Waste, Water Pollution | Comments Off on External costs of coal: probably over $500 billion per year in USA

Feedback Loops


1) Feedback loops that lead to oil prices drop below the cost of production

Oil price rises or spikes from blockage of straits of hormuz, exports decline (ELM), Saudi Arabia and/or Middle Eastern high decline rates,  China and India can afford high prices more than developed world can, etc.

Consumers can’t afford this price

Oil price falls to lower than the cost of extraction, especially where the cost is high like the US and Canada

Oil exporters suffer because they can’t collect the revenue they were depending on

Which leads to uprisings in the Middle East and elsewhere

Artificially low interest rates go away

Tax rates rise

Oil falls in value as do other asset prices (stocks, bonds, homes)


Posted in 3) Fast Crash, Oil Shocks | Comments Off on Feedback Loops

Iran succeeds in reducing birth rate without coercion

How Iran Became One of the World’s Most Futuristic Countries 

May 2, 2014  Annalee Newitz

In Iran, during the 1980s conflict with Iraq, the Ayatollah Khomeini instituted new government regulations that encouraged women to have as many children as they could to build a “Twenty Million Man Army.” As a result, Iran’s population grew from 37 million people in 1979, to 50 million in 1986. This was, according to journalist Alan Weisman, “the highest rate of population increase the world had ever seen.”

Weisman, the author of The World Without Us, writes about Iran’s incredible growth in his recent book about overpopulation, called Countdown. By the end of the 1980s, government workers in Iran’s budget office realized that the nation was headed for a major economic crisis, not to mention a resource crisis. The booming population was set to outstrip the country’s resources. But after a series of secret meetings with the Ayatollah, a group of demographers, budget experts, and the health minister managed to convince their leader that something needed to be done, and it had to be done fast. Related from amazon Countdown: Our Last, Best Hope for a Future on Earth?

They needed to bring Iran’s population back down to manageable levels. And so, after the war ended in 1988, the Ayatollah gave his blessing to Iran’s Ministry of Health to set up a family planning program that would revolutionize his country.

It started with a slogan: “One is good. Two is enough.” This became the rallying cry in mosques, and in the many family planning clinics set up by the Ministry of Health. Workers with the Ministry, many of them women, were dispatched to every city in Iran, as well as even the tiniest villages. They had one mandate, which was to offer free contraception — from condoms to sterilization procedures — to any person who wanted them.

Nobody was forced to use contraceptives, nor were there any limits placed on how many children people could have. But women flocked to the health care workers. Battered by the war, facing economic hardships, most women opted to be sterilized after having two children. Others wanted to continue their educations after being exposed to the family planning classes offered in local healthcare centers. More and more women learned to read, and more went off to college. By 2012, 96 percent of women in Iran could read — up from about 33 percent in 1975. And at least a third of government workers were women.

Best of all, the population growth had reversed. In 2000, Iran’s birthrate reached replacement levels of 2.1 children per woman. In 2012, the average woman had 1.7 children. After checking on these numbers using an independent group of demographers, the UN was so impressed that Iran’s health minister was awarded a United Nations Population Award.

Even when a new government regime came to power in Iran, and tried to roll back these healthcare policies, the population numbers continued to drop down to sustainable levels. Too many women had become educated and entered the workforce — it was impossible to restart the policies that led to the baby explosion of the 1980s.

Regardless of what happens next, we have evidence that in one generation, a large and religious country like Iran was able to lower its rate of population growth tremendously. And it was accomplished using one, simple technology: Contraception. That, coupled with family planning education, reversed their runaway population growth.

If we want to avoid an environmental crisis by lowering the world’s population, we now have good evidence that it can be done without coercion. All we have to do is make contraception freely available to anyone who wants it. That may prove to be a lot cheaper in the long run than trying to find those 30 terawatts of power year after year.

Posted in Population | Tagged , , | Comments Off on Iran succeeds in reducing birth rate without coercion

Exporting Natural Gas from America

We don’t have the natural gas to export as you can see in Shale Oil and Gas Will Not Save Us.

Nonetheless, it looks like we may be exporting it.

Matt Simmons, a financier of very large energy projects thinks that LNG is a good way to go bankrupt. He said that “The cost to produce and distribute LNG is so high that to make LNG work in any sort of financial reality, you would need a 25- or 30-year guaranteed supply. And then you can amortize it over 25 or 30 years. If you’re going on a spot supply, you’ve got to write it off over 10 years and then you’ll need $40 per million BTU to make the economics work. The other thing is that about 35% of the hydrocarbon value gets chewed up in the process of cryogenically freezing natural gas, transporting it, and then re-gassing it.”

Ugo Bardi writes in his book “How the Quest for Mineral Wealth Is Plundering the Planet” The problem is that storing natural gas requires heavy, expensive pressurized vessels, and transporting it requires complex and expensive infrastructure. On land gas is transported through a network of pipelines. To travel by sea, gas must undergo cryogenic liquefaction to obtain a sufficiently high-energy-density liquid (liquefied natural gas, or LNG) for transportation in special refrigerated tankers. These methods are far from being satisfactory: pipelines cannot cross oceans, and cryogenic transportation is expensive. So gas remains mainly a regional resource, and it makes little sense to speak of a global production peak for gas in the same way we would for oil.

De Aenlle, C. Oct 7, 2014. One key to exports: Liquid Gas. New York Times.

The Energy Department forecasts shipments abroad of liquefied natural gas equivalent to two trillion cubic feet by 2020, roughly 7 percent of expected domestic production.

There are various benefits to shrinking gas in an expansive way. One refrigeration unit, called a train, costs $2 billion or more. But as a plant installs more trains (so called because they are narrow and tend to be arranged sequentially), they become cheaper because the high cost of planning, engineering and construction is spread out over more units, and supplies can be sourced cheaper in larger quantities. The cost to build other parts of liquefaction facilities — storage tanks, jetties where ships are loaded, the initial planning, site preparation and so forth — is also spread out.

The compressors that liquefy gas run on gas themselves. A decade ago, about 70 percent of the energy used in the process was lost through heat dissipating into the air, now it’s about 60%.

Cobb, Kurt. Apr 15 2012 by Resource Insights, The dumbest guys in the room: Is Cheniere Energy a contrarian indicator for natural gas? 

The 100-year claim of natural gas supplies derives from an industry estimate of total resources, a significant portion of which will never turn into actual reserves. There is no evidence to suggest that all these resources will be both technically recoverable and economically profitable.

Proven U.S. reserves amount to only 11.5 years of consumption at 2010 rates. If we include proven and probable reserves, the number is 22 years, hardly a figure that inspires confidence that there will be adequate supplies available for export in the coming decades. In the same linked piece author Art Berman, a petroleum geologist and consultant who has carefully studied the state data for U.S. natural gas production, concludes that all major natural gas producing areas except Louisiana appear to be peaking in their rate of production. These include “Texas, Louisiana, Wyoming, Oklahoma, Gulf of Mexico Outer Continental Shelf, and New Mexico [which] account for roughly 75% of U.S. natural gas supply and, therefore, provide a useful proxy for total U.S gas production.”

It is worth quoting Berman at length to get the flavor of his analysis:

For several years, we have been asked to believe that less is more, that more oil and gas can be produced from shale than was produced from better reservoirs over the past century. We have been told more recently that the U.S. has enough natural gas to last for 100 years. We have been presented with an improbable business model that has no barriers to entry except access to capital, that provides a source of cheap and abundant gas, and that somehow also allows for great profit. Despite three decades of experience with tight sandstone and coal-bed methane production that yielded low-margin returns and less supply than originally advertised, we are expected to believe that poorer-quality shale reservoirs will somehow provide superior returns and make the U.S. energy independent. Shale gas advocates point to the large volumes of produced gas and the participation of major oil companies in the plays as indications of success. But advocates rarely address details about profitability and they never mention failed wells.

Shale gas plays are an important and permanent part of our energy future. We need the gas because there are fewer remaining plays in the U.S. that have the potential to meet demand. A careful review of the facts, however, casts doubt on the extent to which shale plays can meet supply expectations except at much higher prices.

The entire piece should be required reading for anyone involved in energy policy or who is thinking about investing in anything related to natural gas. The upshot for investors is that natural gas prices are likely to recover much sooner than most analysts are predicting. Gas rig counts in North America tumbled from 906 during the first week of November to 624 last week. This is the lowest number of gas rigs deployed since 2002. As the count continues to fall, new production capacity will slip in the face of a 32 percent annual production decline rate. That’s not a typo.

The U.S. must now replace one-third of its natural gas production capacity each year just to stay even. Shale gas wells contribute to much of the problem with a first-year decline averaging 65 percent and a two-year decline rate around 80 percent.

The rotary drills will only return to the shale gas fields when prices reach levels that are actually profitable which Berman estimates to be at least $4 per mcf for existing plays and up to $9 per mcf for some new ones. What this implies is much slower growth in supplies, something anticipated by the U.S. Energy Information Administration in its 2012 Annual Energy Outlook which projects that natural gas production will rise from 24.2 trillion cubic feet (tcf) in 2011 to 27.7 tcf in 2035, hardly a bonanza. Still, the EIA buys into the idea that the United States will become a net exporter of gas in 2021.

But Berman is skeptical believing that shale gas supplies will prove so challenging to extract that the country will find itself importing natural gas for a long time to come. If that’s so, then we can look at Cheniere’s decision to build natural gas export terminals as the perfect contrarian sign that U.S. natural gas prices are nearing their lows and will rise in the years to come.

The U.S. Congress and federal regulators may yet rue the day that they approved natural gas export terminals. Since such terminals typically enter into multi-decade contracts to ensure that they can recoup their costs, natural gas may be going out of the country just when domestic supplies are needed the most.

Cheniere expects its liquefaction plant, which liquefies natural gas by cooling it to -260 degrees F, to start operating in 2015. If that year marks the beginning of a sustained climb in U.S. natural gas prices brought on by increasing strains on domestic supplies, Cheniere will retain its usefulness as a contrary indicator. Increasingly expensive domestic gas may then result in small profit margins or even losses for exporters such as Cheniere. Between now and then, however, the hype surrounding U.S. natural gas supplies and LNG exports may help enrich a few Cheniere investors who are savvy enough to cash out before reality catches up with the company’s stock price.


Posted in Natural Gas | Comments Off on Exporting Natural Gas from America

Other booklists

The Biophysical Economics Policy Center booklist from 1926 to present

Books

John Howe

  • Astyk, S. (2008) “Depletion and Abundance, Life On the New Home Front.”
  • Bartlett, A. (2004) “The Essential Exponential, For the Future of Our Planet.”
  • Bligh, J. (2004) “The Fatal Inheritance.”
  • Brown, L. (2008) “Plan B 3.0, Mobilizing To Save Civilization.”
  • Brown, L.(2011) “World on Edge, How to Prevent Environmental and Economic Collapse.”
  • Bardi, U. (2011) “The Limits To Growth Revisited.”
  • Berry, W. (1977) “The Unsettling of America, Culture and Agriculture.”
  • Boughey, A. (1976) “Strategy for Survival, An Exploration of the Limits to Further Population and Industrial Growth.”
  • Baker, C. (2009) “Sacred Demise, Walking the Spiritual Path of Ind. Civilization’s Collapse.”
  • Campbell, C. (1997) “The Coming Oil Crisis.”
  • Campbell, C. (2003) “The Essence of Oil& Gas Depletion.”
  • Catton, W. (1982) “Overshoot, The Ecological Basis of Revolutionary Change.”
  • Carroll, J. (1997) “The Greening of Faith, God, the Environment, and the Good Life.”
  • Carr-Saunders, A. (1922) “The Population Problem, A Study in Human Evolution.”
  • Cipolla, C. (1978) “The Economic History of World Population.”
  • Cohen, J. (1995) “How Many People Can the Earth Support”?
  • Cobb, K. (2010) “Prelude, A Novel About Secrets, Treachery, and the Arrival of Peak Oil.”
  • Cooke, R. (2007) “Detensive Nation, Redefining the Role Government.”
  • Cribb, J. (2010) “The Coming Famine, the Global Food Crisis and What We Can Do.”
  • Czech, B. (2000) “Fuel for a Runaway Train, Errant Economists, Shameful Spenders, and a Plan To Stop Them All.”
  • Daly, H. (1996) “Beyond Growth.”
  • Deffeyes, K. (2001) “Hubbert’s Peak, The Impending World Oil Shortage.”
  • Deffeyes, K. (2005) “Beyond Oil, The View From Hubbert’s Peak.”
  • Deffeyes, K. (2010) “When Oil Peaked.”
  • Diamond, J. (2005) “Collapse, How Societies Choose to Fail or Succeed.”
  • Dawkins, R. (2006) “The Selfish Gene, 30th Anniversary edition.”
  • Douthwaite, R. (1992) “The Growth Illusion, How Economic Growth has Enriched the Few, Impoverished the Many, and Endangered the Planet.”
  • Douthwaite, R. (2011) “Fleeing Vesuvius, Overcoming the Risks of Economic and Environmental Collapse.”
  • Erlich, P. (1971) “The Population Bomb.”
  • Fletcher, S. (2011) “Bottled Lightning, Super Batteries, Electric Cars, and the New Lithium Economy.”
  • Gelbspan, R. (2004) “Boiling Point.”
  • Grant, L. (2000) “Too Many People, The Case for Reversing Growth).
  • Grant, L.(2005) “The Collapsing Bubble, Growth and Fossil Energy.”
  • Greer, J. (2008) “The Long Descent.”
  • Greer, J. (2009) “The Ecotechnic Future, Envisioning a Post-Peak World.”
  • Grover, J. (1991) “Beyond Oil, the Threat to Food and Fuel.”
  • Hardin. G. (1993) “Living Within Limits, Ecology, Economics, and Population Taboos.”
  • Hardin, G (1998) “The Ostrich Factor, Our Population Myopia.”
  • Hartmann, T. (1998) “The Last Hours of Ancient Sunlight.”
  • Heinberg, R. (2004) “Power Down, Options and Actions for a Post-Carbon World.”
  • Heinberg, R. (2005) “The Party’s Over, Oil, War, and the Fate of Industrial Societies.”
  • Heinberg, R. (2007) “Peak Everything, Waking Up to the Century of Declines.”
  • Heinberg, R. (2006) “The Oil Depletion Protocol, a Plan to Avert Oil Wars, Terrorism, and Economic Collapse.”
  • Heinberg, R. (2010) “Post Carbon Reader, Managing the 21st Century’s Crisis.”
  • Heinberg, R. (2011) “The End of Growth, Adapting to Our New Economic Reality.”
  • Hopkins, R. (2008) “The Transition Handbook, From Oil Dependency to Local Resil.”)
  • Howe, J. (2006) “The End of Fossil Energy, and Last Chance for Survival.” (3rd Ed.)
  • Kunstler, J. (2005) “The Long Emergency, Surviving the Converging Catastrophes of the Twenty-First Century.”
  • Laslo, E. (2006) “Global Survival, the Challenges and its Implications for Thinking and Acting.”
  • Magdoff, F. (2010) “Agriculture and Food in Crisis, Conflict, Resistance, and Renewal.”
  • Malthus, T. (1798) “An Essay on the Principle of Population.”
  • Martinson, C. (2011) “The Crash Course, The Unsustainable Future of the Economy, Energy, and Environment.”
  • Mesarovic, M. (1974) “Mankind at the Turning Point, the Second Report to the Club of Rome.”
  • McKibbon, W. (1998) “Maybe One, a Personal and Environmental Argument for Single-Child Families.”
  • Meadows, D. (1972) “The Limits to Growth.”
  • Meadows, D. (2004) “Limits To Growth, The 30-Year Update.”
  • Orlov, D. (2008) “Reinventing Collapse, The Soviet Example and American Prospects.”
  • Pimentel, D. (1996) “Food, Energy, and Society.”
  • Pfeiffer, D. (2003) “The End of the Oil Age.”
  • Ponting, C. (1991) “ A Green History Of the World”
  • Roberts, P. (2009) “The End of Food.”
  • Roberts, P. (2004) “The End of Oil, On the Edge of a Perilous New World.”
  • Romm, J. (2004) “The Hype About Hydrogen.”
  • Rothkrug, P. (1991) “Mending The Earth, A World For Our Grandchildren.”
  • Ruppert, M. (2009) “Collapse, The Crisis of Energy and Money in a Post Peak Oil World.”
  • Seidel, P. (1998) “Invisible Walls, Why We Ignore the Damage We Inflict on the Planet.”
  • Simmons, M. (2005) “Twilight in the Desert, the Coming Saudi Oil Shock and the World Economy.”
  • Scheer, H. (1999) “The Solar Economy, Renewable Energy for a Sustainable Global Future.”
  • Smil, V (1999) “Energies, an Illustrated Guide to the Biosphere and Civilization.”
  • Smil, V. (2005) “Energy At The Crossroads.”
  • Stanton, W. (2003) “The Rapid Growth Of Human Populations.”
  • Tainter, J. (1988) “The Collapse of Complex Societies.”
  • Weeks, J. (2005) “Population, an Introduction to Concepts and Issues.”
  • Wilkinson, R.(1973) “Poverty and Progress.”
  • Wilson, E. (2002) “The Future of Life.”
  • Young, L. (1968) “Population in Perspective.”
  • Youngquist, W. (1997) “Geodestinies, the Inevitable Control of Earth Resources Over Nations and Individuals.”
Posted in Other Lists | Comments Off on Other booklists

Chinese Economy Hits the Wall

June 10, 2012 The Macroeconomics of Chinese kleptocracy

by John at Bronte Capital
China is a kleptocracy of a scale never seen before in human history. This post aims to explain how  this wave of theft is financed, what makes it sustainable and what will make it fail.  The macroeconomic effects of the Chinese kleptocracy and the massive fixed-currency crisis in Europe are the dominant macroeconomic drivers of the global economy.

China is a kleptocracy — a country ruled by thieves

(a) The children and relatives of CPC Central Committee members are amongst the beneficiaries of the wave of stock fraud in the US,(b) The response to the wave of stock fraud in the US and Hong Kong has not been to crack down on the perpetrators of the stock fraud (to make markets work better). It has been to make Chinese statutory accounts less available to make it harder to detect stock fraud.

(c) When given direct evidence of fraudulent accounts in the US filed by a large company with CPC family members as beneficiaries or management a big 4 audit firm will (possibly at the risk to their global franchise) sign the accounts knowing full well that they are fraudulent. The auditors (including and arguably especially the big four) are co-opted for the benefit of Chinese kleptocrats.

This however is only the beginning of Chinese fraud. China is a mafia state – and Bo Xilai is just a recent public manifestation. If you want a good guide to the Chinese kleptocracy – including the crimes of Bo Xilai well before they made the international press look at this speech by John Garnaut to the US China Institute.

China has huge underlying economic growth from moving peasants into the modern economy

Every economy that has moved peasants to an export-orientated manufacturing economy has had rapid economic growth. Great Britain industrialized at about 1% a year.  Later economies (eg Japan, Malaysia, Thailand, Korea) went faster. As a general rule the later you industrialized the faster you went – as the ease of copying went up. In the globalized internet age copying foreign manufacturing techniques and seeking global markets is easier than ever – so China is growing faster than any prior economy.  This fast economic growth – which would happen in a more open economy – is creating the fuel for the Chinese kleptocracy.

The one-child policy drives massive savings rates

The other key fuel for kleptocracy is a copious supply of domestic savings to loot. The reason Chinese savings levels are so high is the one-child policy. Longevity in China is increasing rapidly and the one-child policy results in a grandchild potentially having four grandparents to look after. The “four grandparent policy” means the elderly cannot expect to be looked after in old age.  Nor can the elderly rely on a welfare state to look after them. There is no welfare state.So the Chinese save. Unless they save they will starve in old age. This has driven savings levels sometimes north of 50% of GDP. Asian savings rates have been high through all the key industrializations (Japan, Korea, Singapore etc). However Chinese savings rates are over double other Asian savings rates – this is the highest savings rate in history and the main cause is the one-child policy.

Low and middle income Chinese have very limited savings options

The Chinese lower income and middle class people have extremely limited savings options. There are capital controls and they cannot take their money out of the country.  So they can’t invest in any foreign assets.  Their local share market is unbelievably corrupt. I have looked at many Chinese stocks listed in Shanghai and corruption levels are similar to Chinese stocks listed in New York. Expect fraud.What Chinese are left with is bank deposits, life insurance accounts and (maybe) apartments.

Bank deposits and life insurance as a savings mechanism in China

Bank deposits rates are regulated. You can’t get much different from 1% in a bank deposit. Life insurance contracts (a huge savings mechanism) are just rebadged bank deposits – attractive because the regulated rate is slightly higher.This is a lousy savings mechanism because inflation has been between 6-8%. At almost all times (except during the height of the GFC) the inflation rate has been higher – often substantially higher – than the regulated bank deposit (or life insurance contract) rate.

In other words real returns for bank accounts are consistently negative – sometimes sharply negative.  You might ask why people save with sharply negative returns. But then you are not facing starvation in your old age because of the “four grandparent policy”. Moreover because of the underlying economic growth (moving peasants into a manufacturing economy) there are increasing quantities of these savings every year. This is the critical point – the negative return to copious and increasing Chinese bank deposits drives a surprising amount of the global economy and makes sense of many things inside and outside China.

The Chinese property market as a savings mechanism

Chinese people have very few savings mechanisms. The major ones (bank deposits and their life-insurance contract twins) have sharp and consistently negative real returns.  Beyond that they have property.Bank deposits have sometimes 5% negative returns. If you got 1% negative returns from  property – well – you would be doing well. Buying an empty apartment and leaving it empty will do fine provided you can sell the property at some stage in the future. It is commonplace amongst Western investors to view the see-through apartment buildings of China as insane. And they may be a poor use of capital. But from the perspective of the investors they look better than bank deposits.

Negative returns on bank deposits and the Chinese kleptocracy

Most Chinese savings are not invested in see-through apartment buildings. Bank deposits still dominate. The Chinese banks are the finest deposit franchises in human history. They can borrow huge amounts at ex-ante negative real returns.And those deposits are mostly lent to State Owned enterprises.  The SOEs are the center of the Chinese kleptocracy. If you manage your way up the Communist Party of China and you play your politics really well may wind up senior in some State Owned Enterprise. This is your opportunity to loot on a scale unprecedented in human history.

Us Westerners see the skimming arrangements. If you want to sell something to the Chinese SOE you don’t sell it to them. You sell it to an intermediate company who sell it in China. From the Western perspective you pay a few percent for access. From the Chinese perspective – this is just a gentle form of looting.

And it is not the only one. The SOEs are looted every way until Tuesday. The Business insider article on the spending at Harbin Pharmaceutical is just a start. The palace pictured in Business Insider would make Louis XIV of France (the Sun King) proud. This palace shows the scale (and maybe the lack of taste) of the Chinese kleptocracy.

A normal business – especially a State Owned dinosaur run by bureaucrats – would collapse under this scale of looting. But here is the key: the Chinese SOEs are financed at negative real rates.   A business – even a badly run business – can stand a lot of looting if it is (a) large and (b) funded at negative real rates.   Those negative real rates are only possibly because there are copious bank deposits available at negative real rates to State controlled banks.

The cost of funds in China and the willingness to hold foreign bonds

The Chinese Government (and the banks are part of the government even though they are listed) has access to seemingly unlimited bank deposits at negative real costs.   When you have copious funds at a negative cost a lot of investments that look stupid under some circumstances suddenly look sensible. US Treasuries look just fine. Don’t think the Chinese are going to stop holding Treasuries. The Treasuries yield far more than they pay the peasants. The Chinese make a positive arbitrage on holding low rate US bonds.

Monetary threats to the Chinese establishment

The Chinese kleptocracy – and indeed several major trends in the global economy – depend on copious quantities of savings at negative expected rates of return by middle and lower income Chinese.There are two core threats to this system – one widely discussed – one undiscussed.

Inflation (widely discussed) is known to produce riots and demonstrations in China – and is considered by Westerners to be bad news for the Chinese establishment. And there are good reasons why the Chinese riot with inflation – the poor who save because they are going to starve – get their savings taken away from them.

But ultimately the Chinese establishment like inflation – it is what enables their thievery to be financed.

The more serious threat is deflation – or even inflation at rates of 1-3%. If inflation is too low then the SOEs – the center of the Chinese kleptocratic establishment will not generate enough real profit to sustain the level of looting. These businesses can be looted at a negative real funding rate of 5 percent. A positive real funding rate – well that is a completely different story.

The real threat to the Chinese establishment is that the inflation rate is falling – getting very near to the 1-3 percent range.

Low Chinese inflation rates will mean reasonable returns on savings for Chinese lower and middle income savers. Good news for peasants perhaps.

But that changing division of the spoils of economic progress will destroy the Chinese establishment (an establishment that relies on a peculiar and arguably unfair division of the spoils). The SOEs will not be able to pay positive real returns to support that new division of spoils. The peasants can only receive positive real returns if the SOEs can pay them – and paying them is inconsistent with looting.

If the SOEs cannot pay then the banks are in deep trouble too.

All because the inflation rate is dropping. Maybe they can stop it dropping. The Chinese establishment has a vested interest in getting the inflation rate up in China. Because if they don’t all hell will break loose.

Unless the Chinese can get the inflation rate up expect a revolution.

Chinese government debt

A financial crisis in China could be another reason for the market to change direction. Even after the recent surge in local government debt, China’s total government debt is a modest 53% of gross domestic product. Still, the central bank’s efforts to contain the explosive growth of the shadow-banking system may not work. The leap in short-term rates to 30% in June could be a warning sign (Gary Shilling: How to prepare your portfolio for the next market shock. March 11, 2014. Bloomberg news).

Other articles
Oct 26, 2012 Brother Wristwatch and Grandpa Wen: Chinese Kleptocracy.  Evan Osnos.  the New Yorker

Problem no. 1: slowing growth. From Reuters:China Growth May Dip Below 7%: Government Adviser

Problem no. 2: falling inflation. From Zarathustra at Also Sprach Analyst:China’s inflation fell to 3.0% yoy in May 2012

Problem no. 3: liquidity. Zarathustra again:Credit Suisse: China is in a liquidity trap

Problem no. 4: money supply. And there we get to our definition of inflation: as shrinking money supply and velocity of money. Ambrose Evans-Pritchard: Global slump alert as world money contracts


Posted in Crash Coming Soon | Comments Off on Chinese Economy Hits the Wall

California Shale Oil & Gas

US officials cut estimate of recoverable Monterey Shale oil by 96%

Sahagun, L. May 21, 2014. Los Angeles Times.

Federal energy authorities have slashed by 96% the estimated amount of recoverable oil buried in California’s vast Monterey Shale deposits, deflating its potential as a national “black gold mine” of petroleum.

Just 600 million barrels of oil can be extracted with existing technology, far below the 13.7 billion barrels once thought recoverable from the jumbled layers of subterranean rock spread across much of Central California, the U.S. Energy Information Administration said.

The new estimate, expected to be released publicly next month, is a blow to the nation’s oil future and to projections that an oil boom would bring as many as 2.8 million new jobs to California and boost tax revenue by $24.6 billion annually.

The Monterey Shale formation contains about two-thirds of the nation’s shale oil reserves. It had been seen as an enormous bonanza, reducing the nation’s need for foreign oil imports through the use of the latest in extraction techniques, including acid treatments, horizontal drilling and fracking.

The energy agency said the earlier estimate of recoverable oil, issued in 2011 by an independent firm under contract with the government, broadly assumed that deposits in the Monterey Shale formation were as easily recoverable as those found in shale formations elsewhere.

Major oil companies have expressed doubts for years about recovering much of the oil.

The problem lies with the geology of the Monterey Shale. Unlike heavily fracked shale deposits in North Dakota and Texas, which are relatively even and layered like a cake, Monterey Shale has been folded and shattered by seismic activity, with the oil found at deeper strata.

Geologists have long known that the rich deposits existed but they were not thought recoverable until the price of oil rose and the industry developed acidization, which eats away rocks, and fracking, the process of injecting millions of gallons of water laced with sand and chemicals deep underground to crack shale formations.

The new analysis from the Energy Information Administration was based, in part, on a review of the output from wells where the new techniques were used.

“From the information we’ve been able to gather, we’ve not seen evidence that oil extraction in this area is very productive using techniques like fracking,” said John Staub, a petroleum exploration and production analyst who led the energy agency’s research.

“Our oil production estimates combined with a dearth of knowledge about geological differences among the oil fields led to erroneous predictions and estimates,” Staub said.


Sep 22, 2013. Oil Firms Seek to Unlock Big California Field Geology is a challenge in the Monterey Shale. Wall Street Journal.

California’s Monterey Shale formation is estimated to hold as much as two-thirds of the recoverable onshore shale-oil reserves in the U.S.’s lower 48 states, but there’s a catch: It is proving very hard to get.

Formed by upheaval of the earth, the Monterey holds an estimated 15.4 billion barrels of recoverable shale oil, or as much as five times the amount in North Dakota’s booming Bakken Field, according to 2011 estimates by the Department of Energy.

The problem is, the same forces that helped stockpile the oil have tucked it into layers of rock seemingly as impenetrable as another limiting factor: California’s famously rigid regulatory climate.

Fracking is more difficult to do in the Monterey because the formation is so jumbled, says Amy Myers Jaffe, executive director of energy and sustainability at the University of California, Davis. That makes it hard to find large amounts of shale to frack, industry officials say.  “The technical challenges are such that it makes it more expensive to frack in California,” Ms. Jaffe says.

So far, there have been no production breakthroughs.

Chris Martenson:  The summary here is no surprise to me. Whereas the Bakken is a big, flat expanse, unsullied by geological forces over time, the Monterey is in seismically active California and has been stressed and bent and folded and heaved over millions and millions of years. When you are trying to frack oil and gas out of the earth, every fault works against you by bleeding your pressure away. Worse, some fractures connect to other features, complicating the practice of keeping fracking fluids away from water tables. So, for now, the best we can do is place the Monterey on the “maybe” list. But note that it’s certainly no slam-dunk, simple-as-plumbing operation like the earlier storied shale plays.

Andrews, Steve. 29 July 2013. Interview with Martin Payne—Is Peak Oil Dead? ASPO-USA Peak Oil Review.

Steve Andrews: I’ve heard that the Monterey field in California seems to be the one that’s the least ready to give up its very large oil-in-place resource. Do you read it that way?

Martin Payne: The Monterey gets brought up all the time because it has a huge in-the-ground number. It’s another question mark. There’s a good chance the clay content may be the issue. It gets back to the fact that to work, the rock in an unconventional play needs to break like a piece of glass; it needs to be that brittle to work really well. The presence of ductile clay in high percentages prevents that from happening. So with a high clay content you can’t create the necessary spiderweb network of fractures and microfractures to provide exit routes for the oil.

I liken it to a highway system: dirt roads feeding county roads, feeding state highways, feeding interstates that eventually go into 12-lane freeways when you get to downtown…where downtown is the wellbore. You can’t create that underground highway network unless the rock breaks well. I’m pretty sure that’s the problem with the Monterey.

The Conasauga is a quickly forgotten example of a shale gas play that didn’t live up to expectations. There were thousands of feet of low TOC rock, but the bottom line was that due to clay content there wasn’t a way to fracture and keep the rock sufficiently open in order to make the play economic. So even though the numbers were huge on an in-place basis—just like the Monterey, but in gas instead of oil—you couldn’t create the highway system, so it wouldn’t work.


Posted in Oil & Gas Fracked | Comments Off on California Shale Oil & Gas