Oil Crunch 2015: UK Industry Task force on Peak Oil & Energy Security (ITPOES)

Ahmed, N.  28 Mar 2014. Ex govt adviser: “global market shock” from “oil crash” could hit in 2015. The Guardian.

Former oil geologist Dr. Jeremy Leggett, identified 5 “global systemic risks (oil depletion, carbon emissions, carbon assets, shale gas, and the financial sector) directly connected to energy” which, he says, together “threaten capital markets and hence the global economy” in a way that could trigger a global crash sometime between 2015 and 2020. Leggett warns that a wide range of experts and insiders “from diverse sectors spanning academia, industry, the military and the oil industry itself, including the International Energy Agency” are expecting an oil crunch most likely from 2015 to 2020.  If we are correct, and nothing is done to soften the landing, the twenty-first century is almost certainly heading for a depression.”

Leggett also highlights the risk of parallel developments in the financial sector: “Growing numbers of financial experts are warning that failure to rein in the financial sector in the aftermath of the financial crash of 2008 makes a second crash almost inevitable.”

Leggett points to an expanding body of evidence that what he calls “the incumbency” – “most of the oil and gas industries, their financiers, and their supporters and defenders in public service” – have deliberately exaggerated the quantity of fossil fuel reserves, and the industry’s capacity to exploit them. He points to a leaked email from Shell’s head of exploration to the CEO, Phil Watts, dated November 2003: “I am becoming sick and tired of lying about the extent of our reserves issues and the downward revisions that need to be done because of far too aggressive/ optimistic bookings.”

Leggett thus remains highly skeptical that shale oil and gas will change the game. Despite “soaring drilling rates,” US tight oil production has lifted “only around a million barrels a day.” As global oil consumption is at around 90 million barrels a day, with conventional crude depleting “by over 4 million barrels a day of capacity each year” according to International Energy Agency (IEA) data, tight oil additions “can hardly be material in the global picture.” He reaches a similar verdict for shale gas, which he notes “contributes well under 1% of US transport fuel. Shale-gas drilling has dropped off a cliff since 2009. It is only a matter of time now before US shale-gas production falls. This is not material to the timing of a global oil crisis, and questions the existence of a real North American ‘boom’: “How it can be that there is a prolonged and sustainable shale boom when so much investment is being written off in America – $32 billion at the last count?”

In his book, Leggett cites a letter he had obtained in 2004 written by the First Secretary for Energy and Environment in the British embassy in Washington, referring to a presentation on oil supply by the leading oil and gas consulting firm, PFC Energy (now owned by IHS, the US government contractor which also owns Cambridge Energy Research Associates). According to Leggett, the diplomat’s letter to his colleagues in London reads as follows: “The presentation drew some gasps from the assembled energy cognoscenti. They predict a peaking of global supply in the face of high demand by as early as 2015.”

The text of the 2004 letter is corroborated by a 2009 PFC Energy report commissioned by the International Energy Forum which concluded that world conventional oil supply was approaching “peak production, where the petroleum industry’s ability to continue to increase – or even maintain – production of conventional oil (and eventually gas) is constrained…”Exploitation of unconventional oil will provide additional liquids, but in all probability only at increasingly higher costs, and it will depend on significant investments to develop appropriate technologies to convert today’s resources into tomorrow’s reserves. The challenge is coming, and this emerging world of limited conventional production will require major adjustments on the part of both consumers and producers.”

Leggett is now convener of the UK Industry Task Force on Peak Oil and Energy Security (ITPOES) and recently addressed world leaders at the World Economic Forum in Davos about his forecast.

Based on flow rate data, the ITPOES report found that “increases in extraction would be slowing down in 2011–13 and dropping thereafter.” From then on, global oil production would drop “at 1% a year from 2015. If the then IEA forecast of demand rising to 105 million barrels a day in 2030 were to prove correct, supply would fall short in 2015.”

Peak oil does not mean, Leggett insists forcefully, that oil is “running out.” The problem is the increasing costs of extraction and decreasing flow rates of unconventionals: “It will never run out. Oil reserves under the ground, we tried to say, once again, are not the same as oil flows from production pipes at the surface.”

The UK Industry Taskforce’s pinpointing of 2015, Leggett emphasizes throughout his book, is corroborated by forecasts from a range of other agencies, including the US and German militaries.

World faces oil supply crunch by 2015, warn British business leaders

04/24/2013

The world faces an oil supply crunch within the next five years, British business leaders led by Virgin tycoon Richard Branson warned on Wednesday.

The rate at which oil is produced risks hitting a peak by 2015, sparking a surge in crude prices and living costs, said a report from the UK Industry Taskforce on Peak Oil & Energy Security (ITPOES). 

“The UK Industry Taskforce on Peak Oil and Energy Security (ITPOES) finds that oil shortages, insecurity of supply and price volatility will destabilize economic, political and social activity potentially by 2015. The taskforce states the impact of peak oil will include sharp increases in the cost of travel, food, heating and retail goods.”

It finds that the transport sector will be particularly hard hit, with more vulnerable members of society the first to feel the impact. The taskforce warns that the UK must not be caught out by the oil crunch in the same way it was with the credit crunch and states that policies to address peak oil must be a priority for the new government formed after the election. Unless we do so, we face a situation during the term of the next government where fuel price unrest could lead to shortages in consumer products and the UK’s energy security will be significantly compromised.”

Supply-side constraints – lack of construction capacity, oil rigs and skilled manpower – would all contribute towards peak oil, according to the taskforce. Other concerns are Investment shortfall, State of aged infrastructure, Tar sand flow rates too low, CTL flow rates too low, GTL flow rates too low, Absence of oil shale technology, Gas needed for power, Age skew and skills shortage


2011 ITPOES report:  A press release appeared last week on the website of the UK Industry Taskforce on Peak Oil and Energy Security (ITPOES) and said that during a meeting between Chris Huhne, the UK’s Secretary of State for Energy and Climate Change, and representatives of ITPOES, an agreement had been reached that Her Majesty’s Department for Energy and Climate will collaborate with ITPOES on a joint examination of concerns that global oil supply will begin to fall behind demand within as little as five years. This collaboration is seen by the British government as the first step in the development of a national peak oil contingency plan.

American readers should note that the British government recognizes that energy policy and climate change are inextricably linked so that you cannot formulate policies for one without the other, and that a major government recognizes global oil supplies will fall behind demand in as little as five years. After years of official denial this is indeed a breakthrough worthy of note.  Gone is the rhetoric about the billions of barrels of oil remaining that will last for so many decades that nobody alive today needs to worry. Official recognition has been given to the concept that the remaining oil will be so expensive to extract or will be locked into the earth by intractable political disputes, so that it simply will not be available in the unlimited quantities or at the prices we have known for the last 100 years. Also implicit in the announcement is that ever-rising real energy costs will destabilize nearly all of the world’s economies and that economic growth in the form we have come to know it will no longer be possible.

Oil production past and future ASPO


2010 ITPOES forecast (hasn’t changed in 2014 – they still believe the crunch starts in 2015). In 2010 they said the recession gave us an extra 2 years before the crunch hits.

2015 ENERGY CRUNCH ITPOES

Posted in Flow Rate, Oil, Oil Shocks, Peak Oil | Comments Off on Oil Crunch 2015: UK Industry Task force on Peak Oil & Energy Security (ITPOES)

Peak Oil in the news

Economic vulnerability to Peak Oil

Christian Kerschner Global Environmental Change   Volume 23, Issue 6, December 2013, Pages 1424–1433

Key points from a review of this article at Green Energy

This study shows which sectors could put the entire U.S. economy at risk when global oil production peaks (‘Peak Oil”). The sectors most affected are transport services, primary agriculture, metals and metals processing, non-metallic mineral and textiles, chemical and plastic products, and food and food processing.  Other affected sectors are construction, wood and paper, transport equipment, utilities, and trade.

Researchers say Peak Oil may already be here, and is a real threat to national and global economies. Their study is among the first to outline a way of assessing the vulnerabilities of specific economic sectors to this threat. “In this paper, we analyze the vulnerability of the U.S. economy, which is the biggest consumer of oil and oil-based products in the world, and thus provides a good example of an economic system with high resource dependence.”

August 11, 2012. The next great oil crisis. Miami Herald.

Note: the Miami Herald has removed this from their website – it used to be at: http://www.miamiherald.com/2012/08/11/2946593/the-next-great-oil-crisis.html

Technology is making it possible to tap vast new oil supplies. But that could be the proverbial drop in the gas tank compared to rising demand overseas.

After nearly a decade of warnings that the world’s oil supply was running out, Americans now are hearing about technology breakthroughs that can unlock vast U.S. deposits of natural gas, help reverse a 40-year slide in domestic oil production and perhaps transform America into the next Middle East.

Despite the euphoria, there’s a major problem: The looming American oil glut may simply not be enough to sate the United States and the rest of motorized humanity.

Experts say soaring demand from China and India is sure to send oil prices back above $100 a barrel. A supply disruption in the coming years, they say, could trigger panic, gasoline hoarding and perhaps lead to lines at the pumps akin to the 1973 Arab oil embargo and the 1979 Iranian revolution.

Global shortfalls of other fuels also could develop sooner than many people think, as a planet of nearly 7 billion people and more than 1 billion gasoline-gulping vehicles strains the limits of combustible energy resources that are the underpinning of modern civilization.

While oil industry officials take strong issue with these dim views, critics charge that governments here and abroad have been less than candid about future oil supplies and the ramifications of failing to shift to alternative fuels.

One outspoken Energy Department consultant, Robert Hirsch, alleged that the administrations of both Presidents George W. Bush and Barack Obama have engaged in a cover-up of the likelihood of an oil shortage. Hirsch predicted a shortfall will hit in the next four years and send shockwaves through the world economy, possibly leading to gasoline rationing.

Few governments have implemented intensive conservation programs to stretch out supplies during a decades-long transition to more fuel-efficient vehicles.

Instead, critics say that even as oil prices nearly quadrupled from 2003 through 2011, government and industry leaders have played down the world’s worsening energy predicament.

For example:

  • While U.S. industry officials have trumpeted new drilling techniques that can recover huge deposits of previously unreachable oil and natural gas, most say little about the likelihood of surging Third World demand overtaking supplies, causing shortages and skyrocketing prices.
  • Industry watchdogs say that some U.S. Energy Information Administration forecasts have been wildly optimistic, especially a projection that between 2011 and 2035, global production of liquid fuels will see a 21.6 million-barrel rise in daily output – the equivalent of the current reserves of the five biggest Middle East oil producers.
  • Other projections and policies by the Energy Information Administration, which is the Energy Department’s independent information arm, as well as the Paris-based International Energy Agency and even the U.S. Securities and Exchange Commission, have masked mounting risks of shortages of oil and possibly natural gas, several experts say. A McClatchy computer analysis suggests that proven reserves of all of the world’s primary fuels are likely to diminish much faster than the EIA and the IEA have suggested, raising questions about how long mankind can continue to increase consumption of finite resources.

Researchers at the International Monetary Fund, while not yet speaking for the fund, predicted in May that rising oil demand would drive prices to nearly $200 a barrel, “permanently, ” within a decade. Commodities speculators could exacerbate a price surge if they echo their behavior in recent oil spikes.

The world must accept “the outlook for flattened oil supplies” and “the reality that the era of abundant cheap oil is over,” said Sadad Al Husseini, a former No. 2 executive for Saudi Arabia’s national oil company, Aramco. In emails to McClatchy, he called for worldwide energy conservation measures.

The U.S. Energy Information Administration’ s deputy chief, Henry Gruenspecht, defended his agency’s main global oil supply forecast as stemming from “careful consideration of a wide range of factors.” He noted, however, that there’s “significant uncertainty” about future supply and demand of liquid fuels and a lack of transparency regarding some nations’ reserves. An international group of scientists and energy experts argues that global oil production has peaked or soon will as the second half of the oil age begins. The experts, known as peak oil advocates, say that the output of 500 existing giant oilfields that provide most of the world’s liquid fuels has begun a gradual decline that will create a 17 million-barrel daily deficit by 2035.

If they’re right, and if the Energy Information Administration has accurately projected future demand, liquid fuels production must fill a daunting, 38.6 million-barrel daily void to keep pace – an amount equal to more than 40% of the current global output.

“We’re facing a situation that is real hard for anyone to grasp,” said Kjell Aleklett, the Swedish president of the Association for the Study of Peak Oil.

Oil industry officials strongly disagree.

Industry consultant Daniel Yergin, chairman of IHS Cambridge Energy Research Associates, said that peak oil advocates have underestimated technology advances. While the costs are high, adequate supplies exist “if they can be developed in a reasonable time frame,” he said. Yergin, whose latest book, The Quest: Energy, Security, and the Remaking of the Modern World, details the worldwide scramble for fuel, pointed in an interview to an almost 25 percent increase in U.S. oil production since 2008 and major new discoveries in the North Sea and off the coasts of Brazil and Ghana.

Exxon Mobil’s chairman and chief executive officer, Rex Tillerson, told the Council on Foreign Relations recently that high oil prices have spurred the industry to “develop resources that were previously not accessible.” The latest technology will enable recovery of trillions of barrels of oil embedded in underground shale in Western states – enough “to carry us well into the latter part of this century at current production rates,” he said.

“There’s no question the world is running out of cheap oil,” said Brookings Institution scholar Charles Ebinger, who has advised 50 countries on energy matters. “Are we running out of expensive oil? I’m not convinced.”

Aleklett countered that, in a global context, most recent oil discoveries have been modest. For example, he said that if Norwegian oil company Statoil’s new discovery in the largely tapped North Sea amounts to a billion barrels, “that’s what the world consumes in 12 days.”

Posted in Peak Oil | Comments Off on Peak Oil in the news

Investing – random advice that may be great or awful

Be sure to read Nicole Foss and Gail Tverberg to understand the deflationary situation we’re in since investing for deflation is different from inflation.

You Gotta Eat

Fertilizer stocks.  MOS, etc.  They’re the most volatile

Viterra (VT:tsx) and Alliance Grain Traders (AGT:tsx) clean, sort, package, store, and ship grains.  This kind of stock is more stable than fertilizer stocks.

Farmland LP  Farmland LP acquires conventional farmland and converts it into certified Organic. Farmland LP owns 6,750 acres of farmland worth over $50 million in Northern California and Oregon.  Our funds give investors the opportunity to own high quality farmland, while our land management practices increase cash flow by using sustainable crop and livestock rotations.  Investors in Farmland LP help provide Organic farmers and progressive ranchers with access to outstanding land and infrastructure to build their businesses at scale, focused on the crops or livestock they produce best, and on high quality, Organic, sustainable farmland.

Inverse ETFs when the market  crashes

You should never hold an ETF overnight.  If you’re going to do this dangerous gambling, trade during the course of a day, always sell by closing time, and during the day, watch it like a hawk and sell it quickly if the trends go against you — it’s leveraged both ways and if you make the wrong bet you’re going to lose money.

The fees are so high you are almost certain to lose money.

It’s very hard to know the market is crashing, by the time you figure it out, it will be to late. The Wall Street boys will certainly short stocks first, enough to force a “Wall St Hoiday” where all trading stops.

Energy stocks

You missed the big bull run, too bad – you could have made 10 times or more on your investments if only you had believed in Peak Oil back in 2001-7.  Now the EROEI is too high,  and the debt is too high. But maybe there’s an oil shock or two that might send prices sky high between now and collapse, so it’s worth having some shares of energy stocks. If you wait too long to sell though after the next oil shock the economy will crash again, driving your stock prices down.

Cash

Already in other countries where the interest rates have gone negative, people are buying safes and withdrawing cash.  If you wait too long, it will be too late.  And beware of US $100 bills:

The Global Run On Physical Cash Has Begun: Why It Pays To Panic First

Gold & Silver

20 years after the crash it may be safe to use precious metals, but unless you are a member of the Hells’ Angels or a paramilitary organization, the odds are good that your hoard will be taken from you during the 20 or so years of time the crash will take place over.

Posted in Investing advice | Tagged , , , | Comments Off on Investing – random advice that may be great or awful

How Money is Created: 3 articles

Also see:

David Graeber. March 18, 2014. The Truth Is Out: Money Is Just An IOU, And The Banks Are Rolling In It.  The Guardian.

Back in the 1930s, Henry Ford remarked it was a good thing Americans didn’t know how banking worked, because if they did, “there’d be a revolution before tomorrow morning”.

Last week, something remarkable happened. The Bank of England let the cat out of the bag. In a paper called “Money Creation in the Modern Economy”, co-authored by 3 economists from the Bank’s Monetary Analysis Directorate, they stated outright that most common assumptions of how banking works are simply wrong, and that the kind of populist, heterodox positions more ordinarily associated with groups such as Occupy Wall Street are correct.

To get a sense of how radical the Bank’s position is, consider the conventional view: People put their money in banks, which lend that money out at interest to consumers or entrepreneurs willing to invest it in a profitable enterprise. The fractional reserve system allows banks to lend out considerably more than they hold in reserve, and if savings don’t suffice, private banks can seek to borrow more from the central bank.

The central bank can print as much money as it wishes. But it is also careful not to print too much. In fact, we are often told this is why independent central banks exist in the first place. If governments could print money themselves, they would surely put out too much of it, and the resulting inflation would throw the economy into chaos. Institutions such as the Bank of England or US Federal Reserve were created to carefully regulate the money supply to prevent inflation. This is why they are forbidden to directly fund the government, say, by buying treasury bonds, but instead fund private economic activity that the government merely taxes.

It’s this understanding that allows us to continue to talk about money as if it were a limited resource like bauxite or petroleum, to say “there’s just not enough money” to fund social programs, to speak of the immorality of government debt or of public spending “crowding out” the private sector.

What the Bank of England admitted this week is that none of this is really true.

To quote from its own summary: “Rather than banks receiving deposits when households save and then lending them out, bank lending creates deposits” … “In normal times, the central bank does not fix the amount of money in circulation, nor is central bank money ‘multiplied up’ into more loans and deposits.

In other words, everything we know is not just wrong–it’s backwards:

  1. When banks make loans, they create money.
  2. This is because money is really just an IOU.
  3. There’s really no limit on how much banks could create, provided they can find someone willing to borrow it.

The role of the central bank is to preside over a legal order that grants banks the exclusive right to create IOUs that the government will recognize as legal tender by its willingness to accept them in payment of taxes.

They will never get caught short, for the simple reason that borrowers do not, generally speaking, take the cash and put it under their mattresses; ultimately, any money a bank loans out will just end up back in some bank again. In the banking system, every loan just becomes another deposit. Even if banks need to acquire funds from the central bank, they can borrow as much as they like; all the latter really does is set the rate of interest, the cost of money, not its quantity. Since the beginning of the recession, the US and British central banks have reduced that cost to almost nothing. In fact, with “quantitative easing” they’ve been effectively pumping as much money as they can into the banks, without producing any inflationary effects.

What this means is that the real limit on the amount of money in circulation is not how much the central bank is willing to lend, but how much government, firms, and ordinary citizens, are willing to borrow. Government spending is the main driver in all this (and the paper does admit, if you read it carefully, that the central bank does fund the government after all). So there’s no question of public spending “crowding out” private investment. It’s exactly the opposite.

Why did the Bank of England suddenly admit all this? Well, one reason is because it’s obviously true. The Bank’s job is to actually run the system, and of late, the system has not been running especially well. It’s possible that it decided that maintaining the fantasy-land version of economics that has proved so convenient to the rich is simply a luxury it can no longer afford.

Politically this is taking an enormous risk. Consider what might happen if mortgage holders realized the money the bank lent them is not, really, the life savings of some thrifty pensioner, but something the bank just whisked into existence through its possession of a magic wand which we, the public, handed over to it.

[My comment: this article doesn’t explain WHY this is such an “enormous risk”.  So I’ve summarized some of the following video, which you really should watch to hear the parts I didn’t include and to fully understand how the system works so you can protect your wealth:]

The Biggest Scam In The History Of Mankind

Our financial system has kept the wealthiest at the top of the financial food chain for over a century. Never in history have so many been plundered by so few.

Most people don’t have a clue how currency is created: 92-96% of all currency in existence is created in the Banking system.

Our entire currency supply is a supply of numbers, little of it is printed. We work for this “currency”, trading years of our lives for numbers in a computer. We are what gives the currency its value.

Borrowing creates money and eventually far more debt than the “money/currency” itself.

We must keep going deeper and deeper into debt or the whole system goes into a deflationary collapse.

Of course, at some point the trillions of “currency” debt and quadrillions of derivative debt is impossible to pay back, but meanwhile, no one wants the system to crash on their watch, so more and more imaginary numbers are fed into the system to keep it going (i.e. the United States debt-ceiling). The can keeps getting kicked down the road.

It’s a fraud, a Ponzi scheme, a scam. It’s legalized theft. It has to crash eventually, [it always has in the bubbles of the past 200 years]. Here’s how it works:

Step 1. Banks swap I.O.U.s to create currency. The treasury sells the bonds to the banks.

Step 2. The banks then turn around and sell our national debt at a profit to the Federal Reserve, which they probably own (The federal reserve is not federal, it has stockholders). The Federal Reserve, then opens its checkbook, which doesn’t have a penny in it, and buys those I.O.U.s with I.O.U.s that it writes, gives those checks to the banks and currency springs into existence. This repeats relentlessly, which builds up bonds at the Federal Reseruve and currency at the treasury. All of it is just a bunch of numbers in a computer. The treasury then deposits these numbers into various branches of the government.

Step 3. Then the government spends the numbers on social programs, public works, and war. Government employees deposit their pay in banks.

Step 4. Banks multiply the numbers even more by inventing more I.O.U.S through fractional reserve lending where they steal a portion of everyone’s deposit and lend it out, and magnify the currency exponentially. The banks only have to keep a small part of your deposit. If you put $100 in, the bank can lend $90 out and keep $10 in case you want it back. It is legally allowed to replace your $90 with an I.O.U.

  1. Now there is $190 in the system.
  2. Someone borrows your $90 to buy something, deposits the check in his bank, and that bank lends it out 90% of the $90 (or $81).
  3. Now there’s $271 in existence ($190 + $81).
  4. Eventually there’ll be $1000 created from your $100 deposit.

Step 5. We work hard for these numbers. And pay taxes to the IRS, who turn our numbers over to the treasury to pay principal plus interest to the federal reserve on bonds they created with zero collateral (such as gold, oil, etc).

Step 6 The system is built to require ever increasing amounts of debt that will eventually collapse under its own weight.

[My comment: the financial system has worked this long due to exponentially increasing amounts of fossil fuels. All goods, infrastructure, electricity, food, heating, etc., depend on fossil fuel energy at every step. Especially farming, transportation, etc., because 97% of billions of combustion engines run on oil, not electricity. Oil production has been flat since 2005, which drove oil prices up to $148 and caused the financial crash, which is why the economy hasn’t recovered, and never will. If the system doesn’t collapse under its own weight of debt, as shown in this video, then it will certainly collapse within the next 6 years as energy production leaves the plateau and declines exponentially. Oil production may already be declining, and isn’t apparent because demand has dropped since the majority of Americans are poorer and driving / consuming less since the crash].

Step 7 The secret owners – probably the largest banks — take their cut. They make a profit not just on your deposit (step 4) but also when:

  1. They sell our national debt to the Fed.
  2. When the Federal Reserve pays interest on the reserves
  3. When the Federal Reserve pays them a 6% dividend on their ownership of the fed
  4. Those who get the money first can spend it before prices inflate and get the most benefit.

This system is fundamentally evil

  • It funnels wealth to from the workers to the super-rich, causes booms and busts, and creates the great disparity of wealth.
  • It is a form of enslavement. Bond(age).
  • Nobody is asking our children if they want to work hard for the prosperity we’re enjoying now and be enslaved as well.
  • George Washington said “No generation has a right to contract debts greater than can be paid off during the course of its own existence”.
  • John maynard Keynes once said that “By this means, government may secretly and unobserved, confiscate the wealth of the people, and not one man in a million will detect the theft”.

Strip private banks of their power to create money.  Financial Times.

Printing counterfeit banknotes is illegal, but creating private money is not. The interdependence between the state and the businesses that can do this is the source of much of the instability of our economies. It could – and should – be terminated.

I explained how this works two weeks ago. Banks create deposits as a byproduct of their lending. In the UK, such deposits make up about 97 per cent of the money supply. Some people object that deposits are not money but only transferable private debts. Yet the public views the banks’ imitation money as electronic cash: a safe source of purchasing power.

Banking is therefore not a normal market activity, because it provides two linked public goods: money and the payments network. On one side of banks’ balance sheets lie risky assets; on the other lie liabilities the public thinks safe. This is why central banks act as lenders of last resort and governments provide deposit insurance and equity injections. It is also why banking is heavily regulated. Yet credit cycles are still hugely destabilising.

What is to be done? A minimum response would leave this industry largely as it is but both tighten regulation and insist that a bigger proportion of the balance sheet be financed with equity or credibly loss-absorbing debt. I discussed this approach last week. Higher capital is the recommendation made by Anat Admati of Stanford and Martin Hellwig of the Max Planck Institute in The Bankers’ New Clothes.

A maximum response would be to give the state a monopoly on money creation. One of the most important such proposals was in the Chicago Plan, advanced in the 1930s by, among others, a great economist, Irving Fisher. Its core was the requirement for 100 per cent reserves against deposits. Fisher argued that this would greatly reduce business cycles, end bank runs and drastically reduce public debt. A 2012 study by International Monetary Fund staff suggests this plan could work well.

Similar ideas have come from Laurence Kotlikoff of Boston University in Jimmy Stewart is Dead, and Andrew Jackson and Ben Dyson in Modernising Money. Here is the outline of the latter system.

First, the state, not banks, would create all transactions money, just as it creates cash today. Customers would own the money in transaction accounts, and would pay the banks a fee for managing them.

Second, banks could offer investment accounts, which would provide loans. But they could only loan money actually invested by customers. They would be stopped from creating such accounts out of thin air and so would become the intermediaries that many wrongly believe they now are. Holdings in such accounts could not be reassigned as a means of payment. Holders of investment accounts would be vulnerable to losses. Regulators might impose equity requirements and other prudential rules against such accounts.

Third, the central bank would create new money as needed to promote non-inflationary growth. Decisions on money creation would, as now, be taken by a committee independent of government.

Finally, the new money would be injected into the economy in four possible ways: to finance government spending, in place of taxes or borrowing; to make direct payments to citizens; to redeem outstanding debts, public or private; or to make new loans through banks or other intermediaries. All such mechanisms could (and should) be made as transparent as one might wish.

The transition to a system in which money creation is separated from financial intermediation would be feasible, albeit complex. But it would bring huge advantages. It would be possible to increase the money supply without encouraging people to borrow to the hilt. It would end “too big to fail” in banking. It would also transfer seignorage – the benefits from creating money – to the public. In 2013, for example, sterling M1 (transactions money) was 80 per cent of gross domestic product. If the central bank decided this could grow at 5 per cent a year, the government could run a fiscal deficit of 4 per cent of GDP without borrowing or taxing. The right might decide to cut taxes, the left to raise spending. The choice would be political, as it should be.

Opponents will argue that the economy would die for lack of credit. I was once sympathetic to that argument. But only about 10 per cent of UK bank lending has financed business investment in sectors other than commercial property. We could find other ways of funding this.

Our financial system is so unstable because the state first allowed it to create almost all the money in the economy and was then forced to insure it when performing that function. This is a giant hole at the heart of our market economies. It could be closed by separating the provision of money, rightly a function of the state, from the provision of finance, a function of the private sector.

This will not happen now. But remember the possibility. When the next crisis comes – and it surely will – we need to be ready.


Posted in Money | Tagged , | Comments Off on How Money is Created: 3 articles

Electric Grid Overview

[ Our energy, transportation, electric, water and other infrastructures are all heavily dependent on each other, making the U.S. one of the most vulnerable nations on earth.  Although transportation is the most essential of all, especially trucks, which make the electric grid and electricity generation contraptions possible from mining to manufacture to thousands of components delivered via world-wide supply chains to final delivery to the site, electricity outages can take down transportation (i.e. gas pumps are electric, etc).

To understand why, it helps to learn how the electric grid works, which I’ve attempted to do below.

Alice Friedemann   www.energyskeptic.com  author of “When Trucks Stop Running: Energy and the Future of Transportation”, 2015, Springer and “Crunch! Whole Grain Artisan Chips and Crackers”. Podcasts: Practical Prepping, KunstlerCast 253, KunstlerCast278, Peak Prosperity , XX2 report ]

Electricity is essential.

In a blackout all of these essential services fail: Pumping of potable water, sewage, and irrigation water; sewage treatment; food and fuel supply and storage; refrigeration; medical facilities, prisons, banking, communications, refineries, shipping, transportation, commerce, and home/commercial life-support systems (heating, ventilation, and air conditioning), etc.

Modern life is impossible without it.

Electric power transmission and distribution (T&D) in the United States is in urgent need of expansion and upgrading.  It’s been called the world’s largest machine run by over 3,100 utility companies, with nearly 3,000 power plants that generate 4.16 million GWh.  Fossil fuels generated 70% of the electricity — 49% coal and 21% natural gas.  Renewable energy only contributed 8.4%, with 6% of that from hydropower.

The American Society of Civil Engineers has warned that without an investment of $100 billion, the US power generation system will collapse by 2020. Growing loads, aging equipment, and wind and solar power are destabilizing and stressing the system, which increases the risk of widespread blackouts. Modern society depends on reliable and economic delivery of electricity.

Recent concerns have stemmed from inadequate investment to meet growing demand, the limited ability of those systems to accommodate renewable-energy sources that generate electricity intermittently, and vulnerability to major blackouts involving cascading failures.  And also, distant sources of renewable generation can’t be used without expanding the grid.

The high-voltage transmission system (or grid) transmits electric power from generation plants through 163,000 miles of high-voltage (230 kilovolts [kV] up to 765 kV) electrical conductors and more than 15,000 transmission substations. The transmission system is configured as a network, meaning that power has multiple paths to follow from the generator to the distribution substation.

The distribution system contains millions of miles of lower-voltage electrical conductors that receive power from the grid at distribution substations. The power is then delivered to 131 million customers via the distribution system. In contrast to the transmission system, the distribution system usually is radial, meaning that there is only one path from the distribution substation to a given consumer.

Problems with the Current System

Most U.S. transmission lines and substations were constructed more than 40 years ago and are based on 1950s’ technology, but demands on the electric power system have increased significantly over the years. Since 1990, electricity generation has risen from about 3 trillion kilowatt-hours (kWh) to about 4 trillion in 2007. Long-distance transmission has grown even faster for reliability and economic reasons, including new competitive wholesale markets for electricity, but few new transmission lines have been built to handle this growth.

From 1985 through 1995, transmission investment was fairly stable at the level of about $4.5 billion per year. In the late 1990s, the restructuring and re-regulation of the U.S. transmission system led to a decrease in investment down to about $3 billion a year and is operating at or near its physical limits often.

Inadequate system maintenance and repair also have contributed to an increase in the likelihood of major transmission system failures.  Of greatest concern is the risk of these disturbances cascading over large portions of the T&D systems. The 2003 blackouts in the world’s two largest grids—the North American Eastern Interconnection and the West European Interconnection—resulted from such cascading failures. Each event affected 50 million people.

If the electric grid comes down from cyber or nuclear war, an Electromagnetic pulse, natural gas shortages (natural gas peaker plants are essential to balancing “renewable” energy), coal shortages, terrorist attacks, natural disasters, oil shocks, and so on, the electric grid could be down for a year or more in one or all of the regional networks.

Anyone who hopes that renewable energy could compensate even slightly for oil in the future needs to understand that above all, there has to be a 100% reliable and vastly expanded electric grid. Yet The Grid is rusting and falling apart right now for many reasons.  One of them is deregulation, which has made it unprofitable to maintain The Grid because it harms the profits of the shareholders.

There’s no point in building wind, solar, hydro, and nuclear power plants without a robust and expanded electric power grid.  And without the electric grid, it will be hard to make microchips and other gadgets essential to civilization, there will be no refrigeration, lights, electrified transportation, hospital services, internet, computers running — we are as dependent on the electric grid as we are on oil.  A decentralized system is not capable of making steel, aluminum, make cement, and all the other heavy duty chores needed to maintain civilization as we know it.

A quick way to get up to speed on this topic are the following:

I think the grid is fascinating, an immense puzzle, the world’s largest machine – I hope you’ll read these and other books to really grasp the immensity, complexity, and vulnerability of the grid.

Grid Stability

Blackouts happen when there’s too much or too little power and the frequency deviates too much from the very narrow band of 60 Hz frequency – a great explanation of this is:

Chris Lee. March 13, 2013. Stabilizing the electric grid by keeping generators in sync Better grid design should keep generators from fluctuating in phase. Nature Physics, 2013. DOI: 10.1038/nphys2535

Los Angeles Times: Green energy is making collapse of the electric grid more likely

Evan Halper. Dec 2, 2013.   Power struggle: Green energy versus a grid that’s not ready. Minders of a fragile national power grid say the rush to renewable energy might actually make it harder to keep the lights on.  Los Angeles Times.

The grid is also built on an antiquated tangle of market rules, operational formulas and business models.  Planners are struggling to plot where and when to deploy solar panels, wind turbines and hydrogen fuel cells without knowing whether regulators will approve the transmission lines to support them.

Energy officials worry a lot these days about the stability of the massive patchwork of wires, substations and algorithms that keeps electricity flowing. They rattle off several scenarios that could lead to a collapse of the power grid — a well-executed cyberattack, a freak storm, sabotage.

But as states, led by California, race to bring more wind, solar and geothermal power online, those and other forms of alternative energy have become a new source of anxiety. The problem is that renewable energy adds unprecedented levels of stress to a grid designed for the previous century.

Green energy is the least predictable kind. Nobody can say for certain when the wind will blow or the sun will shine. A field of solar panels might be cranking out huge amounts of energy one minute and a tiny amount the next if a thick cloud arrives. In many cases, renewable resources exist where transmission lines don’t.

The grid was not built for renewables,” said Trieu Mai, senior analyst at the National Renewable Energy Laboratory.

The role of the grid is to keep the supply of power steady and predictable.

Engineers carefully calibrate how much juice to feed into the system as everything from porch lights to factory machines are switched on and off. The balancing requires painstaking precision. A momentary overload can crash the system.

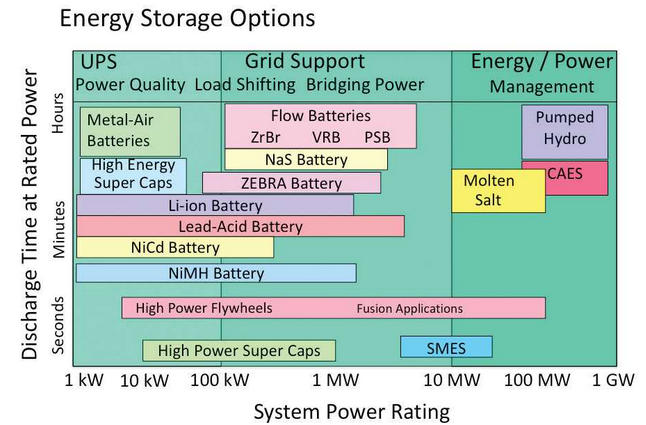
California has taken some of the earliest steps to address the problems. The California Public Utilities Commission last month ordered large power companies to invest heavily in efforts to develop storage technologies that could bottle up wind and solar power, allowing the energy to be distributed more evenly over time.

Whether those technologies will ever be economically viable on a large scale is hotly debated.

Already, power grid operators in some states have had to dump energy produced by wind turbines on blustery days because regional power systems had no room for it. Officials at the California Independent System Operator, which manages the grid in California, say renewable energy producers are making the juggling act increasingly complex.

“We are getting to the point where we will have to pay people not to produce power,” said Long Beach Mayor Bob Foster, a system operator board member.

Joel Brenner.  2011. “America the Vulnerable: Inside the New Threat Matrix of Digital Espionage, Crime, and Warfare”.

Electric grid Vulnerability

Retired military officers wrote a 62 page report called “Powering America’s Defense: Energy and the Risks to National Security”.   The report discusses the U.S. electric grid, which it says is “unnecessarily vulnerable.”

The grid is very vulnerable to cyber attacks as explained in my two book reviews of:

  1. Richard Clarke. 2012. CYBER WAR. The Next Threat to National Security and What to Do About It”.
  2. Joel Brenner.  2011. “America the Vulnerable: Inside the New Threat Matrix of Digital Espionage, Crime, and Warfare”.

Also  see:

Emergency drill: Cyberattack on electric grid

Assault on California Power Station Raises Alarm on Potential for Terrorism. April Sniper Attack Knocked Out Substation, Raises Concern for Country’s Power Grid (Wall Street Journal). New York Times: Sniper Attack at power hub still a mystery

Philip Ball. Jan 2004. Power blackouts likely: Electricity systems are becoming ever more vulnerable, and there’s no quick fix.  Nature.   Geomagnetic storms could cause large blackouts in the future, and the way the grid is growing makes it more vulnerable, according to John Kapperman, a government advisor.  The Sun ejects streams of charged particles that can warp the Earth’s magnetic field, producing dazzling atmospheric effects such as the aurora borealis. The changing magnetic field also induces a direct current in transformers. This causes huge electrical surges, because the grid is meant to take only alternating current. “It’s very difficult to design a transformer that can cope with this,” says Kappenman. The effect on power grids can be devastating. In 1989, the power grid in Quebec, Canada, was shut down within 90 seconds of a major geomagnetic storm. As the grid grows, and more interconnecting wires are added to the system, it actually becomes more vulnerable to such storms. Over the past 50 years, there has been a tenfold increase in the lengths of power lines in the United States. “The power companies have unwittingly built risks into the grid, and the risk is spiralling out of control,” he says.

H. Byrd. 12 May 2014. Lights out: The dark future of electric power. NewScientist.com

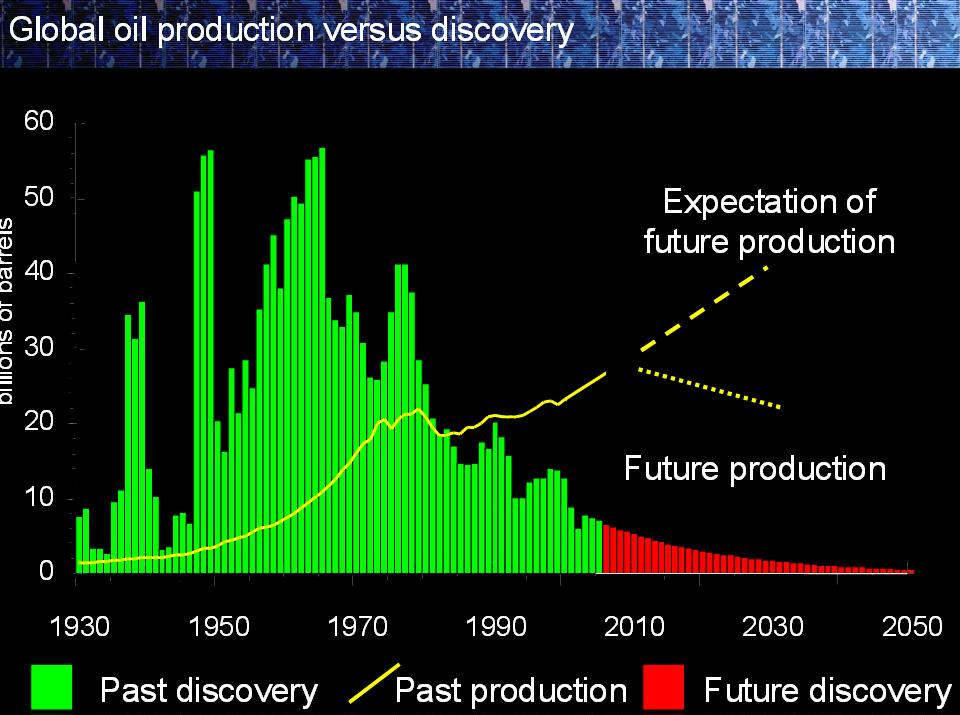
We predict that blackouts will occur with greater frequency and greater severity due to trends in both electricity supply and demand. Supply will become increasingly precarious because of the depletion of fossil fuels, neglected infrastructure and the shift toward less reliable renewable energy. Demand, meanwhile, will grow because of rising populations and affluence.

Resource depletion is already having an effect on countries that rely on fossil fuels such as coal for electricity generation. Countries with significant renewable resources are not immune either. Weather is not predictable and is likely to become less so, courtesy of climate change: in the past decade shortages of rain for hydro dams has led to blackouts in Kenya, India, Tanzania and Venezuela.

Deregulation and privatization have created further weaknesses in supply as there is no incentive to maintain or improve the grid. Almost 75% of US transmission lines and power transformers are more than 25 years old and the average age of power plants there is 30 years.

The looming threat of blackouts cannot be solely blamed on vulnerabilities in generation, however. Over-consumption is also a factor. Between 1940 and 2001, average US household electricity use rose 1300 per cent, driven largely by growing demand for air conditioning. And such demand is forecast to grow by 22 per cent in the next two decades.

It is worth reiterating what is at stake here. We analysed almost 50 significant power-outages across 26 countries. They had numerous causes, from technical failure to sabotage. Nonetheless, the same set of problems emerged.

Blackouts affect computers, microprocessors, pumps, fridges, traffic and street lights, security systems, trains and cellphone towers, with consequences across society. The economic losses can be enormous: power outages are already estimated to cost up to $180 billion a year in the US.

GPS pioneer warns on network’s security.   Financial Times.

The Global Positioning System helps power everything from in-car satnavs and smart bombs to bank security and flight control, but its founder has warned that it is more vulnerable to sabotage or disruption than ever before – and politicians and security chiefs are ignoring the risk.

Impairment of the system by hostile foreign governments, cyber criminals – or even regular citizens – has become “a matter of national security”, according to Colonel Bradford Parkinson, who is hailed as the architect of modern navigation.

“If we don’t watch out and we aren’t prepared,” then countries could be denied everything from ‘navigation’ to ‘precision weapon delivery’, Mr Parkinson warned.

“We have to make it more robust … our cellphone towers are timed with GPS. If they lose that time, they lose sync and pretty soon they don’t operate. Our power grid is synchronized with GPS [and] our banking system.

Western governments are “in their infancy in recognizing the problem”, Mr Parkinson told the Financial Times in an interview on the fringes of a conference for government officials, academics and defense contractors at the UK’s National Physical Laboratory.

He said: “[In the US] I don’t know anyone that is really in charge of it. The Department of Homeland Security should be [but] … they don’t have any people that understand it very well. They’ve got one person without any budget to speak of.”

National Academy of Sciences on why blackouts are a system problem

Jay Apt, et al. Electrical Blackouts: A Systemic Problem Although human error can be the proximate cause of a blackout, the real causes are found much deeper in the power system. issues in Science & Technology. National Academy of Sciences.

Problems at the root of blackouts:

  • Monitoring of the power grid is sparse, and even these limited data are not shared among power companies.
  • Industry standards are lax; for example, vegetation under transmission lines is trimmed only every five years.
  • Operators are not trained routinely with realistic simulations that would enable them to practice dealing with the precursors to cascading failures and the management of large-scale emergencies.
  • Power companies have widely varying levels of equipment, data, and training. Some companies can interrupt power to customers quickly during an emergency, whereas others are nearly helpless.
  • Decades-old recommendations to display data in a form that makes it easy to see the extent of a problem have been ignored. This was a contributing cause of the 1982 West Coast blackout, where “the volume and format in which data were displayed to operators made it difficult to assess the extent of the disturbance and what corrective action should be taken.”
  • Monitoring of the power system is everywhere inadequate, both within regions and between them.

After the passage of the Public Utilities Regulatory Policies Act in 1978 and the Energy Policy Act of 1992, the electricity industry became a hybrid of vertically integrated utilities and new structures of multiple forms. “Merchant generators,” independent of utility companies, installed their own plants and sought customers anywhere in the country. Aggregators bargained for better rates on behalf of large numbers of customers. Energy brokers used the open market and long-term contracts to buy and sell power.

Restructuring has transformed the operation of the electricity system. Utilities formerly transmitted power from a nearby generation plant to customers. Now, industrial customers can buy power from plants hundreds of miles away, putting major burdens on the transmission system and increasing the likelihood of a blackout. That has made a huge difference: The number of times that the transmission grid was unable to transmit power for which a transaction had been contracted jumped from 50 in 1997 to 1,494 in 2002. This metamorphosis has done little to improve the physical system of transmission or its control systems. The burden of making the new system operate reliably has instead fallen on people.

No organization that generates, transmits, or distributes electric power wants low reliability. But in a deregulated competitive electricity market, companies have to pay for investments out of the revenues they earn. Unless companies can find a way to bill customers for reliability, or unless regulators mandate reliability investments and ensure that they are reimbursed, no investments will be made. None of the 19 states that have implemented electric restructuring has figured out how to pay for investments to prevent low-probability events such as blackouts


How the Electric Grid Works

National Academy of Science report written for the Department of Homeland Security: “Terrorism and the Electric Power Delivery System. 2012. National Research Council.

As systems became larger and power had to be carried over longer distances, power lines were operated at ever higher voltage in order to minimize losses. Efficient high-voltage transmission lines also made it possible to locate ever larger generators in remote areas rather than close to towns and cities. By the middle of the 20th century, system operators began to connect individual high-voltage systems together so that power could be moved from region to region, both to promote economic efficiency and to increase reliability by making it possible to move power into regions suffering from temporary shortages. Once electric power has been generated, the voltage is stepped up and power moves over long distances through the high-voltage transmission system, a complex network of lines, most of which are carried aboveground on tall towers. At key points throughout this system are substations that contain transformers to increase and decrease the voltage, switching gear that connects the system in desired configurations, and circuit breakers that open and close connections while also acting as giant fuses to protect expensive equipment from damage, as well as a variety of other devices.. When power reaches an area where it will be used, the voltage is reduced and power is distributed to customers over lower-voltage distribution lines. Unlike the transmission system, which is a large interconnected network, many distribution systems branch out radially to deliver power to customers, although some older, dense urban areas, such as New York City, use network configurations for distribution. All the elements of the transmission system, and increasingly those of the distribution system, are monitored and controlled by information and communication systems.

Keeping power flowing to customers is a continuous process of control, recovery, and repair. Most outages are local, brief in duration, and caused by problems at the level of the distribution system—such as lightning strikes, wind storms and tree falls, short circuits caused by wild animals such as squirrels, vehicles that crash into power poles, and similar events. Line crews can usually fix these outages in a matter of hours. Distribution systems that incorporate automation can often isolate a problem and restore service for many affected customers in a matter of seconds or minutes. Outages caused by disruptions in the high-voltage transmission system are less common. When they do occur, because of faulty equipment, weather, or for other reasons, many such outages are never noticed by customers, because automatic controls and system operators can limit their impact and maintain the supply of power to the distribution system. But, of course, the transmission system does occasionally experience problems that result in loss of service to customers. Weather events, such as hurricanes and ice storms, earthquakes, and similar natural events, can bring down many transmission lines, and, less frequently, can damage transformers, circuit breakers, and other equipment such as the terminal facilities for direct-current (DC) lines. Inadequate attention to maintenance can also contribute to blackouts, such as from arcing to vegetation from inadequate tree trimming.

If protection systems are poorly designed or do not operate properly, faults or equipment failures can cause outages and may cascade or propagate into blackouts. Once an overloaded circuit or transformer in the system either fails or is intentionally removed from service, the power flows through other available circuits in proportion to the paths of least resistance. These alternative circuits may in turn become overloaded and either fail or be taken out of service by the protection system. This repeated, possibly uncontrolled, cycle of overload and equipment removal/failure is a dynamic, frequently oscillating phenomenon that can lead to a cascading outage. A local failure can escalate into a cascading failure in a matter of a few minutes, potentially leading to a wide-area blackout.

Structural Changes in the Industry

The electric power industry has undergone considerable changes in the last two decades that have affected how the electricity infrastructure operates. Some of the once vertically integrated electric utilities that supplied generation, transmission, and distribution services have undergone restructuring that separated them into distinct entities with responsibility for only one or a few such services. In 1996, to mandate and facilitate competition at the wholesale level, FERC required transmission-owning utilities to “unbundle” their transmission and power-marketing functions and provide nondiscriminatory, open access to their transmission systems by other utilities and independent power producers. Some utilities pursued unbundling by creating separate divisions within their companies, others spun off certain assets into separate but affiliated companies, and others sold off assets to separate owners (primarily generating facilities). Some states required—or created powerful incentives for—utilities to divest their generation assets as part of a restructuring effort. Others required vertically integrated utilities to divest their transmission assets to independent entities. In addition, power marketers—who often do not own generation, transmission, or distribution facilities—now buy and sell power on wholesale markets and market electricity directly to customers. All of these changes created even greater variations of the operational landscape within the industry. Competition in the electric power industry has led to significant changes in the operation of the system.

The Energy Policy Act of 1992 made it possible for competitive power producers to be entitled to access and use a utility’s transmission system. In some regions, these requirements put new demands on an already stressed power system. In 1996, FERC issued regulatory policies (FERC Orders 888 and 889) that formally required transmission owners to provide open and nondiscriminatory access to the competitive wholesale generation market, and to provide comparable terms and conditions to all market participants, including the generation used to serve a utility’s own customers. FERC policies, in combination with technological and economic changes in the industry, placed extraordinary new demands on transmission systems. Utilities that previously planned and operated their systems for the benefit of their own customers’ requirements were now required to take other market interests into account.


Related articles

Electric Grid

Posted in Electric Grid, Electric Grid & EMP Electromagnetic Pulse, Energy | Tagged , , , , , | Comments Off on Electric Grid Overview

Will the government seize your IRA after the next financial crash?

Federal government may seize part of your IRA
passportira.com

[I don’t think this is likely, but then again, when you look at the influence of money on politics, the corruption across all financial sectors, the largest bubble in human history combined and peak energy plus other, there’s not telling what might happen.  Also, it has happened in other countries.  The FDIC won’t be able to pay people, we depend on China for finished goods and need to pay for our oil habit, so it’s really not impossible – the government would probably take over your IRA rather than have a sovereign default].

The national debt today is a staggering $14.25 trillion. In the past 3 years alone, our government added $5.5 trillion in new debt – nearly a 60% rise.

Federal spending increased a record 29% during President Obama’s first 3 years. The government budget deficit is estimated to be $1.2 trillion.

“Total monetary and financial collapse of the massive government debt bubble is upon us, with devastating real-world consequences for your savings property values, investments, and other assets,” says Robert Mundell, an economist at Columbia University. “We’ve never been in this unstable position in the entire currency history [of] 3,000 years.”

Where can the federal government turn to for cash that can help it dig out of this hole?

How about your IRA?

Americans have $4 trillion saved in 401K plans and another $8 trillion in IRAs and pension plans, 95% of which are invested in the equity markets, mainly stocks and mutual funds.

If the U.S. government forces investors to invest 50% of their IRAs in government bonds, that would raise $6 trillion.

In fact, Congress once passed, and later rescinded, a 15% “excess retirement accumulations excise tax” on large retirement plans. Reviving that tax could bring the government a lot of money.

Unthinkable that the U.S. government would seize control of a portion of your IRA in this manner? Think again. It is happening all over the world, and the U.S. may soon follow suit.

Eight countries have raided retirement plans since 2008, including France, Poland, Ireland, and Hungary.

Teresa Ghilarducci has proposed her plan to Congress, a ‘Guaranteed Retirement Account’, or GRA.

In her words “…a GRA will accumulate 5% of their paychecks in a GRA over their lifetime. The government would credit their accounts with 3% plus inflation… GRAs would provide a safe and secure retirement to 63 million people.”

Of course, this is only coming up because the now ‘in the red’ Social Security system will no longer meet its purpose. So why not double down?

And more bad news: whenever a government has seized a portion of its citizens’ money from retirement accounts, the stock market has plunged … which would further drain wealth from your IRA.

When Argentina moved $29 billion in public pensions into government accounts in 2008, their stock market lost 13% of its value.

And when Hungary required that private pensions invest in public debt in 2010, their market fell 14%.

Posted in Sovereign Default | Comments Off on Will the government seize your IRA after the next financial crash?

Are Brokerage Accounts Safe?

James Stewart. December 9, 2011 A Risk Once Unthinkable. New York Times.

Are customer accounts at brokerage firms safe?

SIPC will replace up to $500,000 of securities and cash (but not futures contracts) missing from customer accounts at member firms. A measure of the magnitude of the problem is that since its creation in 1970, SIPC has advanced $1.6 billion to make possible the recovery of $109.3 billion in assets for an estimated 739,000 investors (through the end of 2010).

Until the collapse of MF Global, that’s a question I thought I’d never have to ask.

Brokerage firms are required by law to maintain segregated accounts holding all client assets, including stocks, bonds, mutual funds, money market funds and cash. The law was passed after the 1929 crash, in the depths of the Depression, to make sure that customer assets were there at all times, ready to be disbursed even if everyone asked for their money at once.

This obligation to protect customer assets “is considered sacrosanct,” Robert Cook, director of the division of trading and markets at the Securities and Exchange Commission, told me this week. “It’s considered a sacred obligation.”

Lehman Brothers may have engaged in many foolhardy practices, but even in the firm’s last days, when officials were desperate for cash, no one dared touch customer assets, which remained safely segregated despite the firm’s collapse.

And then came the revelation that an estimated $1.2 billion in customer assets had vanished at MF Global, the large brokerage and futures trading firm headed by Jon S. Corzine, the former Goldman Sachs executive and Democratic politician, that collapsed in late October after a catastrophic bet on European sovereign debt.

How could such a thing happen? I had always assumed it was impossible and that strict internal controls existed at all brokerage firms so that firm officials couldn’t tap segregated customer funds even if they were willing to break the law. Thanks to MF Global, it’s now apparent that isn’t necessarily true. “If people are determined to misuse customer funds, they will misuse them,” said Ananda Radhakrishnan, the director of the division of clearing and risk at the Commodities Futures Trading Commission.

That’s because the commodities and securities industry is mostly self-regulating, and self-regulation ultimately depends on the integrity of the regulated. Broker-dealers — securities firms that execute trades of stocks, bonds and other assets for customers — are overseen by the S.E.C., while futures commission merchants, which trade commodities, derivativesand futures, are regulated by the C.F.T.C. Like most large brokerage firms, MF Global was both a broker-dealer and a futures commission merchant, though its primary business was commodities futures trading.

The federal regulators issue and enforce the rules, but day-to-day oversight for securities firms is delegated to the Chicago Board Options Exchange, a for-profit company, and the Financial Industry Regulatory Authority, or Finra, a nonprofit organization financed by the brokerage industry. For commodity dealers, it’s the National Futures Association and the Chicago Mercantile Exchange. They conduct periodic examinations and audits and, in addition, member firms are required to have internal controls and compliance mechanisms to make sure that customer assets remain safely segregated at all times.

Typically, this requires transfers from segregated accounts (other than at the customer’s request) to be approved by multiple officials, including in many cases, the firm’s chief financial officer and chief compliance officer.

“It’s not a low-level functionary,” a regulator said. “It’s someone who has real standing. Most customer assets are held at the biggest firms and they have scores of people involved in this process.”

Susan Thomson, a spokeswoman for Merrill Lynch, the nation’s largest brokerage firm, said that any transfer from segregated accounts there required “at least three checks and possibly more.” Officials from operations, regulatory reporting and collateral are usually involved and sometimes compliance officials, as well. “There are multiple streams of responsibility. You have management accountability in each of those streams on a daily basis,” she said.

MF Global also had internal controls and a chief compliance officer, which raises the question: How did the customer assets ever leave the segregated accounts to begin with? In testimony on Capitol Hill on Thursday, Mr. Corzine only added to the mystery. He said that transferring customer funds was “a complex process” and, asked who could execute such a transfer, said “I wouldn’t know probably who that person is.”

While Mr. Corzine said he had “no intention” of authorizing any transfer of segregated funds and “didn’t intend to break any rules,” he left open the possibility that someone might have thought he did. Others at MF Global surely know. A spokeswoman for MF Global Holdings, the holding company for the broker-dealer, said “there was an approval process” for moving segregated funds, but said she was unable to provide more details.

There are legitimate reasons to move assets from segregated accounts, the most common being that they are overfunded. Commodities firms are required to reconcile customer assets with the amounts in segregated accounts every day, and must report any shortfall to the C.F.T.C.

For securities firms, the requirement is only once a week, but many firms do it every day. They are required to report shortfalls to Finra. If there’s an excess (many firms deliberately overfund the segregated accounts to make sure there is never an inadvertent shortfall), they can transfer the excess funds. But that usually requires high-level approval from someone like the chief financial officer, and then the transfer can’t exceed the amount of the excess. So that wouldn’t explain the missing $1.2 billion at MF Global.

The law also allows commodities firms like MF Global to use segregated customer funds as a source of low-cost financing for their own operations, but they are required to replace any customer assets taken from segregated accounts with supposedly ultra-safe collateral of the same value, typically United States Treasuries, municipal obligations and obligations whose payments of principal and interest are guaranteed by the government.

This week, the C.F.T.C. issued new rules restricting how client assets can be invested, which had grown under C.F.T.C. interpretations to include sovereign debt and transactions known as “in-house repos,” or repurchase agreements, in which a firm contracts with itself to use customer assets as, in effect, interest-free loans to finance its inventory of Treasury bonds. MF Global was apparently a heavy user of in-house repos, and before his firm collapsed, Mr. Corzine had argued strenuously against the C.F.T.C.’s proposal to ban them.

Making bad bets on European sovereign debt — like making bad bets on United States mortgage-backed securities — isn’t a crime, but improperly transferring segregated customer assets is a potential criminal violation of the securities laws and a relatively straightforward one at that. (The United States attorney’s office in Manhattan is in the early stages of investigating the removal of customer assets from MF Global.

I spoke this week to several people involved in the MF Global investigation. No one has reached any firm conclusions about how the assets were transferred, but possible innocent explanations have dwindled to almost none. And James B. Kobak Jr., a lawyer for the MF Global trustee, said in court on Friday that there were “suspicious” trades made from customer accounts. If that’s the case, there may have been a deliberate and concerted effort to override MF Global’s internal controls to gain access to segregated customer assets, and if that can be proved, those responsible should be prosecuted and, if convicted, go to jail.

Unfortunately for MF Global’s customers — and future victims of similar crimes, if that’s what it turns out to be — there’s no easy remedy and it will most likely be months or even years before they recover their money. The Securities and Investor Protection Corporation explicitly warns that it’s “not uncommon for delays to take place when the troubled brokerage firm or its principals were involved in fraud.”

Meanwhile, the C.F.T.C.’s enforcement capabilities, like the S.E.C.’s, have been starved for lack of funding. “Our funding has declined to such an extent that three to four years ago, just as the industry was taking off, we had less than 500 employees,” Mr. Radhakrishnan said. But even with more resources, “We can’t be at every firm overseeing every activity. We have to expect people to understand the rules and adhere to them.”

Posted in FDIC & SIPC Insolvent | Comments Off on Are Brokerage Accounts Safe?

How will the violence play out in the USA?

There will surely be violence as America’s population descends from 400 million to 100 million or less as energy production declines.

Leaders will emerge who blame some particular group for our suffering.  So far it’s been those terrorist Middle Easterners sitting on top of “our” oil, but at some point our military won’t be able to venture abroad due to lack of oil and/or China, Russia, and Europe preventing us from invading the Middle East again.  Violence will become local.


Many people have written about how the in & out groups might form:

  • Ethnic (i.e. recent immigrants versus longer term residents, or whites vs blacks vs hispanics, etc).
  • The Young vs the Old
  • Mafias, gangs, drug lords prey on citizens
  • Crazed leaders emerge like Hitler, Stalin, Mao, and so on, who turn all against all, and maintain law and order with massive concentration camps, execute people for trivial crimes, perhaps prevent mass migrations, find an external enemy to unite people and America then attacks Mexico, Canada, Venezuela, or any other nation that has oil we want.
  • Bible Belt: along religious lines

There is a new database designed to aid study of ethnic, religious strife worldwide.  Those trying to understand these “sociocultural” animosities and conflicts – whether academics, journalists or nongovernmental organizations – now have a new tool at their disposal: a public database that pulls together multiple sources on trends in the composition of ethnic and religious groups in 165 countries, going back seven decades, to the end of World War II.  The database is called CREG, for Composition of Religious and Ethnic Groups. It’s a project of the Cline Center for Democracy at the University of Illinois.

The Ethnic groups in the United States are AmerIndian (2%), Asian (5%), Black 10%, Hispanic 20%, White 63% (percents are guesses from small graphs)

But which comes first:

1) the ecological cause of the tension from hunger caused by drought, floods, etc, causes in / out groups to form along ethnic or religious lines

OR

2) do the ethnic/religious conflicts happen BEFORE an ecological crisis while everyone is well-fed and the economic system is booming?

Trying to blame everything on political, social, and economic causes is one of the ways that the elite blind ordinary people to the role of natural and energy resources  so that they can plunder resources.

In all times and places, at the height of any empire, people of different religions and ethnic groups from all over the empire and beyond gathered in cities and lived in harmony. If religious / ethnic tensions cause wars, then why doesn’t this happen when times are good?

But it is interesting to try to predict how the violence will play out, so I wonder if this database could be used to predict how in and out groups will form in America after oil shocks have gone on long enough to cause hunger in America. 

Will the Presbyterians attack Catholics? Will recent immigrants be the main target?  Old vs young, rich vs poor, educated vs uneducated?

Or will the 10 million men who have ever been imprisoned form new, or grow existing gangs while right-wing militia form from (former) national guard, military, police, security guards, and  similar professions trained in weaponry?

That’s a common way for violence to unfold, not along religious / ethnic lines.

Even when that appears to be going on,  Jared Diamond’s shows in  “Collapse” that clearly the Hutu/Tutsi violence was triggered by ecology — there were no new farms to be had by young men, who then couldn’t marry which precipitated the violence.  In regions were there were only Hutus, Hutus slaughtered each other.

In other countries:

Hector Abadfeb. Colombia’s Warning for Mexico. New York Times

Libya drifts after ousting prime minister. McClatchy News Service. March 13, 2014. San Francisco Chronicle.

The Coming Anarchy Shattering the Dreams of the Post Cold War. Robert D. Kaplan. 1994. New York Times.

Egypt collapse: declining oil & resources, overpopulation resources

Or will there be a crazy dictator like Hitler, Stalin, Pol Pot who turn citizens against each other as informants, and/or unpredictably (or now predictably with this database?) single out certain groups to be executed/imprisoned/sent to work camps?

Posted in Violence, Who is to Blame? | Comments Off on How will the violence play out in the USA?

Energy return on investment, peak oil, and the end of economic growth

David J. Murphy and Charles A. S. Hall. 2011.

Energy return on investment, peak oil, and the end of economic growth

in “Ecological Economics Reviews.” Robert Costanza, Karin Limburg & Ida Kubiszewski, Eds. Annals of the New York Academy of Sciences 1219: 52–72.

[I’ve rearranged, cut out large chunks, left out most of the charts and graphs, and sometimes paraphrased this very important paper, read the original if you have time for a complete understanding of the model presented. Notice how closely GDP (dashed line) matches energy production below in Figure 1. Energy production and GDP for the world from 1830 to 2000. Data from Kremmer and Smil. 5,6]

Energy vs GDP 1800-2008

Economic growth over the past 40 years has used increasing quantities of fossil energy, and most importantly oil. Yet, our ability to increase the global supply of conventional crude oil much beyond current levels is doubtful, which may pose a problem for continued economic growth. Our research indicates that, due to the depletion of conventional, and hence cheap, crude oil supplies (i.e., peak oil), increasing the supply of oil in the future would require exploiting lower quality resources (i.e., expensive), and thus could occur only at high prices.

This creates feedbacks that can be described as an economic growth paradox: increasing the oil supply to support economic growth will require high oil prices that will undermine that economic growth.

From this we conclude that the economic growth of the past 40 years is unlikely to continue in the long term unless there is some remarkable change in how we manage our economy.

Historically, economic growth has been highly correlated with increases in oil consumption, and, aside from a few short supply interruptions, oil supplies have kept pace with growing demand. As a result, real gross domestic product (GDP) tripled in value while oil consumption grew by 40% from 1970 through 2008. Unfortunately, the oil world of today is much different from the oil world over the past 40 years. Numerous analyses offer evidence that we consider quite convincing that global society is entering the era of peak oil,a that is, the era in which conventional oil supply is unable to increase significantly and will eventually begin to decline.1–3

Oil, more than any other energy source, is vital to economies because of its ubiquitous application as fuels and feedstocks in manufacturing and industrial production, as well as in transportation.

The main conclusions of this paper are:

  1. over the past 40 years, economic growth has required increasing oil production
  2. the supply of high EROI oil cannot increase much beyond current levels for a prolonged period of time
  3. the average global EROI of oil production will almost certainly continue to decline as we search for new sources of oil in the only places we have left—deep water, arctic, and other hostile environments
  4. we have globally roughly 20–30 years of conventional oil remaining at current rates of consumption and current EROIs, and even less if oil consumption increases and/or EROI decreases
  5. increasing oil supply in the future will require a higher oil price because mostly only high-cost resources remain to be discovered
  6. using oil-based economic growth as a solution to recessions is untenable in the long term, as both the gross and net supplies of oil has or will begin, at some point, an irreversible decline

Other points made in this paper:

For the economy of the United States and almost every other nation, the prospects for future, oil-based economic growth are bleak. Maintaining the status quo of growth economics based on an oil energy base is simply not possible for more than a decade or two at most, presuming that trade lines and international politics remain amenable. For the United States, which is currently in the deepest recession since the Great Depression, it seems highly unlikely that oil production can increase enough, for a long enough period of time, to grow the economy from this recession, let alone any future recessions. Furthermore, even if oil production can increase in the near term, the price of oil needed to maintain that production will be high enough on its own to incite a recession. Taken together, it seems clear that the economic growth of the past 40 years will not continue for the next 40 years.

The model also ignores the increasingly important and intricate role that debt accumulation has in the greater energy economy [my comment: which I assume means that a financial system crash would make credit dry up and new energy production projects impossible].

Figure 17 shows a range of dates before exponential decline begins until 2020, after that, and perhaps before, decline will begin.

Energy and Business cycles

Since 1970, spikes in the price of oil have been a root cause of most recessions. For example, in 1973, precipitated by the Arab Oil Embargo, the price of oil jumped from $3 to $12 a barrel (bbl) in a matter of months, creating the largest recession thereto since the Great Depression. The price spike had at least four immediate effects within the economy: (1) oil consumption declined, (2) a large proportion of capital stocks and existing technology became too expensive to use, (3) the marginal cost of production increased for nearly every manufactured good, and (4) the cost of transportation fuels increased.4 On the other hand, expansionary periods tend to be associated with the opposite oil signature: prolonged periods of relatively low oil prices that increase aggregate demand and lower marginal production costs, all leading to, or at least associated with, economic growth.

Numerous theories attempting to explain business cycles have been posited over the past century, each offering a unique explanation for the causes of—and solutions to—recessions, including Keynesian theory, the Monetarist model, the Rational Expectations model, Real Business Cycle models, New (Neo-) Keynesian models, etc.4 Yet, for all the differences among these theories, they all share one implicit assumption: a return to a growing economy, that is, growing GDP, is in fact possible.Historically, there has been no reason to question this assumption, as GDP, incomes, and most other measures of economic growth have in fact grown steadily over the past century. But ifwe are entering an era of peak oil, then for the first time in history wemay be asked to grow the economy while simultaneously decreasing oil consumption, something that has yet to occur within the United States since the discovery of oil.

The objectives of this review are to

  1. examine the degree to which abundant and inexpensive oil is integral to economic growth, and how the future supply of that oil is in jeopardy;
  2. the discourse on peak oil and provide what we believe is both novel and compelling evidence indicating that society is indeed in the era of peak oil;
  3. the discourse on net energy and discuss how searching for new sources of oil may decrease the amount of net energy provided to society and also exacerbate the effects of oil depletion on the economy;
  4. how peak oil and net energy indicate that increasing oil supply will require high oil prices in the future.

Economic growth and business cycles from an energy perspective

Economic growth, from an energy perspective, has many of the same characteristics as the fundamental growth process that every living creature, species, and population on earth undertakes during their lifetime. Energy is captured by a system (the economy or a creature) and allocated first to the maintenance (metabolism) of the system and then, if there is energy remaining, to growth and/or reproduction. For example, each of us must ingest enough food during the growth phases of life to pay not only for our metabolism but also to convert some of the additional food into bone, connective tissue, etc., which is used to grow the body or create offspring. Likewise, the economy must acquire enough energy to pay not only for its metabolism, for example, fighting depreciation of existing capital, but also to pay for the construction of replacement or, sometimes, new capital. The important point here is that the construction of new capital, that is, economic growth, requires the input of “net” energy, which is the energy beyond that required for metabolic purposes.

By extension, for the economy to grow over time there must be an increase in the flow of net energy and materials through the economy. Quite simply, economic production is a work process, and work requires energy. This logic is an extension of the laws of thermodynamics,which state that (1) energy cannot be created nor destroyed, and (2) energy is degraded during any work process so that the initial inventory can do less work.As Daly and Farley describe, the first law places a theoretical limit on the supply of goods and services that the economy can provide, and the second law sets a limit on the practical availability of matter and energy.5 In other words, the laws of thermodynamics state that to produce goods and services, energy must be used, and once this energy is used it is degraded to a point where it can no longer be reused to power the same process again. Thus to increase production over time, that is, to grow the economy, we must either increase the energy supply or increase the efficiency with which we use our source energy.

This energy-based theory of economic growth is supported by data: the consumption of every major energy source has increased with GDP since the mid-1800s (Fig. 1). Throughout this growth period, however, there have been numerous oscillations between periods of growth and recessions. Recessions are defined by the Bureau of Economic Research as “a significant decline in economic activity spread across the economy, lasting more than a few months, normally visible in real GDP, real income, employment, industrial production, and wholesale-retail sales.”10 From 1970 until 2007, there have been five recessions within the United States, and examining these recessions from an energy perspective elucidates a common mechanism underlying recent business cycles: oil consumption tends to be higher during expansions and lower during recessions, and prices tend to be lower during expansions and higher during recessions.

There are a myriad of publications on the topic of whether or not energy consumption causes economic growth.11 Unfortunately, the literature is confounding, due mainly to two issues: energy quality and substitution effects. Energy quality refers to many things, but in the economic sense energy quality pertains mainly to the utility of a fuel, which is a combination of its transportability, storability, energy density, etc. Consequently, the utility of a fuel is reflected in its price, which is why the price per energy unit of coal is much lower than the price per energy unit of electricity, that is, electricity is deemed to have a higher quality. Yet despite this difference in quality, most energy-economic analyses assume that a BTU of coal has the same economic utility as a BTU of electricity. Consequently, the substitution of high-quality energy sources, such as electricity, for low-quality energy sources, such as coal, is often missed.12

Our analysis indicates that about 50% of the changes in economic growth over the past 40 years are explained by the changes in oil consumption alone. In addition, the work by Cleveland et al.12 indicates that changes in oil consumption cause changes in economic growth, or that economic growth is bound by the energy available. These two points support the idea that energy consumption, and oil consumption in particular, is of the utmost importance for economic growth.

Yet, oil consumption is rarely used by neoclassical economists as a means of explaining economic growth.

Thus, we present the hypothesis that higher oil prices and lower oil consumption are indicative of recessions. Likewise, economic growth requires maintaining lower oil prices while simultaneously increasing oil supply. The data support these hypotheses: the inflation-adjusted price of oil averaged across all expansionary years from 1970 to 2008 was $37/bbl compared to $58/bbl averaged across recessionary years, whereas oil consumption grew by 2% on average per year during expansionary years compared to decreasing by 3% per year during recessionary years.

Although this analysis of recessions and expansions may seem like simple economics, that is, high prices lead to low demand and low prices lead to high demand, the exact mechanism connecting energy, economic growth, and business cycles is a bit more complicated. Hall et al. and Murphy and Hall state that when energy prices increase, expenditures are reallocated from areas that had previously added to GDP, mainly discretionary consumption, toward paying for more expensive energy.15,16 In this way, higher energy prices lead to recessions by diverting money from the economy toward energy only. The data show that major recessions seem to occur when energy expenditures as a percentage of GDP climb above a threshold of roughly 5.5% (Fig. 5). It is worth noting, however, that this relation did not hold for the smaller recessions of the early 1990s and 2000s. This is probably a result of the fact that the cost of oil is only one of the many possible causes of—and solutions to—recessions.

What are the implications for economic growth if (1) oil supplies are unable to increase with demand, or (2) oil supplies increase but at an increased price?

Oil is a nonrenewable resource and its supply will, at some point, decline. “Peak oil” refers to the time period when global oil production reaches a maximum rate and then begins to decline–the point at which the world will transition from an expansionist industrial era, characterized by indefinitely expanding oil consumption, to an era defined by declining supplies of oil and all those things we do with oil. Peak oil represents a major problem for the U.S. (and most) economies, as it indicates that oil supplies cannot increase with economic expansion in the long term.

It is not only the quantity of oil that is important, but the cost of that oil. It is our ability to find, develop, and produce that oil for a reasonable energy and hence monetary cost that makes it so useful. Net energy is defined as the amount of energy remaining after the energy costs of getting and concentrating that energy are subtracted.19 The economy gains zero net energy if we have to use just as much energy to develop a resource as we will garner from producing that resource.

Clearly, energy resources that produce a high level of net energy are considered to be of higher value than those that produce a small amount of net energy.

[Large snip of explanation of Hubbert’s peak and evidence of declining oil production]. Most of the easy-to-find and easy-to-produce oil has already been found and produced.3 Global oil discoveries peaked during the 1960s and have declined steadily since. In addition to finding less oil, new discoveries are located increasingly in areas that are geologically harder to produce, such as deep offshore areas. Discoveries in deepwater areas increased from under 10% of total discoveries in 1990 to nearly 60% by 2005. These three lines of evidence suggest that society is entering the era of peak oil. Note, we are simply stating that the evidence indicates that oil supplies were constrained from 2004 to 2008, and that the most likely explanation is that the supply of conventional crude oil is nearing (or possibly past) its peak. Other explanations for the constraint in oil supply from 2004 to 2008 is a lack of investment in infrastructure from the oil industry, but we could not find much evidence to support his claim, especially considering the large investments made into the oil sands and deepwater exploration during this period.

Peak Oil Deniers — a Rebuttal

Technology only delays the inevitable

Even if technology enables us to extract more oil than expected, this would only delay the issue of peak oil, not change it.  Bartlett calculates that for every additional billion barrels of oil we find beyond two trillion barrels delays the peak in global oil production by only 5.5 days. 24

Discovery of new oil fields has declined since 1948

But we can’t get enhanced recovery or produce more oil from fields we can’t find.  Global discoveries have been in a steady decline since the peak in 1948 despite advances in technology. Others argue that as the price of oil increases, known sources of oil that were previously too expensive to develop will become economical. To some extent this is true: oil sand development in Canada, for example, is expensive and economically feasible at high oil prices only. However, the oil sands are not conventional oil sources and are not new discoveries, and are already incorporated into many models of future oil supply. 3

There is no alternative energy that can replace oil

There is no substitute for conventional oil that is of the same quantity, quality, and available for the same price.

The closest substitutes for conventional oil currently in large-scale production are the oil sands of Canada and biofuels, produced mainly from corn and sugarcane. The oil sands present a vast amount of potential energy, but it is in a less accessible form than conventional oil. The oil sands must be heated and refined just to form crude oil and then refined further to form the various crude oil derivatives. Estimates from Cambridge Energy Research Associates show that the cost of production for the oil sands is roughly $85/bbl,which is more than double the average price of oil during expansionary periods ($37/bbl).38 The usual assumption is that the oil sands will be rate limited, not resource limited, because of their large demands for water and natural gas and their large environmental impacts.3 So, even though there are large amounts of potential energy, production of oil sands cannot be increased enough to offset a large decline in conventional oil production.

Biofuels have zero net energy: as much energy to produce as they deliver

Biofuels are recent plant material that has been converted through some combination of chemical and/or thermal processes into a liquid fuel. The main fuel products from these processes are biodiesel, or more commonly ethanol. There are many reasons why alcohols do not produce as good fuel as gasoline, and we present here two. (1) the energy density of ethanol is only about two-thirds that of gasoline. (2) the energy contained within the biofuel product is nearly the same as the energy used to produce the biofuel–roughly zero net energy to society.39–43 Oil produces roughly 18 units of energy per unit invested, and gasoline roughly 10 units per unit invested.44,45 Therefore gasoline and biofuels are imperfect substitutes and place doubt on their ability to replace oil.

It takes a very long time to construct the infrastructure to move from one source of primary energy to another

Marchetti analyzed the time it took global society to transition from wood to coal and subsequently from coal to oil and found that it takes about a century for society to increase its adoption of a primary energy substitute from 1% to 50% of market capacity.46 Thus, even if society adopts alternative energy quickly, it will still take decades to substitute for just half of the oil use in the world.

Hirsch et al. came to a similar conclusion when examining the specific strategies that the United States might take to mitigate its oil dependence.47 They examined numerous, large-scale methods by which the United States could substitute for conventional oil, including: (1) conservation—implementing higher efficiency energy equipment, that is, high mileage automobiles; (2) gas-to-liquids; (3) fuel switching to electricity; and (4) coal liquefaction. Their main conclusion is that “waiting until world oil production peaks before taking crash program action leaves the world with a significant liquid fuel deficit for more than two decades”(p. 59).47

The True Value of Energy to Society is the Net Energy

[snip of explanation of EROI vs net energy]

A shift from easy-to-access oil to hard-to-access oil is changing the net energy delivered to society and how this may exacerbate the effects of peak oil on economic growth.

Gagnon et al. report that the EROI for global oil extraction declined from 36:1 in the 1990s to 18:1 in 2008.44 This downward trend results from at least two factors: First, increasingly supplies of oil originate from sources that are inherently more energy intensive to produce, simply because firms develop cheaper resources before expensive ones. For example, in 1990 only 2% but by 2005 60% of discoveries were located in ultra-deepwater locations (Fig. 10).

Enhanced oil recovery techniques increase production short term, but significantly increase the energy used in production, offsetting much of the energy gain for society

Enhanced oil recovery techniques are being implemented increasingly in the world’s largest conventional oil fields. For example, nitrogen injection was initiated in the once super giant Cantarell field in Mexico in 2000, which boosted production for 4 years, but since 2004, production from the field has declined precipitously.

Summary of net energy. The EROI for global oil production is declining, so maintaining the flow of net energy to society given declining EROIs will require an increase in the extraction of gross energy, accelerating the depletion of oil. This means that it will be very difficult to offset peak oil by finding and developing new, low EROI fields because new fields must produce enough oil to not only match the depletion of the existing field stock but also to overcome the decline in EROI.

We have anywhere between 20 and 30 years of conventional oil remaining at current levels of consumption

Or less if China, India, or the 200,000 new people born every day increases consumption.

Peak oil, net energy, and oil price

Low EROI oil indicates that there will be high oil prices in the future. Forecasting the price of oil, however, is a much more difficult endeavor as oil price depends, in theory, on the supply and demand for oil at a given moment in time. What we can examine with some accuracy is the cost of production of various sources of oil, in order to calculate the price at which different types of oil resources become economical. In theory, if the price of oil is below the cost of production, then most producers will cease operation. If we examine the cost of production in the areas in which we are currently discovering oil, hence the areas that will provide the future supply of oil, we can calculate a theoretical floor price below which an increase in oil supply is unlikely.

Roughly 60% of the oil discoveries in 2005 were in deepwater locations. Based on estimates from CERA,38 and the cost of developing that oil is between $60 and $85/bbl, so oil prices must be over $60/bbl to support the development of even the best deepwater resources. The average price of oil during recessionary periods has been $57/bbl, so it seems that increasing oil production in the future will occur only at recessionary prices. All of this indicates that an expensive oil future is necessary if we are to produce the remaining oil resources, and, as a consequence, the economic growth witnessed by the United States and globe over the past 40 years will be difficult to realize in the future.

Since EROI is a measure of the efficiency with which we use energy to extract energy resources from the environment, it can be used as a rough proxy to estimate whether the cost of production of a particular resource will be high or low. For example, the oil sands have an EROI of roughly 3:1, whereas the production of conventional crude oil has an average EROI of 18:1. The production costs for oil sands are roughly $85/bbl compared to $20/bbl for Saudi Arabian conventional crude.38  Therefore, as oil production continues, we can expect the cost of oil extraction to increase.

Read the full article here:

Energy return on investment, peak oil, and the end of economic growth


References

1. Deffeyes, K.S. 2001. Hubbert’s Peak: The Impending World Oil Shortage. Princeton University Press. New Jersey.
2. Campbell, C.J. 1997. The Coming Oil Crisis. Multi-Science Publishing Company and Petroconsultants. Essex, UK.
3. Campbell, C.J. & J.H. Laherrere. 1998. The end of cheap oil. Sci. Am. 278: 78–83.
4. Knoop, T.A. 2010. Recessions andDepressions:Understanding Business Cycles. Praeger. Santa Barbara, CA.
5. Kremmer. 2010. Historic population and GDP data. http://www.historicalstatistics.org/ (accessed November 24, 2010).
6. Smil, V. 2010. Energy Transitions: History, Requirements, Prospects. Praeger. Santa Barbara, CA.
7. Federal, R. 2009. St. Louis Federal Reserve. http:// research.stlouisfed.org/fred2/series/CPIAUCNS (accessed March 15, 2009).
8. Hayward, T. 2010. BP Statistical Review of World Energy. British Petroleum. London, UK.
9. Daly, H.E. & J. Farley. 2003. Ecological Economics: Principles and Applications. Island Press.Washington, DC.
10. NBER. 2010. US Business Cycle Expansions and Contractions. National Bureau of Economic Research. http://www.nber.org/cycles/cyclesmain.html (accessed July 10, 2010).
11. Karanfil, F. 2009. How many times again will we examine the energy-income nexus using a limited range of traditional econometric tools? Energy Policy 37: 1191–1194.
12. Cleveland, C.J., R.K. Kaufmann & D.I. Stern. 2000. Aggregation and the role of energy in the economy. Ecol. Econ. 32:301–317.
13. Stern, D.I. 2000. Amultivariate cointegration analysis of the role of energy in the US macroeconomy. Energy Econ. 22: 267–283.
14. Stern, D.I. 1993. Energy use and economic growth in the USA, a multivariate approach. Energy Econ. 15: 137–150.
15. Hall, C.A.S., R. Powers & W. Schoenberg. 2008. Peak oil, EROI, investments, and the economy in an uncertain future. In Biofuels, Solar and Wind as Renewable Energy Systems:
Benefits and Risks. D. Pimentel, Ed.: 109–132. Springer. The Netherlands.
16. Murphy, D.J. & C.A.S. Hall. 2010. Year in review—EROI or energy return on (energy) invested. Ann. N.Y. Acad. Sci. 1185: 102–118.
17. EIA. 2009. Energy Information Administration. http:// tonto.eia.doe.gov/dnav/pet/petÿconsÿtop.asp (accessed October 21, 2009).

18. BEA. 2009. Bureau of economic analysis. http://www. bea.gov/industry/gpotables/gpo action.cfm?anon=865 (accessed July 12, 2009).
19. Odum, H.T. 1973. Energy, ecology, and economics. Ambio 2: 220–227.
20. Hubbert, M.K. 1956. Nuclear energy and the fossil fuels. Spring Meeting of the Southern District Division of Production, San Antonio, Texas.
21. Edwards, J.D. 1997. Crude oil and alternate energy production forecasts for the twenty-first century: the end of the hydrocarbon era. Bull. Am. Assoc. Pet. Geol. 81: 1292–1305.
22. Ivanhoe, L.F. 1997. King Hubbert—updated. Colo. Sch. Mines 97: 1–8.
23. MacKenzie, J.J. 1996. Oil as a finite resource: when is global production likely to peak?World Resources Institute.Washington, DC.
24. Bartlett, A.A. 2000. An analysis of U.S. and world oil production patterns usingHubbert-style curves.Math.Geol. 32:1–17.
25. Lynch, M.C. 2002. Forecasting oil supply: theory and practice. Q. Rev. Econ. Finance 42: 373–389.
26. Lomborg,B. 2001.Running on empty. TheGuardian, August 16.
27. Heinberg, R. 2003. The Party’sOver.New Society Publishers. Gabriola Island, BC, Canada.
28. Downey, M. 2009. Oil 101.Wooden Table Press. New York.
29. Hirsch, R.L. 2008. Mitigation of maximum world oil production: shortage scenarios. Energy Policy 36: 881–889.
30. Dargay, J.M. & D. Gately. 2010. World oil demand’s shift toward faster growing and less price-responsive products and regions. Energy Policy 38: 6261–6277. 31 Harper, F. 2004. Oil Peak—A Geologist’s View. Energy Institute. London, UK.
32. Jackson, P.M. 2009. The Future of Global Oil Supply. Cambridge Energy Research Associates. Cambridge, MA.
33. Intenational Energy Agency 2009. World Energy Outlook 2009.
34. McKinsey. 2009.AvertingtheNextEnergyCrisis:TheDemand Challenge. McKinsey Global Institution. New York.
35. Barnett, H. & C. Morse. 1963. Scarcity and Growth: The Economics of Natural Resource Availability. Johns Hopkins University Press. Baltimore.
36. Nordhaus, W.D. & J. Tobin. 1973. Is growth obsolete. In TheMeasurement of Economic and Social Performance, Studies in Income and Wealth. M. Moss, Ed.: 509–532. NEBR. Cambridge, MA.

37. Solow, R.M. 1974. The economics of resources or the resources of economics. Am. Econ. Rev. 64: 1–14.
38. CERA. 2008. Ratcheting Down: Oil and the Global Credit Crisis. Cambridge Energy Research Associates. Cambridge, MA.
39. Murphy, D.J., C.A.S. Hall & B. Powers. 2011. New perspectives on the energy return on (energy) investment (EROI) of corn ethanol. Environment, Development and Sustainability 12: 179–202.
40. Farrell, A.E., R.J. Plevin, B.T. Turner, et al. 2006. Ethanol can contribute to energy and environmental goals. Science 311:506–508.
41. Hammerschlag, R. 2006. Ethanol’s energy return on investment:
a survey of the literature 1990—present. Environ. Sci. Technol. 40: 1744–1750.
42. Patzek, T. 2004. Thermodynamics of the corn-ethanol biofuel cycle. Crit. Rev. Plant Sci. 23: 519–567.
43. Pimentel, D. & T.W. Patzek. 2005. Ethanol production using corn, switchgrass, and wood; biodiesel production using soybean and sunflower. Nat. Resour. Res. 14: 65–76.
44. Gagnon, N., C.A.S. Hall & L. Brinker. 2009. A preliminary investigation of the energy return on energy invested for global oil and gas extraction. Energies 2: 490–
503.
45. Cleveland, C. 2005. Net energy from the extraction of oil and gas in the United States. Energy 30: 769–782.
46. Marchetti, C. 1977. Primary energy substitution models: on the interaction between energy and society.Technol. Forecast. Soc. Change 10: 345–356.
47. Hirsch, R.L., R. Bezdek & R. Wendling. 2005. Peaking of World Oil Production: Impacts, Mitigation, and Risk Management. SAIC.McLean, VA. pp. 1–91.
48. Giampietro, M. & K. Mayumi. 2010. Assessing the quality of alternative energy sources: energy return on investment and the metabolic pattern of societies and energy statistics. ICTA Technical Report.
49. Giampietro,M.&K.Mayumi. 2008.Complex systemsthinking and renewable energy systems. In Biofuels, Solar and Wind as Renewable Energy Systems: Benefits and Risks. D. Pimentel, Ed.: 173–214. Springer. New York.
50. Giampietro, M. & K. Mayumi. 2009. The Biofuel Delusion:
The Fallacy Behind Large-Scale Agro-Biofuels Production. Earthscan Research. London, UK.
51. Campbell, C. 2005. The dawn of the second half of the age of oil.ASPONews Letter. http://www.peakoil.ie/newsletter/479 (accessed July 7, 2010).


Posted in Charles A. S. Hall, EROEI Energy Returned on Energy Invested, EROEI remaining oil too low, How Much Left, Peak Oil, Scientists | Comments Off on Energy return on investment, peak oil, and the end of economic growth

The case for Gold

Gold, Infinite Debt, and the Problem of Capital Storage: Has The Hotelling Moment Arrived?

March 9, 2011 Gregor Macdonald

One of the reasons that gold retains its competitiveness as a capital-storage unit is the rather slow and plodding rate at which supply is brought to market. Since 1900, compound annual growth of world gold production comes in at 1.163%. That particular rate is below the growth rate for a number of other natural resources. But in particular: it’s well below the rate of credit production–the “resource” which now plagues the developed world. Indeed, the over-production of credit the past twenty-five years has once again driven capital back into hard assets such as gold. This brings up an intriguing subject: the conversion of resources into financial capital, and the conversion of financial capital back into resources. First, let’s take a look at a century of gold production. | see: World Gold Production in Metric Tons 1900 – 2009.


From 1980-2000 global gold production grew at a strong, compound annual growth rate (CAGR) of 3.836%. But that was after a very slow production rate for forty years, between 1940 and 1980. In the past decade global production of gold has not only slowed again but fallen steadily, with a notable uptick in 2009 as the decline temporarily reversed. Indeed, since the new millennium, the story of gold will be familiar to those who have watched oil: as prices steadily rose, supply growth fell.

The migration of capital, between the world of natural resources and the world of finance, has been addressed by any number of thinkers, one of the more compelling being Harold Hotelling. Writing in the Journal of Political Economy in 1931, Hotelling proposed that a rational producer of resources would only be inclined to extract and sell that resource if the investment opportunities available with the capital proceeds were greater than simply leaving that resource to appreciate in the ground. So, given Hotelling’s theory of resource extraction, what has happened to gold production since the year 2000? Does the chart reflect geological and cost limits to increasing gold production, even as the price rose from $250.00 to $1000.00 per ounce? Or, has there been some moderate yet gathering decision on the part of global gold producers to extract gold more slowly? After all, why extract gold to merely convert gold into paper currency, beyond the need to pay for the cost of production and provide, say, a dividend to shareholders? In other words, at the rate at which the price has been rising, why hurry to extract the gold?

These same questions have long been asked in the world of energy extraction as well. Why did global oil production advance so quickly into late 2003 as the oil price was rising towards the high 30′s, only to peak out for the past six years as price skyrocketed? We must assume that oil producers in the West, governed mostly by for-profit enterprises, were doing everything possible to lift production. The conclusion is rather easy: they couldn’t lift production, even with a doubling of price. But in contrast to BP, Shell, Exxon, Total, Chevron, and Conoco, what about the NOCs–the National Oil Companies? Is it possible they were inclined to apply some form of scarcity rent, holding back production slightly? Echoing statements made at least twice last decade, King Abdullah of Saudi Arabia repeated himself last Summer when he remarked about future Saudi oil production: “I told them that I have ordered a halt to all oil explorations so part of this wealth is left for our sons and successors God willing.” | see: Global Crude Oil Supply 2002 – 2010 in mbpd (updated through November 2010)

As lovely and reasonable a view offered by Hotelling in his The Economics of Exhaustible Resources, there is little evidence that oil producers are any more rational than individuals. The history of global oil production would appear to be governed more by geology, than any future projections of how to best invest oil revenues. North Sea oil was largely extracted in the cheap oil era, and peaked as oil prices began to take off earlier last decade. This was also true for Indonesia, and of course several decades before with the United States. Indeed, the bulk of world oil production was sold too cheaply. I discussed this phenomenon in my 2009 piece, The Fate of An Oil Exporter. By contrast, one of the few modern states that has spoken openly about husbanding scarce energy resources is Brazil. President Lula declared in 2009, as Brazil changed its resources policy that year, that the country’s new offshore discoveries were a “passport to the future.” Misunderstood by right-leaning commentary at the time as a form of resource-nationalism, Lula’s remarks were instead very much in the Hotelling vein. “We don’t have the right to take the money we’re going to get with this oil and waste it,” Lula remarked. But Brazil has been an exception.

Given that both gold and oil production are now either flat or falling, what should a producer of these two commodities do with the proceeds of their sales? Let’s again consider the insurmountable problem at hand. Western economies and especially the United States have been on a credit binge for decades. When that bubble burst in 2008, punctured in large part by rising energy prices, the response from OECD governments was to create more credit. In Eric Zencey’s terrific New York Time’s essay on Frederick Soddy, which captured the views of the 1921 Nobel Laureate, the connection between debt limits and energy supply was made plain for a general readership:

Problems arise when wealth and debt are not kept in proper relation. The amount of wealth that an economy can create is limited by the amount of low-entropy energy that it can sustainably suck from its environment — and by the amount of high-entropy effluent from an economy that the environment can sustainably absorb. Debt, being imaginary, has no such natural limit. It can grow infinitely, compounding at any rate we decide.

Whenever an economy allows debt to grow faster than wealth can be created, that economy has a need for debt repudiation. Inflation can do the job, decreasing debt gradually by eroding the purchasing power, the claim on future wealth, that each of your saved dollars represents. But when there is no inflation, an economy with overgrown claims on future wealth will experience regular crises of debt repudiation — stock market crashes, bankruptcies and foreclosures, defaults on bonds or loans or pension promises, the disappearance of paper assets.

To Soddy’s point on the problem of infinitely created debt, let’s take a look at 60 years of debt growth in the United States. | see: Total Credit Market Debt Owed 1940 – 2010 (updated through December 2010).

As the United States has now (long) embarked on a massive dollar devaluation program, in part to bust the CNY-USD peg, but mostly to mitigate the next leg down in real-estate and debt deflation, we should consider how resource extractors might behave in such an environment. Two obvious possibilities are as follows. First, oil producers rather than chasing higher prices in dollar-terms might start to demand full or partial payment in gold. Meanwhile, gold producers might consider banking some of their capital not in cash, but also in gold. And yes, both oil and gold producers could simply leave more of the stuff in the ground. What may become more clear is that, beyond the need for operational cash, turning excess production of resources into paper currency will increasingly become, per Hotelling, a losing proposition.

Data Sources:

USGS Historical Statistics for Mineral and Material Commodities in the United States (includes global data).

Economic Research: Federal Reserve Bank of St Louis.

Posted in Gold & Silver | Comments Off on The case for Gold