Oakland Depletion Protocol

Oakland, California:  Local Depletion Protocol

By Alice Friedemann

Latest revision February 21, 2006

Note: I’ve been adding to this as time permits since April 2005, as I read about the history of agriculture, transportation, etc.  This was first posted July 22, 2005 in yahoo group energyresources.   Clearly engineers, organic farmers, and others with detailed knowledge in infrastructure and farming need to be brought in to the discussion as soon as possible.

We’re at or near the peak of global oil production. Fossil fuels like oil, natural gas, and coal make everything we depend on possible – growing and distributing food, clean water, electricity, transportation, manufacturing, and so on.  From now on, the cost of energy will inexorably rise.  It’s not clear how an economic system based on endless growth the past two centuries will handle a shrinking economy, where debts can’t be counted on to be repaid.

There are no substitutes for fossil fuels ready to step in.  Even if Robert Hirsch’s stopgap measures were constructed, it would take decades to implement.[1]   Long-term, the only possible energy source that could replace fossil fuels is fusion, and that is not ready now and probably never will be.[2]

The time to prepare is now, while times are good, while there is still cheap energy available, and we still have highly-educated engineers who can design the infrastructure we’ll need as we descend from oil, natural gas, and coal back to the age of wood.

A protocol for fossil fuel depletion has been written at a global level.[3]  This protocol asks each country to reduce its imports of fossil fuels to match the current World Depletion Rate.  The stakes are very high — if every nation follows these guidelines, we may be able to avoid a world war over the remaining oil fields.

But such a protocol must actually be implemented at local levels.  Oakland needs to consider how it might be done here.

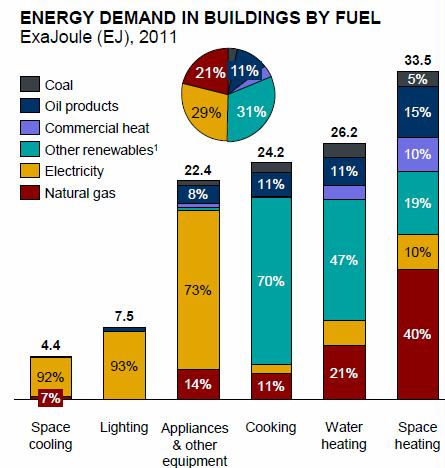
The basic needs that need to be met are food, clean water, shelter, garbage and sewage disposal, and a heat source to cook with (and purify water).

Food

One possibility is to have Oakland residents grow their own food, because it will become very expensive as the costs of growing and transporting it continue to rise.  Plus it will be unavailable in grocery stores at times when shelves are emptied when events like oil shocks, pandemics, or earthquakes strike.

Oakland has 425,000 people in 60.25 square miles, or 38,560 acres, giving each person 3,950 square feet of land if every road, building, driveway, parking lot, and sidewalk were scraped off the land.   The flatlands of Oakland used to consist of farms, but as you can see below, the average residential area is very built up and has little land available.
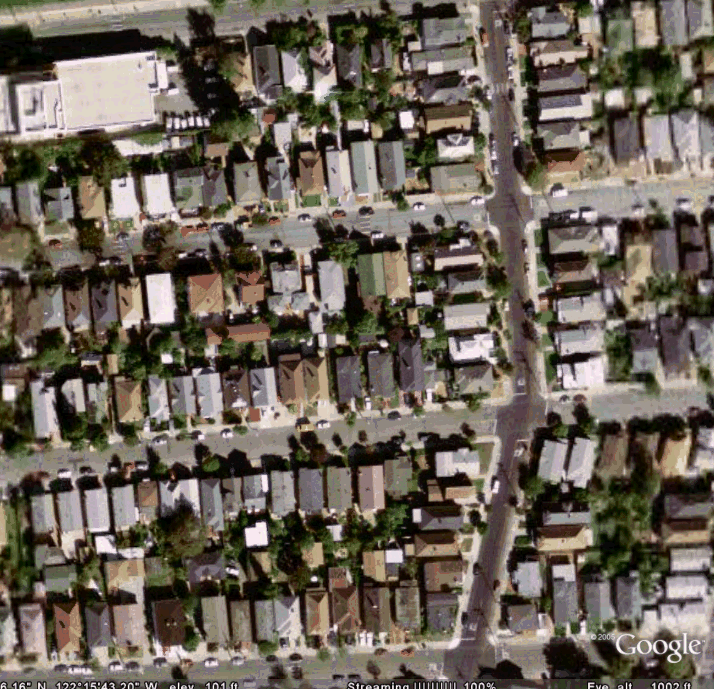
OaklandDepletionProtocol too much concrete


The land that’s still open may have one or more of these additional problems:

1)      Industrial land is often polluted with heavy metals and chemicals.  This makes it difficult and even impossible for plants to grow, and potentially toxic.  Homeowners use even more chemicals on their gardens and lawns than industrial agriculture.

2)      Land that’s too steep, because such land has thin topsoil which is quickly eroded.

3)      Land too forested or rocky to grow anything.

4)      Land near a freeway may have dangerous levels of lead.

5)      A large percentage of Oakland residents live in apartments with no yards.  Land that could be turned into community gardens and orchards often isn’t within walking distance.

6)      There’s no summer rain, and potential winter droughts.

7)      Crops need sunshine, much of the land available is shaded by buildings or trees.

8)      There’s not enough public or private water storage, and pumping can’t be counted on since this is very energy intensive.  Nor would it make sense to deliver the enormous amounts of water agriculture requires here rather than the fertile Central Valley.

9)      The cemeteries in Oakland take up about 400 acres of land, but much of it is not level, and embalming chemicals might make it an unsafe place to grow food.

10)  Although some people may have roofs strong enough for roof top gardens, most are too steep or weak to support heavy soils.  Use of vermiculite and peat moss would lighten the soil load, but these are both expensive and energy intensive.

The largest areas appropriate areas available are golf courses, the land around Lake Merritt, and school yards.  Over time, perhaps some of the brown fields could be reclaimed by heaping green waste on top, and letting it break down into compost, but it would take many years.  It would be best to remediate these areas now.

The method of farming requiring the least amount of land is John Jeavons “Bio-intensive Mini-farming”,[4] which requires an average of 4,000 square feet per person (more if the soil quality is poor or there is less than 20 inches of rainfall).  It takes ten years to learn how to farm this way, because it requires a variety of skills: detailed planning to always have a wide variety of crops in the ground (to prevent erosion and organic pest control); composting, seed harvesting, knowing what grows well in the local micro-climate, and so on.  Also, it takes years to double-dig the soil two feet deep, add organic matter, and to build up proper soil structure.

Around 90% of the land in Oakland is not available to grow food, leaving an average of 500 square feet per resident, and it’s likely only a very small percent of this land consists of deep level soils with the nutrients and structure for growing crops.

What can be done

The best hope for Oakland is planting as many fruit and nut trees as possible, which would provide more high-quality calories per square foot than any other crop.  There are many groups in the Bay Area that can help choose which kinds would work best in this climate, such as the California Rare Fruit Growers, the University of California, the Merritt Landscaping department, Master Gardeners, Permaculturists, etc. These experts might also be able to estimate what percent of Oakland’s food needs could be met, how to prevent droughts from killing orchard trees, how to use integrated pest management to minimize bugs and disease, the best ways to keep squirrels and birds from taking most of the crop, provide cuttings to graft multiple varieties onto trees to spread fruit crops out over time, calculate how much water would be required, etc.

Community, school, and home gardens should be encouraged.  High quality soil can be brought in now, and continually enriched with compost.   The compost can come from yard trimmings, leaves, kitchen scraps, and so on, which is currently taken over sixty miles to be composted.  Garbage collection has always been a huge problem for cities to solve, so as energy declines, it will become critical to find ways to recycle waste locally as much as possible, and at least the “green waste” can be used to build up existing soil.  Parking lots should be depaved as soon as possible to give the soil time to recover from compaction and enriched with green waste and compost to improve soil structure and nutrition.

Hills residents will be eager to own goats, not only for their milk, but to keep the fire hazard down.  Anyone who can afford to feed chickens and ducks should be encouraged to do so.

Food from the Central Valley

The central valley provides over a third of the food for the United States.

Ten calories of fossil fuels are used to grow one calorie of food now, so as energy declines, growing and distributing food will cost more.  Part of this energy is due to nitrogen-based fertilizers, which use natural gas as a feedstock and energy source to make.  Natural gas has peaked in North America and is a more immediate challenge than the depletion of oil.

Nitrogen fertilizers do tremendous damage to the environment – they poison drinking ground water and have made bodies of water, like the Gulf of Mexico “dead via eutrophication — areas become so deprived of oxygen that fish can’t survive.  But these fertilizers have also allowed us to grow up to five times as much food, and not have to grow food on marginal land that would quickly erode if used for agriculture.

The food that can be produced in the Central Valley is going to further decline because all of the models for global warming show less water being available to grow crops in the future.   This will result in a shorter growing season, and the increased heat will make crops transpire more, requiring even more water.

One of the reasons there will be less water is due to early snow melt in the Sierras.  Now the snow melts over a long period, continually releasing water to reservoirs that feed agriculture so crops can be grown in some places year round, and everywhere there is a longer growing season.  But if the snow all melts suddenly in January and February, we don’t have, and can’t build, the reservoirs to contain this water, so it will have to be released.

But even if water is released during the winter as snow melts months earlier than usual, there will be years of extreme rainfall and snow melt which could cause massive flooding beyond anything we’ve ever experienced, and take out some of the levee system in the San Joaquin delta.  This would harm the drinking water for 18 million Californians.[5]   It would also take away four percent of the crops grown in the state.   The levees will be taken out one way or another, if not by winter flooding, then by rising sea levels.

When the levees go, this will be devastating for Oakland, because historically farmers in the delta region floated produce to Bay Area cities[6].  This region grows more variety of crops than any other region in California, and has the richest soils.  More food can be floated out on the tides and currents than could be done with trains and trucks.

California has a Mediterranean climate – rain does not fall in the summer when crops need water most.  So irrigation water is used, which requires pumping water.  That is a very energy intensive process, so as energy declines, there will be areas that won’t be able to be farmed anymore.

Irrigation also salinizes the soil.  There are already areas in the central valley that can’t be farmed because they’ve become too salty.

Recently, ice cores drilled in Greenland, the Himalayas, and other glaciers have revealed that the past ten thousand years have had the most stable weather in the past 150,000  years.   This is what may have even allowed us to develop agriculture and civilization.   Before then, what prevailed was extreme weather – droughts, flooding, early and late frosts, violent storms – problems that made reliable harvests impossible.  As food production becomes increasingly local, and the effects of global warming induce more extreme weather, bad harvests will have greater impacts.

Oakland is a city with a port, so it’s possible for food to be imported, because ships, especially sailing vessels, will continue to be able to ply the sea.  But the current infrastructure is built for container ships.  As we stair-step downward, there will be a need for engineers to anticipate the next leg down, and to have built two-mile long piers jutting out into the bay to receive thousands of sailing vessels, sloops, barges, and smaller, non-containerized ships.  At some point it will be a good idea to take an acetylene torch to container ships and recycle them into smaller boats.

There was a time when California’s rivers were navigable by steamboats far into the central valley, for example, as far as Redding on the Sacramento river.  But during the gold mining era, sediment clogged the rivers and to this day they remain non-navigable by larger ships.  And even in the 19th century, there were times when the rivers ran too low for steamship travel.

The first steamships to ply the delta to Sacramento and Stockton burned wood cut down by farmers to grow crops, typically 40 cords of wood per day.  When the wood ran out, coal imported from Australia was burned.  Although California has some coal deposits, it is of such poor quality that it can’t be used to power steamships and trains.   And we certainly don’t have enough wood to ever power steamships or trains again.

As we lurch backward through time, it behooves engineers now to be thinking about how ships and trains could burn coal without emitting greenhouse gases, and how to even get coal here in the first place.  Australia is still probably the best bet, because 40% of trains are currently hauling coal to power plants and are not able to keep up with the demand.  These trains never climb more than a 2% grade, so getting coal to California overland is probably more expensive than shipping it from Australia.  If there’s any coal to ship – China may decide that they want Australian coal all to themselves, and we’ve provided China with enough scrap metal to build warships for them to enforce that edict.

Because coal is also a finite fossil fuel, which will deplete within fifty years of less if turned to as an alternative to oil, planners need to be preparing for the next step down the energy ladder way ahead of time.

Clearly at some point horses, oxen, and other large animals will be required, not only to haul freight but for the nitrogen in their manure.  Since they each require an average of six acres of land to be fed, and it takes a team of ten horses or mules to haul up to 9 tons of cargo five miles a day on level ground (ref 6), a great deal of land and beasts will be required if we resort to animal power.  A truck can haul 30 tons of cargo 500 miles a day.   If the 6 million residents of the Bay area eat three pounds of food a day, that’s 18 million pounds of food, or 9,000 tons that needs to be delivered.  Which would take 10,000 horses (1,000 teams of ten horses) for each five mile segment required to haul farm produce to the nearest train or port.  And at each five mile stop, there needs to be food and water for the animals and drivers.

The alternative of course, is that humans become the beasts of burden, quite likely since there isn’t enough land to feed both animals and people.  The website www.bikesatwork.com has a calculator for how much cargo a bicyclist can haul.  When I plugged some numbers in, I found that a 200 lb person with no grade and steady output could haul 437 lbs at 5 mph (for how far in a day I don’t know).  If they can haul 437 pounds to a train or port in a day, you’d need 41,000 bicyclists.

Even in the past when there were a lot fewer people, mile-long horse jams would occur at ports and other loading places, so someone needs to consider how that could be prevented with our need to haul orders of magnitude more food to more people.

Continuing to use our road systems requires rubber wheels, iron wheels would quickly rip up the roadways.[7]  Roads require a great deal of energy to construct and often are constructed with oil as a feedstock (the bitumen in asphalt).

If we bring the people to the food, do we build skyscrapers so as to minimize the land taken up?  How high could you build them given that people would be going up stairs and not using elevators?

There are several problems that could interfere with such a food delivery system in the future:

1)      Problem: Failure of the San Joaquin levee system from many causes: earthquake, massive floods from early snow pack melting, sea level rise, act of terrorism, or even beavers (e.g. Jones Tract Levee in 2004), which would not only destroy some of the best farmland in the nation.

Solution(s): diversify food supply by getting produce from farms along the coast and imported food (container ships are as fuel-efficient as trains).  The city of Oakland should own a mix of sail and shallow draft boats that can navigate the Delta water ways regardless of whether the levees are standing to be in a position of delivering food to its citizens.   Strengthen the infrastructure delivering water from the Mokelumne watershed so that levee failure doesn’t impact our drinking water.

2)      Problem: There are millions of people living in the Central valley who are much closer to farms than Oakland is, so much of the produce might be sold before getting here.

Solution(s): trade seafood and internationally imported products for food from the central valley.

3)      Problem: As automated harvesting equipment lies idle during energy shortages, an even larger agricultural workforce will need to come in to harvest the crops, and they will need to eat, which will cut back the amount of food that can be shipped out. Since transportation will be a large problem in the future, these workers will tend to live locally and be far less mobile than today’s farm workers.

Solution(s): Oakland owned farms that Oakland residents can seasonally reside at during planting and harvesting seasons.  Which would help solve the massive unemployment and bread line problems.

4)      From two to five times as much food is grown with fossil fuel based fertilizers, pesticides, herbicides, and fungicides as could otherwise be grown otherwise, so as fossil fuels decline, so too will food production decline.

Solution(s): start training and requiring central valley farmers to use organic bio-intensive methods, which can produce as much food as industrial agriculture does now for most crops. These special methods will allow the soil to last for thousands of years, instead of the hundreds or less of the current destructive methods.   This style of farming is very labor intensive, but since there will be so many hungry, unemployed people, this could be seen as a blessing rather than a problem.

5)      California provides nearly all of America’s almonds and enormous percentages of other fruit and nut crops.[8]  Fruit and nut trees are particularly vulnerable to pests because there are so many species that prey on them, brought in from all over the world.[9]  Therefore, fruit will be difficult to grow organically.  Also, fruit crops tend to ripen all at once, depend on refrigeration, and need to be extremely well-coordinated in their shipping and distribution to arrive before rotting. In a world with less energy, fruit will no longer be able to be shipped across the United States as it is now, and as energy declines, it will be difficult to deliver it even to California cities in time.

Solution(s):    The university system needs to receive more grant money to study Integrated Pest Management, how to create healthy soils, and so on to fight off pests naturally.  More grain, and less produce, will need to be grown in the  future.

6)      If an adequate amount of produce does make it to Oakland, more people will move here from regions of the United States with little food or extremely hot and cold weather, which at some point will make it difficult to buy food again here.

Solution(s):  extremely high taxes on anyone with more than one child, no more development, lowered immigration numbers into the United States, limit the population of Oakland to 400,000 people, and as people leave or die, try to bring the population down to a more sustainable one of 100,000 or less.[10] [11]

7)      To the extent that thieves, pirates, and other brigands attempt to steal produce before it reaches Oakland, supplies will even be further diminished.  This sort of crime will discourage farmers from even trying to market their produce this far away.

Solution(s): Make food distribution as fair as possible to minimize the need for extra security forces.  Try to get some regional planning going by giving more power to the regional agencies to enforce civil order throughout the state.

8)      The rest of the United States and the world will be offering more money for California food than many Oakland residents will be able to pay.  There may be a policy of the federal government to sell food for oil and natural gas, and China has enough of a surplus trade with the USA at this point that they could afford to buy all of our grain.

Solution(s): What’s the point of having a government if it doesn’t protect its citizens?  Try to enact laws that only surplus produce can be sold.

Farmers should be at the pinnacle of society and rewarded far more than they are now.   There also need to be more farms and more farmers.  The history of California has been one of very large farms worked by armies of poorly housed and fed temporary laborers, the opposite of the Jeffersonian ideal.   Anything that could be done to break large farms into smaller acreages where people could grow their own food would greatly lessen the suffering in the future.

The vast majority of money spent on food finds its way to middlemen who sell unhealthy, life-shortening products to us at ten times the cost of the natural ingredients.  For example, most products with flour are not whole grain, but flour that’s had the vitamins, minerals, protein, healthy fats, and fiber stripped out.

By having consumers trade with farmers as directly as possible, we will all be healthier, and the inflationary pressures that rising energy costs will bring can be lowered, because now all the excessive processing, packaging, advertising, and distribution costs can be eliminated or minimized.

There are huge issues with making the transition from growing food with industrial methods to sustainable organic practices.  There won’t be natural gas based fertilizer at some point.  Since agriculture is a closed cycle, the manure from the cities needs to be returned to the land in the country.  California grows food in monoculture, but needs to grow as many crops as possible locally in the future, not only because food needs to be grown locally.  Crop diversity is also one of the ways that farmers can wean themselves from oil-based pesticides since this will make Integrated Pest management far easier. Farmers also depend on hybrid seeds and varieties of genetically engineered plants that can handle the herbicides dumped on them to destroy weeds, but they need to switch ASAP to non-hybrid seeds of as many varieties as possible.

Then there is the bigger picture – California provides one-third of the nations food.   California needs to encourage other states to pass tax laws that encourage small family farms as soon as possible.  If that is impossible in many places due to acid rain having acidified the soil too much to grow crops, then amending the soil to raise the pH is a top  priority.  Since we are likely to turn to coal in desperation, it becomes critical that only “clean coal” plants with CO2 sequestration and pollution control are built and existing plants retrofitted, whatever the energy and monetary cost.

Water and Sewage

A great deal of the water used in Oakland flows by gravity from the Sierras. But EBMUD will still need energy to:

  • Pump water and sewage
  • Purify water
  • Maintain pipes, storage systems, and other water delivery infrastructure
  • Maintain sewer pipes and sewage treatment plant
  • Treat wastewater

All of the global warming predictions for California show higher temperatures and less water availability due to early snowmelt and possibly less rainfall, so water harvesting and storage at a state, city, and homeowner level is essential.

Currently, water distribution and sewage use 7% of our energy.

Violence

Oakland has much higher than the average national rates of murder, forcible rape, robbery, and aggravated assault, Burglary, larceny, and car theft.  There are a large number of violent gangs.

If there is great hardship at some point, even ordinary people will find themselves getting unreasonably cranky, angry and hot-tempered as they become afraid, hungry, tired, or cold.  There will be a great need for arbitrators and for people to learn these skills themselves.

Unfortunately, maintaining civil order will probably consume a large amount of the dwindling energy resources.

Wood and Coal

People will need to cook their food, and the wealthy will burn wood and coal to keep warm in the winter.

What can be done

1)      Allowance of gray water systems at residences.

2)      Some sewage treatment via wetlands as is done in Arcata.

3)      Add more rail lines in the central valley to transport food and people.

4)      Set up city granaries and water storage.    As fuel becomes scarce and intermittently available, being able to move large quantities of grain into local storage when possible would smooth distribution bumps.

5)      The city of Oakland could contract to buy food directly from farmers.

6)      If it’s legal, the city could even buy farms.  There will be a great deal of unemployment as businesses collapse from high fuel prices and shortages.[12] [13] [14] This would provide a valuable jobs program for Oakland.

7)      The city should have a fleet of sailboats and other water craft to navigate the delta and coast to bring food back to the city.  This will also provide jobs.

8)      Residents should be encouraged to store their own food and water.  The city should provide, at cost, water and food-safe containers and manual grain grinders.

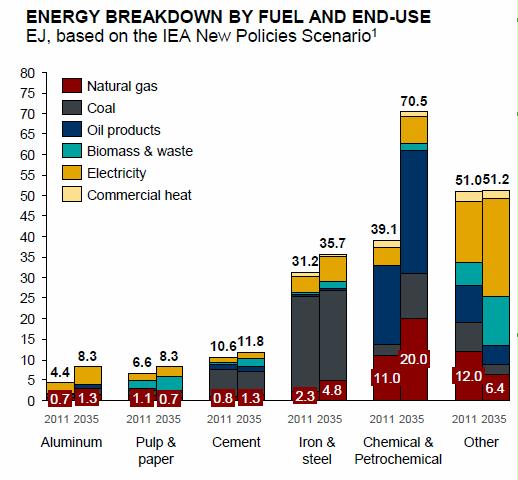
9)      The city of Oakland should also provide solar ovens at cost.  Not only can food be cooked in these over the course of a day, water can also be pasteurized.  For days when the sun isn’t shining, and the natural gas isn’t flowing, there are cooking devices that need mere twigs to cook food, and passive highly-insulated boxes that continue to cook heated food without additional heat.

10)  California has one of the most extensive irrigation systems in the world.  There are hundreds of miles of irrigation canals.  Water transportation is the most energy efficient form of transport — we need to investigate whether the major canals can be made navigable.  “Gondoliers” could pole produce down the larger canals and rivers.

11)  We should also do research to see if it would be feasible to cover the irrigation canals to limit evaporation and sedimentation.  This would also limit the growth of weeds, algae, and invasive water plants, which clog canals and provide habitat for mosquitoes, snails and other pests.  Or allow invasive water plants to grow, but harvest them to make compost.  We won’t have the energy to fight invasive species anymore, so we need to come up with low-energy strategies.

12)  Bicyclists and horses could deliver the produce to the canal network.  The cargo in the gondolas would be trans-loaded to sailboats and larger barges in the delta, where river craft would take advantage of the tides, wind, and currents to make their way to the Bay Area.

13)  We should restore the Bay Area estuary and wetlands to bring back the fisheries and waterfowl that once made this one of the most productive estuaries on earth.  That way the sailboats returning to the central valley can take back seafood from the Bay Area (and other products too: tools, medicine, books, etc).

14)  Oakland could start punching holes in parking lots now to let the soil begin recovering, eventually de-paving as cars disappear.  Over time, the soils can be restored and turned into community gardens and orchards.

15)  There should be a moratorium on all development, except along train lines and major transportation corridors.

16)  The city should create tax incentives for tearing down buildings and converting land that’s already open space into community gardens.  It’s been seven years since Berkeley gave permission to a neighborhood to start a community orchard, and it is only now finally happening.  These projects take time, because there are many issues to resolve.  Time is running out, this needs to be done now.

17)  Food should be delivered to neighborhood centers within walking distance of homes rather than the current system, where everyone drives to stores.   This will mean redistricting to more mixed business and residential, perhaps even tearing down homes and replacing them with businesses.

18)  The hills are well suited to goats that could provide dairy products to sell.  Goats will also be essential for fire protection.

19)  Encourage people to have chickens, eggs are a very good source of protein.

If nothing is done, we’re headed for a much scarier sequel of “Grapes of Wrath, as millions migrate from the cities and the rest of the nation into the central valley to find farm worker jobs.  A new class of large landowners will rule – we’ll have feudalism instead of a Jeffersonian nation of small farmers.

Since at least three out of ten people must go back to the land (until the coal-driven industrial revolution, it was nine out of ten), it would be better for everyone if the government or groups of individuals bought farm land and built energy efficient housing there as soon as possible.  Each family would own a section of the surrounding land.

Oakland staff and city council members should set up meetings with all of the neighborhood associations to educate the local people on the challenges ahead.  Our neighborhood has pooled our resources to buy several sets of firefighting hoses, a similar approach could be taken to buy water purification, water and food storage containers, and so on, that neighbors could pool their money to buy at cost from the city as compost bins are now.   Car sharing and other programs can be set up to be implemented as needed ahead of time.

Given the average American’s lack of ecological and scientific literacy, magical thinking, and a retreat from reality caused by watching television several hours a day, this will be quite a challenge.

Bay Area Carrying Capacity

The residents of San Francisco Bay Area cities rely on an area nearly the size of California and Oregon combined so sustain themselves (146 million acres), about 21 acres per person.  If everyone on earth lived at the same standard of living, we’d need more than 4.5 earths.[15]  Localization and living a simpler lifestyle needs to start now.

Conclusion

You could look at Peak Oil as a logistical battle looming ahead: how to ship goods, water, and so on, with less energy, from agricultural areas that are often far from cities.  And how to grow the same amount of food organically, how to pump water from depleted water tables with minimal energy use (windmills can only bring water up from 20 feet or less), how to get “armies” of people from cities to farms to harvest crops in a short window of time, etc.   Many of the cities in Calfornia are built on top of the best farm land, so stopping further development is an important step to take as soon as possible.

Basically it’s a retreat – how do we fall back in time?  Clearly we are falling back to the Age of Wood, kicking and screaming all the way.   If we planned for this transition now, we could build more rugged non-rusting aluminum sailboats and wagons than we will be able to build later, especially with wood being so scarce now that we’ve cut down so many of our trees.  What we don’t cut will likely burn as the climate warms and forest fires become more frequent.

The longer we wait, the more difficult it will be, because now we have the material and energy to prepare. Once energy declines, the ability to adapt will be much harder, even impossible at times, because what energy remains will be totally devoted to keeping as much running as possible.

Since there are no energy replacements for oil except for fusion, which isn’t available now or possible ever, the only rational thing to do is to figure out how to re-architect society to cause the least harm possible.

History textbooks are famous for talking about how horse carriage makers went out of business when Henry Ford started making cars, now it’s time to talk about how to get autoworkers to make horse carriages again.

We need to stop building on farmland now.  As it is, many major cities are sitting on top of what used to be the best prime farm land.

We need to move more people back to more farms (there are 1.9 million farms now, in 1935 there were 7 million farms).   Do we start breeding mules and horses like mad for transport, or would they require too much land for hay?  Do we try to move people back to the land, and get 50 million small farms going (using Jeavons or other biointensive methods)?

This sounds awfully wacky, I know we won’t go from the 21st century to 13th overnight, but it will be awfully fast because of factors beyond oil depletion (i.e. politics, economics, acts of terrorism, the possibility of WW III over the remaining resources, pandemics, extreme weather, lower standards of living driving the crime rate up, etc), and most of all, not having prepared for what we knew was coming ahead of time.

To prevent chaos and suffering, we need to look at the impact Peak Oil will have on the basics: food and water.  Food production is heavily dependent on oil and natural gas, so the amount of food that can be produced and distributed will decline at the rate of fossil fuel depletion.[16] [17]

People will travel far less often as rationing, shortages, and the prices of oil increases.

Agriculture and water agencies will be given the lions’ share of energy.[18]  As infrastructure breaks down and costs more to repair over time, delivery of food to the Bay Area will become less reliable.

Many think that ethanol and bio-fuels will propel vehicles in the future, but there is a great deal of evidence to show that these products require more fossil fuel energy to make than is delivered in the final product.[19] [20]  Topsoil is our greatest possession.  Land used to grow ethanol and bio-fuels would also decrease the amount of land available for food, deplete the fertility of the soil, and increase soil erosion.

Population must go down in step with the depletion of fossil fuels. It can be done by limiting immigration, making abortion and birth control free and easily accessible, taxing families with more than one child, etc.  And there is a huge incentive.  If we don’t do it, Mother Nature will, and with a Malthusian vengeance through starvation, disease, violence and chaos.

Government is going to have to reinvent itself to make decisions based on ecology.   The “endless growth on a finite planet” point of view was born from the discovery of the Americas, “empty” continents with unexploited resources, and then the discovery of oil, which has given us the delusion we could increase productivity and grow forever.

References


[1] Robert L. Hirsch 2005 Peaking of World Oil Production: Impacts, Mitigation, & Risk Management.    http://www.hilltoplancers.org/stories/hirsch0502.pdf

[2] M. Hoffert, et al. November 1, 2002. Advanced Technology Paths to Global  Climate Stability: Energy for a Greenhouse Planet. Science, 298: 981-987.

[4] John Jeavons  2002. How to Grow More Vegetables: And Fruits, Nuts, Berries, Grains, and Other Crops Than You Ever Thought Possible on Less Land Than You Can Imagine   Ten Speed Press

[5] Bettina Boxall. September 19, 2005. California’s Levees Are in Sorry Shape.  Los Angeles Times.

http://velocipede.dcn.davis.ca.us/pipermail/env-trinity/2005/000630.html

[6] Richard Street. 2004. Beasts of the Field: A History of California Farm Workers, 1769-1913. Stanford University Press.

[7] Brian Hayes. 2005. Infrastructure: A Field Guide to the Industrial Landscape. W. W. Norton.

[8] California Department of Food and Agriculture

[9] Steven Stoll. 1998. The Fruits of Natural Advantage: Making the Industrial Countryside in California. University of California Press.

[10] Garrett Hardin. 1995. Living Within Limits: Ecology, Economics, and Population Taboos. Oxford University Press.

[11] Roy Beck & Leon Kolankiewicz. The Environmental Movement’s Retreat From Advocating U.S. Population Stabilization (1970-1998). www.population.org.au/pressrm/pub/RetreatfromStabilization.pdf

[12] Jul 02, 2004  Oil prices raising costs of offshoots By Associated Press

http://www.tdn.com/articles/2004/07/02/biz/news03.prt

[13] May 24, 2004 Soaring energy prices dog rosy U.S. farm economy

http://www.forbes.com/business/newswire/2004/05/24/rtr1382512.html

[14] March 17, 2004 Chemical Industry in Crisis: Natural Gas Prices Are Up, Factories

Are Closing, And Jobs Are Vanishing

http://www.washingtonpost.com/wp-dyn/articles/A64579-2004Mar16.html

[15] Regionalprogress.org, an organization that studies the ecological footprint and
        regional sustainability of regions in the United States.
    http://www.regionalprogress.org/county_ca_bayarea.html
        For more on ecological footprint and carrying capacity from a global perspective,
        see Global Footprint Network, created by Mathis Wackernagel and William Rees at
       http://www.footprintnetwork.org/   Other first-rate scientists associated with this
   organization are: E. O. Wilson, David T. Suzuki, Lester Brown, Herman E. Daly, etc

[16] John Gever.  1991  Beyond Oil: The Threat to Food and Fuel in the Coming Decade.    University Press of Colorado

[17] David & Marshall Fisher April 2001.  The Nitrogen Bomb.  Discover magazine

[18] Standby Gasoline Rationing Plan.  1980. U.S. Department of Energy Economic Regulatory Administration    http://ntl.bts.gov/lib/12000/12200/12291/12291.pdf

[19] Tad Patzek, David Pimentel . 2005.  Thermodynamics of Energy Production from Biomass. Critical Reviews in Plant Sciences

[20] Pimentel, D and Patzek, T. March 2005. Ethanol Production Using Corn, Switchgrass, and Wood; Biodiesel Production Using Soybean and Sunflower. Natural Resources Research, Vol. 14, No. 1
Posted in What to do | Comments Off on Oakland Depletion Protocol

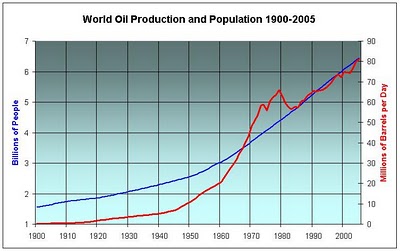
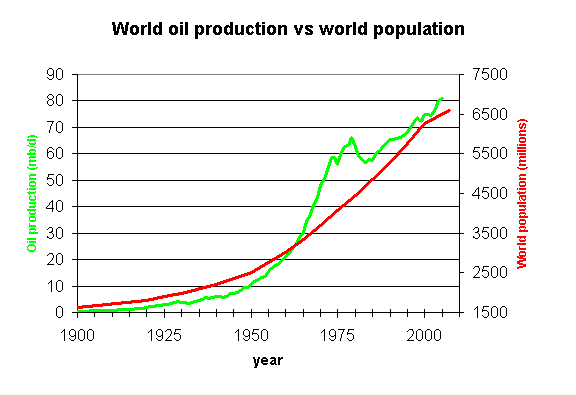
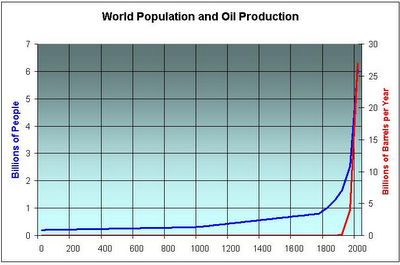
Oil Production Fueled Population Growth and Food Production

As oil exponentially declines, so will population and food.

oil prd vs population 1 oil prd vs population 2 World+Population+and+Oil+1900 WorldPopulationGraph_throughout history

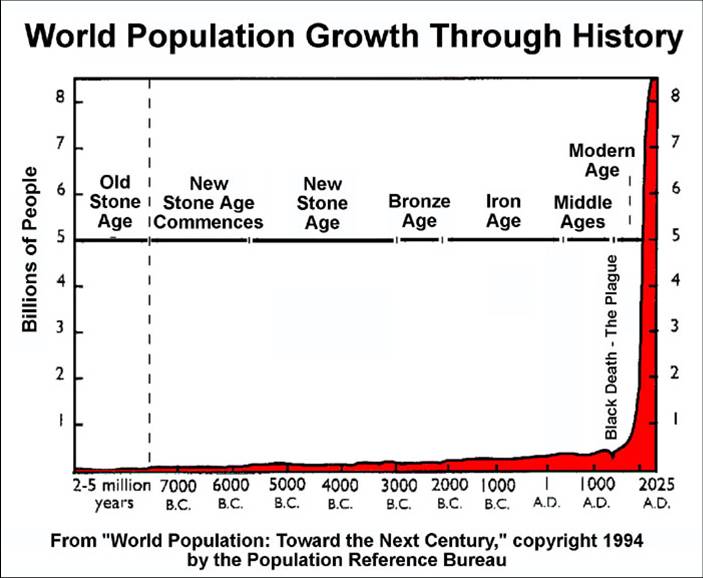
1994. Elaine M. Murphy. World Population: Toward the Next Century, © 1994 by the Population Reference Bureau, 1875 Connecticut Avenue, N.W., Suite 520, Washington, DC, 20009. Property of Population Reference Bureau, Inc.

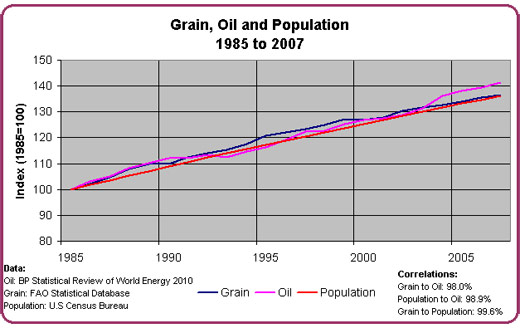
dick_peak_big Grain_Oil_Population

2 Feb 2013. Paul Chefurka. How Tight is the Link Between Oil, Food and Population?
Food Shortages, Population, peak oil.

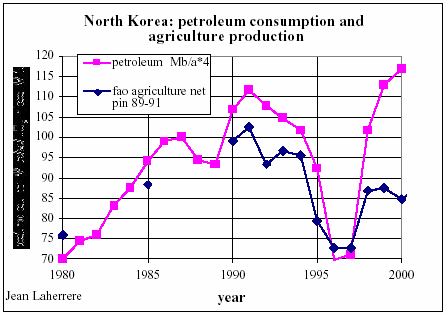
NorthKorea oil vs ag prd

17 Nov 2003. Dale Allen Pfeiffer. Drawing Lessons from Experience; The Agricultural Crises in North Korea and Cuba — Part 1. From the wilderness

So what happens to an industrialized country practicing modern agriculture when it loses its fossil fuel energy base? There are two countries where it has already happened: North Korea and Cuba. Both countries have little or no oil resources of their own, both relied upon the Soviet Union for their oil imports, and both experienced a swift and severe drop in their oil imports following the demise of the Soviet empire.

Posted in Exponential Growth | Comments Off on Oil Production Fueled Population Growth and Food Production

Oil Statistics

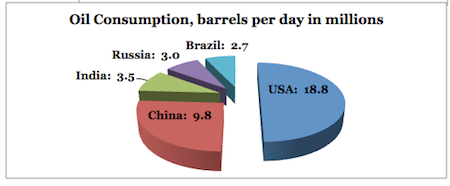
world oil consumption per day 2012Source: 6 Aug 2012. Lou Gagliardi. Energy Stock for the Short Term. Cabot Wealth Advisory.

Major oilfields in decline  Around 70,000 oil fields are currently in production, according to the UK’s Industry Taskforce on Peak Oil and Energy Security (ITPOES). Yet the vast majority of these produce oil in small and negligible volumes: 120 fields account for half of global production, and there are just 4 fields that produce – at least until recently – more than one million barrels a day: Ghawar in Saudi Arabia, which accounts for five per cent of daily world production; Cantarell in Mexico; Burgan in Kuwait and Da Qing in China. The concern of the ITPOES report, The Oil Crunch, is that they are quite old, at or near the peak of their production, and no new finds of similar size have been reported for a long time.

The primacy of Oil. Global primary energy by fuel. IEA Renewables Data 2009.

  • 34% oil
  • 27% Nuclear
  • 21% Natural Gas
  • 12% Renewable
  • 6% Nuclear

Where the 85 million barrels of oil go

  1. Transportation: 50% road, 8% air, 8% Sea
  2. Heat & Power: 18%
  3. Non-Fuel 16%

World energy 2011 (Source: Energy Information Agency. http://www.eia.doe.gov) we’re still very dependent on fossil fuels and always will be:

Posted in Oil | Comments Off on Oil Statistics

Humanity will need 27 planet Earths by 2050, a new study estimates.

Stephen Leahy. 3 Aug 2011.  Data Shows All of Earth’s Systems in Rapid Decline. Inter Press Service.

Overpopulation is causing huge losses in biodiversity, and ‘protected areas’ such as national parks aren’t working.

UXBRIDGE, Canada, Jul 29 (IPS) – Protecting bits of nature here and there will not prevent humanity from losing our life support system. Even if areas dedicated to conserving plants, animals, and other species that provide Earth’s life support system increased tenfold, it would not be enough without dealing with the big issues of the 21st century: population, over-consumption and inefficient resource use.

Without dealing with those big issues, humanity will need 27 planet Earths by 2050, a new study estimates.

The size and number of protected areas on land and sea has increased dramatically since the 1980s, now totaling over 100,000 in number and covering 17 million square kilometres of land and two million square kilometres of oceans, a new study reported Thursday.

But impressive as those numbers look, all indicators reveal species going extinct faster than ever before, despite all the additions of new parks, reserves and other conservation measures, according to the study published in the journal Marine Ecology Progress Series.

“It is amazing to me that we haven’t dealt with this failure of protected areas to slow biodiversity losses,” said lead author Camilo Mora of University of Hawaii at Manoa. “We were surprised the evidence from the past 30 years was so clear.”

The ability of protected areas to address the problem of biodiversity loss – the decline in diversity and numbers of all living species – has long been overestimated, the study reported. The reality is that most protected areas are not truly protected. Many are “paper parks”, protected in name only. Up to 70 percent of marine protected areas are paper parks, Mora said.

The study shows global expenditures on protected areas today are estimated at six billion dollars per year, and many areas are insufficiently funded for effective management. Effectively managing existing protected areas requires an estimated 24 billion dollars per year – four times the current expenditure.

“Ongoing biodiversity loss and its consequences for humanity’s welfare are of great concern and have prompted strong calls for expanding the use of protected areas as a remedy,” said co-author Peter Sale, a marine biologist and assistant director of the United Nations University’s Institute for Water, Environment and Health.

“Protected areas are a false hope in terms of preventing the loss of biodiversity, ” Sale told IPS.

The authors based their study on existing literature and global data on human threats and biodiversity loss.

When asked about the 2010 global biodiversity protection agreement in Nagoya, Japan to put 17 percent of land and 10 percent of oceans on the planet under protection by 2020, Sale said it was “very unlikely those targets will be reached” due to conflicts between growing needs for food and other resources.

“Even if those targets were achieved, it is not going to stop the decline in biodiversity, ” he said.

One reason for this is “leakage”. Fence off one forest and the logging pressure increases in another. Make one coral reef off limits to fishing and the fishing boats go the next reef.

Another reason protected areas aren’t the answer is that fences or patrol boats can’t keep out the impacts of pollution or climate change.

Finally, the pressures on the planet’s resources are escalating so quickly that “the problem is running away from the solution”, he said.

The loss of biodiversity is a major issue because it is humanity’s only life-support system, delivering everything from food, to clean water and air, to recreation and tourism, to novel chemicals that drive our advanced civilization, said Mora. Right now the dominant strategy to halt the loss of biodiversity is with protected areas.

“That’s putting all our eggs in one basket,” he said. “A major shift is needed to deal with the roots of the problem.”

The ever-expanding footprint of humanity is the primary cause of global biodiversity loss. When the world’s population was five billion people in 1985, the amount of nature’s resources being used or impacted became more than the planet could sustain indefinitely according to many estimates, said Mora.

The world population, currently at seven billion, is well beyond Earth’s ability to sustain. By 2050, with a projected population of 10 billion people and without a change in consumption patterns, the cumulative use of natural resources will amount to the productivity of up to 27 planet Earths, the study found.

Sustaining the current seven billion people on the planet requires a major shift in resource use. At present, the average U.S. citizen’s ecological footprint is about 10 hectares, while a Haitian’s is less than one. The planet could sustain us if everyone’s footprint averaged two ha, Mora said.

If there are more people, then there are simply fewer resources available for everyone, so population control will be needed along the lines of “one child per woman”, he said.

“I’m from Colombia, it blows my mind that some governments in the developing world pay women to have more children,” he added.

Hardly anyone is focused on the pressing need for a major shift, said Sale.

“The awareness of the public about this is shockingly low,” he noted. What is needed is for humanity as a mass to change direction, he said.

“But can we find the hook, the lever that’s needed to make that happen?” Sale asked.


Posted in Biodiversity, Overpopulation | Tagged , | Comments Off on Humanity will need 27 planet Earths by 2050, a new study estimates.

William Catton, Chapter 2 of Overshoot: The Tragic Story of Human Success

William Catton. 1980. Overshoot: The Ecological Basis of Revolutionary Change. University of Illinois Press.

Origins of Man’s Future

We are already living on an overloaded world. Our future will be a product of that fact; that fact is a product of our past. Our first order of business, then, is to make clear to ourselves how we got where we are and why our present situation entails a certain kind of future.

To this purpose, consider the information about the human saga assembled in the table below.

Taken a row at a time, this table tells an enormous (and enormously revealing) story. It is the story of a world that has again and again approached the condition of being saturated with human inhabitants, only to have the limit raised by human ingenuity.

The first several rounds of limit-raising were accomplished by a series of technological breakthroughs that took almost two million years. These breakthroughs enabled human populations repeatedly to take over for human use portions of the earth’s total life-supporting capacity that had previously supported other species. The most recent episode of limit-raising has had much more spectacular results, although it enlarged human carrying capacity by a fundamentally different method: the drawing down of finite reservoirs of materials that do not replace themselves within any human time frame. Thus its results cannot be permanent. This fact puts mankind out on a limb which the activities of modern life are busily sawing off.

Table 1 History of Major Technological Breakthroughs and Ensuing Population Increases

Table 1: History of Major Technological Breakthroughs
and Ensuing Population Increases.

Date

World
population
in millions

Most advanced
economic
type

Limit-raising
technology

Population
increase

Generations
elapsed

Increase
per
generation

2 million B.C.

hunting and
gathering

use of fire,
toolmaking

78,600

35,000 B.C.

3 a

spear-thrower,
bow and arrow

167 %

1,080

0.09 %

8000 B.C.

8 b

horticultural

cultivation
of plants

975 %

160

1.50 %

4000 B.C.

86 c

metallurgy
(bronze)

3000 B.C.

?

agrarian

plow

1000 B.C.

?

iron tools

249 %

160

0.78 %

1 A.D.

300 d

………………..

………………..

………….
12 %

………….
55.9

………….
0.20 %

1398 A.D.

336 e

hand fire-arms

188.4 %

16.1

6.80 %

1800 A.D.

969 f

industrial

fossil fueled
machinery

41.5 %

2.6

14.28 %

1865 A.D.

1,371 g

antiseptic surgery et.

1975 A.D.

4000 h

191.1 %

4.4

27.55 %

[Added data, 26 August 2008]

2008 A.D.
present
future

6700

satellites

internet,
globalisation
limits…

67.5 %

1.32

table 1950 – 2050

In the Beginning

Some two million years ago, as represented in the first row of Table 1, creatures of another species – human, but not our kind of human – had evolved from pre-human ancestors by finding themselves more and more adapted to a place in the web of life somewhat different from the place their ancestors had occupied. They had discovered somehow that they could use (rather than merely avoid) fire; they could warm themselves with it, ward off predators with it, cook with it and thus render digestible certain organic substances that would not otherwise have been available to their bodies as nutrition. Whatever the world’s capacity had been for supporting their pre-human ancestors, there was now an additional place for the human descendants of those earlier creatures. Their human traits enabled them to live partly upon portions of the world’s substance not usable by their forebears.

These newly human beings had also begun to make and use simple tools. Moreover, they could teach their progeny how to make and use these artifacts. Each generation did not have to rediscover independently the techniques that had contributed to its parents’ survival. Still, the accumulation of adaptive culture would have been prodigiously slow at first, and for hundreds of thousands of years there could not have been very many of these creatures. Even with fire, tools, and traditions, these humans remained what their prehuman ancestors had been: consumers of naturally available foodstuffs obtained from wild sources by hunting and gathering.

There were no census bureaus in Paleolithic times, of course. But by knowing the dependence of early man upon wild food sources, we can make reasonable estimates of maximum feasible average population density, and can estimate the extent of the earth’s land area capable of supporting such hunters and gatherers. The important fact that emerges is that there could never have been very many millions of them. Nevertheless, these early humans were successful; they survived, reproduced, adapted, and continued evolving.

By the time almost 80,000 generations of human hunters and gatherers had lived, their biological and cultural responses to the selection pressures imposed by their spreading habitats had given rise to a descendant population with essentially the inheritable physical traits we see among men and women today. Thus by about 35,000 BC, the humans on earth were of our own species, Homo sapiens. Probably about three million of them were living by gathering and hunting.

Increased Hunting Proficiency

We cannot really say that three million was the maximum number the Earth could ever have supported in the manner in which they were then living. Still, we can be reasonably sure, from their slow attainment of even that number, that the earth’s carrying capacity for that kind of creature with that kind of lifestyle was not much greater than that figure. However, the gradually evolving cultures of Homo sapiens eventually increased the earth’s human carrying capacity.

About 35,000 BC, someone discovered how much harder and farther a spear could be thrown if the thrower effectively lengthened his arm by fitting the end of the spear into a socket in the end of a handheld stick. Someone else invented a way of propelling miniature spears (arrows) not only faster, but also in a manner that permitted line-of-sight aiming, by fitting their notched ends to a cord tied to the two ends of a springy stick. Using tools like the spear-thrower and the bow and arrow, humans became more proficient hunters, and more of the earth’s game animals became nourishment for human bodies.

With these technological breakthroughs, the worldwide population of Homo sapiens increased in a little over one thousand generations from about three million souls to about eight million. The total human biomass on earth had more than doubled. Still, most of the people in each of those thousand generations would have been utterly unaware of increase, for, as the entry in the far right-hand column of the table shows, each tribe was enlarged on the average by less than 1/10th of one percent during one generation – that is, during roughly the quarter century it took for each new parent to raise his own children and reach grandparent status.

Learning to Manage Nature

But the time came, eventually, for another major breakthrough and another enlargement of the earth’s human carrying capacity. Somewhere, some of the people who gathered wild seeds for grinding into flour observed that seeds spilled on moist earth near where the family carried on its activities sprouted into plants that grew at least as well as those in the wild. In time these plants would bear a new crop of seeds, conveniently harvestable. Homo sapiens went on to develop this discovery into techniques of plant cultivation, effecting a major transformation of the relation of our species to nature’s web of life. Henceforth, some of us were going to obtain nourishment from a humanly managed portion of the biotic community, rather than merely gathering the products of plant and animal species that we could use if we reached them before other consumer animals or invisible decomposer organisms.

This horticultural revolution, by which hunters and gatherers turned into farmers, was followed by a tenfold increase in the earth’s human population. This increase occurred in 1/6th as many generations as the previous increase phase. Such acceleration indicates that mankind’s daring to undertake the management of a portion of nature had again raised the earth’s human carrying capacity. Biologically, this species, with the remarkable capability of achieving cultural innovations, was proving a resounding success.

It began to be possible for a minuscule but increasing fraction of any human tribe to devote its time to activities other than obtaining sustenance. Human social organization could begin developing along more elaborate lines, and the fate of cultural innovation could further accelerate. Each increment of technology gave mankind a competitive edge in interspecific competition. Our species was well on its way to being the dominant member of the ecosystem.

Compound Interest

Note that, even after this horticultural acceleration of population growth, change would have remained almost unnoticeable to those living through it. The increment in an average generation was still a mere 1.5 percent. The starting population of 8 million was, in effect, multiplied in one generation by a factor of 1.015, and then that product was again multiplied in the next generation by 1.015, and so was that product, and so on. The “interest” of 1.5 percent on the initial “investment” was compounded by each generation – 160 times between 8000 BC and 4000 BC. Thus:

8, 000,000 x (1 + 0.015) to the 160th power = 86,000,000, approximately.

So the numbers shown in the “generations elapsed” column of Table 1 are more than just expressions of the time intervals between the dates shown in the first column; they must be read as exponents applied to multipliers that are derived from the figures in the last column. Even at low percentage rates of increase per generation, the “compound interest” pattern can produce great change when enough generations elapse.

As advancing human culture extended the niches available to mankind, recurrent surges of essentially exponential growth in numbers became possible. (The well-known “population explosion” of our own time was merely the most recent episode in a process that has been going on since antiquity.)

Tools, Organization, and Standard of Living

By about 4000 BC, stone and bone tools began to be augmented and then superseded by metal tools as Homo sapiens moved into what his history-writing descendants would one day label the Bronze Age. This enhancement of man’s tool kit was followed by further population increase. Metallurgy enhanced the ability of the human species to harvest nature’s products, rather than leaving them to be used by other consumer species. It also gave further impetus to the elaboration of a “division of labor” among increasingly specialized occupations. From here on, the growth of organization among humans would be an increasingly important factor in their dominance over the environment supporting them.

If cultural innovations were to cease, or if some ultimate limit proved impossible to transcend by cultural progress, exponential growth would give way to a curve of diminishing returns. Limited carrying capacity would reduce the rate of growth in successive generations. Eventually, as population approached carrying capacity, the growth rate would approach zero-of necessity. That is what “carrying capacity” means.

But innovations continued, and the ceiling was raised again. Around 3000 BC, man the cultivator of plants went in for an early version of “mass production”, tilling land in larger tracts than before. This was made possible by invention of the plow, which enabled the farmer to begin using non-human energy to turn over the soil – energy supplied by the muscles of an ox or a horse, though at first a plow was sometimes pulled by a slave or a wife (and had to be rather small). One farmer could manage more soil with this additional tool. But an agriculture that used draft animals had to use some of its land to raise crops to be eaten by those animals, so this new technology would not immediately raise human carrying capacity as dramatically as previous innovations had done.

There was also an alternative use for this particular increment in sustenance-producing power. A farmer with a plow and a draft animal could farm enough land to feed himself, the animal, his own family, and perhaps have a bit to spare. So some small but gradually increasing fraction of the population could now do things other than raise food. Human groups could opt for further elaboration of their lives, rather than for simple expansion of their numbers.

About 1000 BC, iron tools began to supplement and replace those made of bronze. Again, some of the carrying capacity increment was used to enhance, little by little, the standard of living of at least some groups.

The separate effects of these last several innovations upon population increase cannot be assessed, because usable estimates of population numbers at the times these new tools and techniques came into use are not available. But between the beginning of the Bronze Age and the birth of Christ (a date for which there does happen to be a more or less agreed upon population estimate) their cumulative effect was to expand the world’s human stock from about 86 million to about 300 million – an average rate of increase of about 3/4ths of one percent per generation. Slower increase continued for another millennium.

Firearms

Then came a different kind of breakthrough. Early in the 14th century firearms were invented, and were immediately put to military use. The first firearms were hardly portable, and hardly suitable for any non-military purpose. If they were to have any effect on carrying capacity, that effect had to be indirect. By changing the nature of warfare they would eventually change the nature of political organization, which would, in turn, alter the way human populations would relate themselves to the resources of the world around them.

Within three generations after these first firearms came into use, hand-carried firearms began to be made. Since these could have had some direct bearing upon human ability to harvest meat, they (rather than their more cumbersome military forerunners) are given a place in Table 1. In the next sixteen generations, we see a higher average rate of population increase than ever before. It is too high, in fact, to be solely due to improved game-harvesting efficiency. It came about quite differently.

The cumulative effects of human increase over the past two million years were becoming significant. The portions of the earth’s land surface available to those human tribes that had thus far experienced all of these technological breakthroughs were coming to be rather fully occupied by humans. But the tools and the knowledge available to these culturally most advanced segments of Homo sapiens were enabling (and causing) some men to leave the land and venture more and more daringly onto the sea. Less than a century after the invention of portable firearms, Europeans would discover lands they had not previously known existed. In the generations after that discovery, the Europeans’ superiority in weapons would enable them to take possession of whole new continents whose prior human inhabitants were much less numerous, because they were still living mostly at the Stone Age hunter-gatherer or early horticultural level.

Firearms did not enlarge the planet. However, they served to enlarge once again the carrying capacity of the world known to Europeans, by making available for settlement and exploitation a “virgin” hemisphere. The expansion of territory available for use by Europe’s already advanced means is the main reason why firearms can be said to have led to the unprecedented rate of increase in human numbers during this last portion of the agrarian period.

Abundance

I shall call the centuries that followed the sudden expansion of European man’s habitat by voyages of discovery the Age of Exuberance, for reasons to be spelled out in later chapters. During that age, man largely forgot that the world (that is, Europe) had once been saturated with population, and that life had been difficult for that reason. Discovery of the New World gave European man a markedly changed relationship to the resource base for civilized life. When Columbus set sail, there were roughly 24 acres of Europe per European. Life was a struggle to make the most of insufficient and unreliable resources. After Columbus stumbled upon the lands of an unsuspected hemisphere, and after monarchs and entrepreneurs began to make those lands available for European settlement and exploitation, a total of 120 acres of land per person was available in the expanded European habitat – five times the pre-Columbian figure!

Changelessness had always been the premise of Old World social systems. This sudden and impressive surplus of carrying capacity shattered that premise. In a habitat that now seemed limitless, life could be lived abundantly. The new premise of limidessness spawned new beliefs, new human relationships, and new behavior. Learning was advanced, and a growing fraction of the population became literate. There was a sufficient per capita increment of leisure to permit more exercise of ingenuity than ever before. Technology progressed, and technological advancement came to be the common meaning of the word “progress”.

But the aura of limitless opportunity had another effect: further acceleration of population growth. To go into some details not shown explicitly in Table 1, between 1650 and 1850, a mere two centuries, the world’s human population doubled. There had never before been such a huge increase in so short a time. It doubled again by 1930, in only eighty years. And the next doubling was to take only about forty-five years! As people and their resource-using implements became more numerous, the gap between carrying capacity and the resource-use load was inevitably closed, American land per American citizen shrank to a mere 11 acres – less than half the space available in Europe for each European just prior to Columbus’s revolutionizing voyage. Meanwhile, per capita resource appetites had grown tremendously. The Age of Exuberance was necessarily temporary; it undermined its own foundations.

Most of the people who were fortunate enough to live in that age misconstrued their good fortune. Characteristics of their world and their lives, due to a “limitlessness” that had to be of limited duration, were imagined to be permanent. The people of the Age of Exuberance looked back on the dismal lives of their forebears and pitied them for their “unrealistic” notions about the world, themselves, and the way human beings were meant to live. Instead of recognizing that reality itself had actually changed – and would eventually change again – they congratulated themselves for outgrowing the “superstitions” of ancestors who had seen a different world so differently. While they rejected the old premise of changelessness, they failed to see that their own belief in the permanence of limitlessness was also an overbelief, a superstition.

As the gap closed, conditions of life did change – of necessity. The world reentered an age of population pressure. Its characteristics had to resemble, in certain ways, the basic features of the Old World of pre-Columbian times. Except that now there were ever so many more human beings, all parts of the planet were in touch with each other, per capita impact on the biosphere had become enormously amplified by technology, depletion of many of the earth’s non-renewable resources was already far advanced – and the inhabitants of this post-exuberant world had acquired from the Age of Exuberance expectations of a perpetually expansive life.

The Takeover Method

The Europeans who began taking over the New World in the sixteenth and seventeenth centuries were not ecologists. Although they soon were compelled to realize that the Americas were not quite uninhabited, they were not prepared to recognize that these new lands really were, in an ecological sense, much more than “sparsely” inhabited. This second hemisphere was, in fact, essentially “full”. As we have seen, the world supported fewer people when they were at the hunter-gatherer level than when they advanced to the agrarian level. In the same way, a continent that was (ecologically speaking) “full” of hunters and gatherers was bound to seem almost empty to invaders coming from an agrarian culture and accustomed to that culture’s greater density of settlement.

Ethnocentrism prevented most Europeans from seeing themselves as they must have appeared to the Indians – as competitors for resources the Indians were already exploiting as fully as they knew how. Ecologically, these vast “new” lands did not have “plenty of room” for Indians plus Europeans, as the Europeans easily supposed. Indians living by hunting-gathering and by simple horticulture were going to be displaced by incoming hordes of Europeans practicing advanced agrarian life.

Even if there had been less ethnocentrism, and if principles of Christian compassion had sufficed to preclude all suspicion, hostility, and bloodshed in the interactions between “civilized” and “savage” peoples, total ignorance of the ecological implications of different levels of technology would have enabled the takeover to occur. Europeans were able to move to the New World with no pangs of conscience about relegating the native peoples to a shrinking fraction of these continents. The shrinking fraction afforded insufficient carrying capacity (when exploited by hunting and gathering or by primitive horticulture) to accommodate the number of Indians already generated by their previously more extensive environment. But neither the concept of carrying capacity nor its relation to stages of human culture was part of the European settlers’ mental equipment. So the displacement occurred.

Essentially the same displacement followed from the same ethnocentrism and ecological naivete when settlers from Europe invaded Australia and New Zealand. An approximation of this pattern also prevailed for a while as Europeans later took over the more or less temperate parts of Africa, although there a difference in the invader/native ratio eventually began to reverse the relationship with more numerous Africans eventually beginning to oust Europeans.

All over the world, Europeans had acted on the premise that it was only fair and reasonable for “unused” or “underused” lands (that is, lands being used by non-agrarian non-Europeans) to be “put to good use”. In the absence of ecological understanding, that premise had seemed utterly sound.

The takeover method of enlarging carrying capacity was far older than the Age of Exploration and the centuries of colonial expansion. Invading and usurping lands already occupied by others was essentially what mankind had been doing ever since first becoming human. Each enlargement of carrying capacity reviewed in the preceding pages consisted essentially of diverting some fraction of the earth’s life-supporting capacity from supporting other kinds of life to supporting our kind. Our pre-sapiens ancestors, with their simple stone tools and fire, took over for human use organic materials that would otherwise have been consumed by insects, carnivores, or bacteria. From about 10,000 years ago, our earliest horticulturalist ancestors began taking over land upon which to grow crops for human consumption. That land would otherwise have supported trees, shrubs, or wild grasses, and all the animals dependent thereon – but fewer humans. As the expanding generations replaced each other, Homo sapiens took over more and more of the surface of this planet, essentially at the expense of its other inhabitants. At first those displaced were creatures with teeth and claws instead of tools, with scales or feathers or fur instead of clothes.

In this takeover process, man was behaving as all creatures do. Each living species has won for itself a place in the web of life by adapting more effectively than some alternative form to a given role. What is true of a species is also true of a subdivision within a species. A given tract of land has greater carrying capacity for the subspecies that can extract more from it than for other portions of the species that happen to be less equipped to exploit it.

None of this is said for the sake of justifying displacement of American Indians (or Polynesians, Aborigines, or Africans) by Europeans. Recently aroused pangs of guilt have made European-descended Americans more conscious of the suffering of those who were displaced. Although guilt feelings cannot resurrect the Indians who were forced to yield their place to more powerfully equipped Europeans, perhaps such feelings can prompt us to think about matters we might otherwise have continued to neglect. By explaining this human displacement episode as a special case of the ecological principle of “competitive exclusion”, we can at least take note of how common the takeover process has been in the ecological history of the world. Then, having seen that, we should also be able to see how fundamentally different the takeover method was from another method by which human carrying capacity has been most recently stretched. Recognition of the difference is essential to understanding the human predicament.

The Drawdown Method

About 1800 AD, a new phase in the ecological history of humanity began. Carrying capacity was tremendously (but temporarily) augmented by a quite different method; takeover gave way to drawdown. A conspicuous and unprecedentedly large acceleration of human population increase got under way as Homo sapiens began to supersede agrarian living with industrial living.

Industrialization made use of fossil energy. Machinery powered by the combustion of coal, and later oil, enabled man to do things on a scale never before possible. New, large, elaborate tools could now be made, some of which enhanced the effectiveness of the farming that of course had to continue. Products of farm and factory could be transported in larger quantity for greater distances. Eventually the tapping of this “new” energy source resulted in the massive application of chemical fertilizers to agricultural lands. Yields per acre increased, and in time acreages applied to the growing of food for humans were substantially increased – first by eliminating draft animals and their requirements for pasture land, but also by reclaiming land through irrigation, et cetera.

This time mankind was not merely taking away from competitors an additional portion of the earth’s life-supporting capacity. (He was still doing this, and still not recognizing that this was what he had always done. But – worse – he was now also not recognizing the true nature of something else he was doing on a vast scale. So man was painting himself into a corner.) This time, the human carrying capacity of the planet was being supplemented by digging up energy that had been stored underground millions of years ago, captured from sunlight which fell upon the earth’s green plants long before this world had supported any mammals, let alone humans, or even pre-human primates. The solar energy had been captured by photosynthesis in plants that grew and died and were buried during the Carboniferous period, without the efforts of any farmers. (As we shall see in the next chapter, the fact that no farm labor had to be paid to raise the Carboniferous vegetation, and that no investments in farm machinery used to grow those prehistoric “crops” had to be amortized, et cetera, helped get us into our present predicament.)

Carrying capacity was this time being augmented by drawing down a finite reservoir of the remains of prehistoric organisms. This was therefore going to result in a temporary extension of carrying capacity; in contrast, previous enlargements had been essentially permanent, as well as cumulative.

Being impermanent, this rise in apparent carrying capacity begged one enormously important question: What happens if population, as usual, increases until it nearly fills this temporarily expanded set of opportunities, and then, because the expansion was only temporary, the world finds itself (like the Indians on their shrunken territories) with a population excess? What are the implications of a carrying capacity deficit for mankind’s future? What happens, for example, when supplies of oil become scarce, when tractor fuel becomes unavailable or prohibitively expensive, and when farmers again have to take 1/4th to 1/3rd of the land on which they now raise food for humans and convert it instead to raising feed for draft animals?

Such questions were not asked as long as we viewed our world with a pre-ecological paradigm. The myth of limitlessness dominated people’s minds. Had anyone conceived such implausible-seeming questions in the Age of Exuberance, the answer might have seemed equally incredible: post-exuberant nations and individuals would have a compulsive need to deny the facts so as to deny their own redundancy. (We shall examine such denial of the new reality in Part III of this book, and again in Part V).

Industrialization came about at a fast enough pace so that it enlarged per capita wealth and was not entirely devoted to enlarging population. In principle, any increase in carrying capacity – temporary or permanent – affords a choice between enabling the same number of individuals to live more lavishly or enabling a larger number of individuals to live at previous standards. When the enlargement of carrying capacity is modest and is spread over many generations, it tends to be used mainly to increase numbers; if it is enormous and comes so suddenly that human numbers just don’t rise at the same pace, it raises living standards. The European takeover of the New World had enlarged carrying capacity (for Europeans) just fast enough to begin having this salutary effect. By drawing down stores of exhaustible resources at an ever-quickening pace, industrialization (temporarily) augmented carrying capacity even faster, affording opportunity for quite a marked rise in prosperity and for a phenomenal acceleration of population increase. The welcome rise in prosperity reinforced the dangerous myth of limitlessness and obscured for a while the hazards inherent in the population increase.

Overshoot Aggravated

Scarcely more than two generations had tasted the fruits of industrialization when the growth of population was still further accelerated by truly effective death control. The role of micro-organisms in producing diseases was discovered. In 1865 the practice of antiseptic surgery began. It serves in Table 1 as a reasonable demarcation of the beginning of an era filled with related breakthroughs in medical technology: hygienic practices, vaccination, antibiotics, et cetera. The total effect of this recent series of achievements has been to emancipate mankind more and more from the life-curtailing effects of the invisible little creatures for which human tissues used to serve as sustenance. Like other prey species newly protected from their predators, we have been fruitful and have so multiplied that we have much more than “replenished” the earth with our kind.

These achievements in death control re-channeled the effects of industrialization; they increased the rate at which human population could increase. More of the unprecedentedly rapid rise in apparent carrying capacity resulting from industrial drawing down of resource stocks was devoted to supporting population growth, and less was devoted to supporting enhanced living standards, than might otherwise have been the case.

Death control was a real boon to the first three or four generations that experienced it. Increasingly, parents were spared bereavement during their child-rearing years, and people of all ages were spared the suffering and debilitation that infectious diseases used to inflict. Fewer children became orphaned. Fewer adults became widowed in the prime years of life.

But all these benefits helped us to overshoot permanent carrying capacity. For most people, as this was happening, “carrying capacity” remained an unknown phrase. The concept was absent from the paradigm by which people in the Age of Exuberance perceived and understood their world. Industrialism had given us a temporary increase in opportunities – a very dangerous blessing. Death control gave us a further rapid increase in population not based on a further rise in carrying capacity. Thus, in the seven generations since 1800, world population quadrupled, and mankind came into a really precarious situation.

The precariousness remained unseen by many. Looking back on a century or two of remarkable technical achievements, accompanied by growth of human numbers that was itself culturally defined as a kind of progress (as every town aspired to become a city), minds that had not yet learned the distinction between methods of boosting carrying capacity and methods of overshooting it foresaw no insurmountable difficulty in simply repeating past breakthroughs. It was imagined, for example, that “fast breeder reactors” and other technological eggs-not-yet-hatched could be counted on to provide further increments of carrying capacity whenever nature’s limits began to hurt. (This attitude will be given a suggestive name in Chapter 4 and explored further in Chapter 11.)

During World War II, the brashly American words of a popular song proclaimed: “We did it before, and we can do it again!” A generation after that conflict, we seemed to be taking a demilitarized version of that cliche as the basis for presupposing the supportability of further increases in the population-technology load upon finite environments. People displayed either persistent ignorance of the carrying capacity concept, or naive faith that carrying capacity could always be expanded, that limits could always be transcended. Such an assumption seemed to underlie the stubborn refusal of capitalists and Marxists alike to acknowledge that the myth of limitlessness had at last become obsolete. There was also the assumption that further advances in technology would necessarily enlarge carrying capacity, not reduce it. Enlargement of carrying capacity had been the role of technology in the past; however, we shall see (in Chapter 9) that there has been a reversal of this role in the industrial era. Technology has enlarged human appetites for natural resources, thus diminishing the number of us that a given environment can support.

Back to Hunting and Gathering

The breakthrough we call industrialism was fundamentally unlike earlier ones. It did not just take over for human use another portion of the web that had previously supported other forms of life. Instead, it went underground to extract carrying capacity supplements from a finite and depletable fund – a fund that was created and buried by nature, scores of millions of years before man came along. The drawdown method that we call industrialism relied for its increase of opportunities upon use of resources that are not renewed in an annual cycle of organic growth. To expect to “do it again” is to expect to find other exhaustible resources each time we use up a batch of them. Only once could the technologically most advanced nations of mankind discover a second hemisphere to relieve the pressure in a filled-up first hemisphere; nevertheless, modern industrial societies have continued to behave as if massive “exploration” efforts could forever continue to “discover” additional deposits of mineral materials and fossil fuels. In short, industrial life depends on a perpetual hunt for required substances. To take one example, in order to continue present rates of use of copper, the United States must each year find 250 million tons of ore (containing 0.8 percent copper) – more than a ton for each of us.

The mineral and fuel deposits upon which we are now so dependent were put into the earth by geological processes that happen only at a pace enormously slow by human standards. Since 8000 BC mankind has been taking over management of contemporary botanical processes, the source of sustenance materials that have renewal times much shorter than a human lifespan. Now we rely, as members of industrial societies, upon other substances with renewal times that may be thousands or even millions of times longer than a human lifespan. Their renewal is by geological processes; present stocks of them were put in place by operation of those processes over immensely long stretches of earth history. Mankind cannot realistically hope to assume management of prehistoric events, or to replenish the ores and fuels now being extracted so ravenously. Instead, we must face the fact that, after ten millennia of progress, Homo sapiens is “back at square one”. Industrialization committed us to living again, massively, as hunters and gatherers of substances which only nature can provide, and which occur only in limited quantity. A major oil company whose credit card has been a convenience to me in my travels has recently confirmed this – unwittingly, of course – by printing at the bottom of my monthly statement a bit of institutional advertising. In an effort to enlist customer support for its resistance to congressional pressures against combined ownership of both “production” and “marketing” facilities, this company’s message proclaims that it “does the whole job – finding and delivering oil products you need” (my italics).

Our species had been an enormous biological success. But success carried to excess can be disastrous. The shift from takeover to drawdown actually yielded excessive success. As we shall see, this situation has had a natural sequel. Much of the turmoil so vexing to the generation that saw the fourth billion added to the world’s human population can be understood in such terms. We had already begun to encounter the penalties of becoming again what our remote ancestors were – consumers of substances provided by nature and not by man, substances we obtain from sources not subject to replenishment by our manipulations. We became heavily dependent upon hunting for natural deposits of these substances, and upon continually gathering vast quantities for our use. Euphemistically calling the new versions of these ancient activities “finding” and “delivering”, or “exploration” and “production”, only blinded us to what we were doing. It did not protect us from the consequences.

Notes

1. Calculations supporting this statement appear in the next chapter; the present chapter tells the story of our arrival in this predicament. For another statement indicating that this is indeed the nature of our situation, see Kingsley Davis, “Zero Population Growth: The Goal and the Means”, Daedalus 102 (Fall, 1973):26.

2. For examples of the reasoning behind any inference as to the size of pre-historic populations, see Hollingsworth 1969; Ehrlich, Holm, and Brown 1976, page 457; Coale 1974, page 41; Desmond 1962, pages 3-4.

3. For documentation of this and subsequently mentioned population estimates, see sources cited in the notes for Table 1.

4. Estimates of prehistoric world populations are less exact than modern population figures, of course; but the increase discussed in this paragraph would be no less significant if its magnitude were appreciably less or somewhat more than stated.

5. See Childe 1951, pages 25-26.

6. In technical terms, carrying capacity is represented by the upper limit of an S-shaped logistic growth curve, into which an initially exponential growth curve gets converted by the finiteness of the habitat and its resources.

7. It was not until the latter part of the seventeenth century that scientific study of population began. A British mathematician, John Graunt, in 1662 studied parish clerks’ records of baptisms and burials, and derived sex ratios, fertility ratios, measures of natural increase, et cetera. In 1693 the astronomer Edmund Halley constructed a life-expectancy table from church records.

8. Webb 1952, pages 17-18.

9. Desmond 1962, page 12.

10. See the brief comments in Boughey 1975, page 17, on “competitive exclusion” and “resource partitioning”, and the more extensive exposition by Hardin 1 960. To recognize the displacement of one population of humans by another (with more advanced technology) as an instance of this common ecological process, it is useful to think in terms of a concept devel oped in Chapters. 6 and 9, “quasi-speciation”.

11. From 1973, as shortages of fossil energy came to public attention, it was often supposed that “energy plantations” would afford a solution. The fact that this would put fuel-burning engines into the same competitive relation with food-consuming humans that formerly applied to farmers’ draft animals was almost universally overlooked.

12. Since “carrying capacity” is by definition the maximum permanently supportable population, the expression “permanent carrying capacity” is redundant. The redundancy may serve, nevertheless, to underscore the nature of our predicament. A related point is made by introducing in the next chapter the concept of “phantom carrying capacity” to refer to such things as fossil energy; to speak of “temporary carrying capacity” would be a contradiction.

Selected References

Ackerknecht, Erwin H. 1968. A Short History of Medicine. Revised edition. New York: Ronald Press.

Borrie, W D. 1970. The Growth and Control of World Population. London: Weidenfeld and Nicholson.

Boughey, Arthur S. 1975. Man and the Environment. 2nd edition. New York: Macmillan.

Childe, V Gordon. 1951. Social Evolution. New York: Henry Schuman.

Childe, V Gordon. 1954. What Happened in History. Revised edition. Harmondsworth, Middlesex: Penguin Books.

Coale, Ansley J. 1974. “The History of the Human Population”. Scientific American 231 (September): 41-51.

Deevey, Edward S, Jr. 1960. “The Human Population”. Scientific American 203 (September): 194-204.

Desmond, Annabelle. 1962. “How Many People Have Ever Lived on Earth?” Population Bulletin 18 (February): 1-19.

Ehrlich, Paul R, Richard W Holm, and Irene L Brown. 1976. Biology and Society. New York: McGraw-Hill.

Hardin, Garrett. 1960. “The Competitive Exclusion Principle”. Science 131 (April 29): 1292-97.

Hollingsworth, T H. 1969. Historical Demography. Ithaca, New York : Cornell University Press.

Lenski, Gerhard, and Jean Lenski. 1978. Human Societies: An Introduction to Macrosociology. 3rd edition New York: McGraw-Hill.

Mumford, Lewis. 1934. Technics and Civilization. New York: Harcourt, Brace.

Nam, Charles B, editor. 1968. Population and Society. Boston: Houghton Mifflin.

Potter, David. 1954. People of Plenty: Economic Abundance and the American Character. Chicago: University of Chicago Press.

Singer, Charles, E J Holmyard, and A R Hall, editors. 1954. A History of Technology. 5 volumes. Oxford: Clarendon Press.

Ubbelohde, A R 1955. Man and Energy. New York: George Braziller.

Webb, Walter Prescott. 1952. The Great Frontier. Boston: Houghton Mifflin.

Posted in Overpopulation | Comments Off on William Catton, Chapter 2 of Overshoot: The Tragic Story of Human Success

Rapid Population Growth in California: A Threat to Land and Food Production

David & Marcia Pimentel. June 2, 2008. Rapid Population Growth in California: A Threat to Land and Food Production. Cornell University, College of Agriculture and Life Sciences

Are Californians —who are now coping with overcrowded cities, jammed highways, and a damaged environment— prepared for future population growth? Consider that by 2035, California’s population will approximately double to 64 million (39 million now), if current population growth continues. This projection is based on the state’s current 2% annual growth rate —a rate that is greater than the national growth rate of 1.1% and is generated primarily by the high immigration rate, both legal and illegal.

All human activities, economical enterprises, environmental preservation and food production systems will suffer when human numbers exceed the basic resources that support human life. If the population continues to climb, food security —the potential to produce enough food so that people in California can lead healthy and productive lives— will be significantly stressed. The future status of agricultural production is especially critical, as vital resources like arable land, clean water, adequate energy, and abundant biodiversity are rapidly depleted throughout California and the world.

Land Availability

Of the 2.3 billion acres of land in the United States, only 460 million acres, or 20%, are considered suitable for agricultural production. California has a fair amount of that fertile land, and ranks first in agricultural production in the U.S. However, a loss of agricultural land, and subsequent decrease in production, is imminent if current population trends continue. Essentially, the U.S. population, including California’s, is increasing geometrically while arable land per capita is simultaneously decreasing (Figure 1). This fertile land is lost to urbanization and industrial spread, transportation systems, and wind and water erosion.

At present, about 8% of the 100 million acres in California —8 million acres— are devoted to crops. Yet each year about 122,000 acres —1.5%— are lost from production when swallowed by urban and industrial spread. As the population grows, more and more people need a place to live and work, placing increasing demands on limited land areas. In general, each person added to the population requires approximately 1 acre of land for urbanization and highways. When the California population doubles to 64 million, as projected for 2035, about 32 million of California’s 100 million acres will need to be used for the housing, employment, and transportation of those 32 million additional people. Does California have that much land to spare even today?

Arable soil consists of only about the top 6 inches of soil; this fertile soil is easily lost by wind and water erosion. Stated simply, erosion occurs when the soil is exposed to energy from wind or water, like rainfall or running water. Poor farming tactics, such as the failure to practice crop rotation or to use wind blocks, can increase rates of erosion. Agricultural land in the United States typically erodes at a rate of about 6t/ha/year (2.47 acres = 1 hectare) for pasture land to 13t/ha/year for cropland, so a significant portion of California’s current 8 million acres of agricultural land are lost each year to erosion. Finally, salinization and/or waterlogging of soil from irrigation can further diminish the productivity of the land. And when crop production is curtailed, food prices will increase and the economic health of the state will suffer.

Agricultural production in California totals $20 billion each year, contributing a significant amount to the state’s income. The major agricultural counties in California are Fresno, Tulare, and Monterey, with annual sales of $2.1, $1.4, and $1.2 billion per year respectively. Much of this income could easily be lost unless California’s agricultural land base is protected from further population growth.

It is projected that in about 60 years, per capita agricultural land will be reduced to approximately half of what it is today. With a decreased supply and increased demand for food, food prices are expected to increase by 3-to-5 times current prices. So, even if the total dollar value of sales doesn’t decline as a direct result of the increased demand for diminished supply, the land area devoted to farms —and the number of farms— may be half what it is today. This change in the farming system will have a major impact on the economy of California and its people.

All told, California stands to lose a substantial amount of available farm land, at a substantial economic loss, if the population continues to grow. In fact, if the current rate of land loss continues, in less than 33 years approximately half of California’s cropland will no longer be available for production. In addition, the growing numbers of humans stress other natural resources, including water, energy, and the environment, that are also vitally important to agricultural production.

Water Resources

California, like many western U.S. states, is considered an arid state, with rainfall levels between 200 and 500 mm per year. The average American uses about 1,450 gallons/day/capita of water to meet all his/her needs, including agricultural production. Unfortunately, to provide the ever-increasing amounts of water necessary for a steadily increasing population, overdraft is already occurring from surface and ground water resources. For example, by the time the Colorado River enters the Gulf of California, it is literally a small trickle. The seven adjacent states —among them California, Nevada, Colorado, and Arizona— remove enormous amounts of water to meet their local needs, but return little or no water to the rapidly diminishing supply. Americans, especially those in arid states like California, are going to have to conserve and reduce their water use sooner rather than later, as the amount of available water per capita rapidly diminishes.

California agriculture consumes 80% of the pumped water in the state. For decades, providing water for agricultural, industrial, and home use has required massive efforts to channel water from afar to where it was needed in urban and agricultural areas. For instance, about 250 gallons of water are needed to produce 1 pound of grain. To irrigate an acre of corn requires nearly 1 million gallons of water during the 3 to 4 month growing season. Nearly all of California’s cropland, plus large percentages of forage and pasture land, are irrigated. The total land area currently irrigated in California is about 7.6 million acres.

At present, much of the irrigation water is being applied to low value crops like forage alfalfa and rice. This practice is possible only because the federal government provides generous subsidies —estimated at approximately $1.5 billion annually— to pay for the irrigation. This situation will change in the future when California agricultural requirements compete more intensely with the needs of a rapidly growing human population and industry. At present, irrigation water is cheap for the farmer, but since the water supply is limited and cannot be increased very much, available water will have to be shared, and at a higher price than at present. And as quality cropland is lost to urbanization and erosion, poor quality marginal land will probably need to be used for growing crops —land will surely require irrigation, further stressing the limited water supplies and increasing irrigation costs.

Energy Resources

People depend on a variety of sources of energy —wind, hydropower, solar energy, fossil fuels, and even energy from animals and people— to meet their basic needs. In most developed areas, including California, the primary source of energy is fossil energy from oil, gas, and coal. Like most U.S. farmers, California farmers use large amounts of fossil fuels to run their farm machinery and irrigation systems; about 17% of U.S. fossil energy expenditure supports our food system. Energy is also used to manufacture the fertilizers and pesticides needed by farmers as well as to power food processing and food transport systems.

Fossils fuels are a finite resource; once gone, their supplies cannot be replenished. Numerous studies indicate that the U.S. has only about 20 years of oil reserves and about 30 years of natural gas reserves left, given current levels of use. A steadily increasing population will place even greater demands on these limited supplies, requiring more and more oil to be imported from other countries. According to the U.S. Department of Energy, about 60% of our oil supply is currently being imported; nearly 100% will be imported by 2015.

In most of our lifetimes, and certainly in our children’s, we will witness the essential depletion of our U.S. oil reserves. As domestic oil supplies grow increasingly scarce, the price of gasoline and associated products will eventually rise. Then, both the high cost and limited availability of oil and other fossil fuels will restrict all human activities, including the expansion of modern intensive agriculture. Californians will need to produce even more food to feed the growing population, but will lack the energy resources to expand the agriculture systems.

Environment

In the late 1800’s, when California’s population reached 1 million, significant damage to the natural environment already was apparent. With each additional human added to the state’s current population of 32 million, the impact on California’s environment is intensified.

Californians are well aware of the air pollution in their cities and towns. For example, the ozone levels in Los Angeles, which has the highest density of automobiles per person in the world, well exceeds the EPA standard. The average exposure to carcinogens there is as much as 5000 times above the acceptable EPA level. Beyond harm to human health, air pollutants are also hazardous to crops and cause several million dollars worth of lost crops each year. As it becomes more and more difficult to feed increasing numbers of people, we cannot afford to lose any crops to pollution.

To date, about 91% of California’s wetlands have been drained and/or altered to provide more room for human activities. Loss of wetlands has significantly reduced the natural biodiversity in the state. Biodiversity is another finite resource; when a species is lost, it cannot be replaced. Maintaining biodiversity in plants, animals, and microbes is essential for the productivity of agriculture and forestry systems, the development of pharmaceutical products, the protection of the evolutionary processes that stabilize ecosystems, and for sustaining a quality environment for present and future generations.

In addition to the ongoing soil erosion and salinization associated with agriculture, water resources are being contaminated with sediments, pesticides, fertilizers, and salts. Livestock wastes, which are increasing in some areas, are a public nuisance and also seriously pollute waterways. As the population continues to grow, and as more livestock and food crops are required to feed the increasing numbers of humans, these environmental problems are expected to increase.

All these problems, from pollution to loss of biodiversity, will continue and intensify as long as the human population and its diverse activities continue to expand in California.

Conclusions

For the following reasons, California agriculture will be limited in the future, based on anticipated population growth and available resources: (1) substantial amounts of fertile agricultural land are lost each year to urbanization and erosion; (2) the water supply available for irrigation and other human uses is already severely stressed —current levels of use cannot be sustained much longer; (3) domestic fossil energy stores, the major source of power for agricultural production, are close to depletion; and (4) environmental damage in the form of polluted land, air, and water and lost biodiversity will limit the future development of crops and livestock.

As the human population in California, and throughout the world, continues to climb, the finite resources necessary for successful agricultural production will continue to be depleted; as these resources grow increasingly scarce, food production will be more limited and more expensive. As it becomes harder to feed the growing numbers of humans, our quality of life, even in developed countries like the United States, will decline. Our diet will change as food choices becomes more limited, depending less on animal protein and more on grain, legumes, and fruits and vegetables. As food becomes more expensive, Americans will need to spend more and more of their income —30 to 50% as compared to the current 15%— on food. With less money available to spend and less land available for recreation and other activities, our lifestyles may be significantly modified.

Many people propose that technological advances will save us, that we will figure out ways to cope with our increasing population and diminishing resources. While technology has produced many positive benefits for humankind, it cannot increase the supply of our basic resources; technology cannot increase the land area of California or produce fresh water, fertile soil, or fossil fuels. In fact, realizing the potential of technology rests of the continued availability of our basic land, water, energy, and biotic resources.

Conserving remaining natural resources is a necessary starting point for preserving our health and quality of life. However, conservation measures alone will not be sufficient to ensure food security for future generations unless population growth is curtailed. Private citizens and public leaders in California need to work together to stabilize their population. Their aim should be to insure that future generations have a secure food supply and a life style they can enjoy. As the basic per capita resources decrease and the quality of the natural environment declines, personal freedom to have adequate, healthy food, to earn a satisfactory living and to enjoy nature no longer will be an option. The lives and livelihood of future Californians depend on what action present generations are willing to take to reduce population numbers. Otherwise, the harsh realities of nature will impose a drastic solution for us.

Posted in Overpopulation, Peak Topsoil, Peak Water, Water | Tagged , , | Comments Off on Rapid Population Growth in California: A Threat to Land and Food Production

Nothing is So Powerful As an Exponential Whose Time Has Come

Donella Meadows on: Nothing is So Powerful As an Exponential Whose Time Has Come

The reason environmentalists are often so gloomy is that they know what the word “exponential” means.

“A lack of appreciation for what exponential increase really means leads society to be disastrously sluggish in acting on critical issues,” said Dr. Thomas Lovejoy of the Smithsonian Institution in a speech that has been reverberating through the environmental community. “I am utterly convinced that most of the great environmental struggles will be either won or lost in the 1990s, and that by the next century it will be too late.”

What’s he talking about? What does exponential increase mean?

It means growing like this: 1, 2, 4, 8, 16, 32. Doubling and then doubling again and then doubling again. Everyone understands that, right?

Not really, not at a gut level. For example: suppose you agree to eat one peanut on the first day of the month, two peanuts on the second, four peanuts on the third, eight peanuts on the fourth, and keep doubling every day. How long do you think you can keep going? How long will a pound can of shelled peanuts last you?

The first pound of peanuts will be gone on the ninth — you’ll eat half the can that day and feel pretty queasy. On the tenth you’ll eat a whole pound, if you can, which I doubt. By the fifteenth you’ll be scheduled to eat 32 pounds of peanuts. You’ll have to eat roughly your own weight in peanuts by the 17th; on the 21st the total will have risen to one ton; and by the end of the month, assuming a 30-day month, it will be 500 tons.

Just a few doublings add up ferociously fast — that’s what Thomas Lovejoy was saying.

Mexico, with a population of 84 million and a doubling time of 29 years, will, if it keeps that up, grow to 168 million in 29 years and to 672 million within the lifetime of a child born today. That’s nothing compared to Kenya, which has a doubling time of 17 years. If it goes on growing at that rate, in 70 years there will be ten Kenyans for every one today.

Until the 1970s world oil consumption was growing at seven percent per year. That means doubling every ten years. (The doubling time of anything growing exponentially is 70 divided by its annual growth rate — 70 divided by seven percent is a ten-year doubling time.) Every ten years we used as much oil as we had used in all previous history. Every ten years we had to go out and discover as much oil as we had ever discovered before — and then, to keep going, discover twice that much in the next ten years.

We didn’t keep going. We couldn’t have. Exponential growth makes the cupboard bare very fast. Even if the entire earth were filled with nothing but high-grade crude oil, if we used it with an annual growth rate of seven percent, it would be gone in 342 years. There’s still plenty of oil around now, but we’ve been burning it faster than we’ve been discovering it for 20 years now.

You may have heard that we have 1000 years’ worth of coal. If we burn 7 percent more of it each year than the year before (which we may well do, substituting it for the disappearing oil), it will last just 61 years, and it will bring on global climate change much faster than even the worst pessimists are now expecting.

Said Dr. Lovejoy, “I find to my personal horror that I have not been immune to naiveté about exponential functions. While I have been aware that the … loss of biological diversity, tropical deforestation, forest dieback in the northern hemisphere, and climate change are growing exponentially, it is only this very year that I think I have truly internalized how rapid their accelerating threat really is.”

You don’t get much reaction time when your problems grow exponentially. My favorite story to illustrate that point is an old French riddle.

Suppose you own a pond on which a water lily is growing. The lily doubles in size each day. If the lily were allowed to grow unchecked, it would completely cover the pond in 30 days, choking off other forms of life in the water. For a long time the plant is almost invisible, and so you decide not to worry about cutting it back until it covers half the pond. On what day will that be?

On the twenty-ninth day.

We are emitting carbon dioxide and several other greenhouse gases in the atmosphere exponentially. We are clearing tropical forest at an exponential rate. The human population is growing exponentially. Human energy use, human production of synthetic chemicals, deserts, and trash are growing exponentially. Our economy is growing exponentially, and we cheer it on, although an economic growth rate of, say, 3.5 percent per year means another whole industrial world plopped down on top of this one in just two decades.

We can’t keep it up. If we understood the consequences of exponential growth, we wouldn’t even want to try.

Posted in Exponential Growth | Comments Off on Nothing is So Powerful As an Exponential Whose Time Has Come

Nering on the Mirage of a Growing Fuel Supply

4 June 2001. Evar D. Nering. The Mirage of a Growing Fuel Supply. New York Times.

In my classes, I describe the following hypothetical situation:

We have a 100-year supply of oil if it were consumed at its current rate. But the oil is consumed at a rate that grows 5 percent a year. How long will it last?  36 years

Let’s say we underestimated the supply, and we actually have a 1,000-year supply with the same 5% growth rate in use.  How long will the oil last now? 79 years

We strike a bonanza and have a 10,000-year supply. At our same 5% rate of growing use, how long will it last? 125 years 

The point of this analysis is that it really doesn’t matter what the estimates are.

There is no way that a supply-side attack on America’s energy problem can work.

The exponential function describes the behavior of any quantity whose rate of change is proportional to its size. Compound interest is the most commonly encountered example – it would produce exponential growth if the interest were calculated at a continuing rate. I have heard public statements that use “exponential” as though it describes a large or sudden increase. But exponential growth does not have to be large, and it is never sudden. Rather, it is inexorable.

Calculations also show that if consumption of an energy resource is allowed to grow at a steady 5 percent annual rate, a full doubling of the available supply will not be as effective as reducing that growth rate by half – to 2.5 percent. Doubling the size of the oil reserve will add at most 14 years to the life expectancy of the resource if we continue to use it at the currently increasing rate, no matter how large it is currently. On the other hand, halving the growth of consumption will almost double the life expectancy of the supply, no matter what it is.

This mathematical reality seems to have escaped the politicians pushing to solve our energy problem by simply increasing supply. Building more power plants and drilling for more oil is exactly the wrong thing to do, because it will encourage more use. If we want to avoid dire consequences, we need to find the political will to reduce the growth in energy consumption to zero – or even begin to consume less.

I must emphasize that reducing the growth rate is not what most people are talking about now when they advocate conservation; the steps they recommend are just Band-Aids. If we increase the gas mileage of our automobiles and then drive more miles, for example, that will not reduce the growth rate.

Reducing the growth of consumption means living closer to where we work or play. It means telecommuting. It means controlling population growth. It means shifting to renewable energy sources.

To do otherwise is to leave our descendants in an impoverished world.

Nering is professor emeritus of mathematics at Arizona State University.

Posted in Exponential Growth | Comments Off on Nering on the Mirage of a Growing Fuel Supply

Poverty is Increasing

4 Apr 2013. 21 Statistics About The Explosive Growth Of Poverty In America That Everyone Should Know. TheEconomicCollapseBlog.com

A few of the 21 stats:

Fottrell, Q. December 23, 2015. Most Americans have less than $1,000 in savings. MarketWatch.com

Approximately 62% of Americans have less than $1,000 in their savings accounts and 21% don’t even have a savings account, according to a new survey of more than 5,000 adults conducted this month by Google Consumer Survey for personal finance website GOBankingRates.com. “It’s worrisome that such a large percentage of Americans have so little set aside in a savings account,” says Cameron Huddleston, a personal finance analyst for the site. “They likely don’t have cash reserves to cover an emergency and will have to rely on credit, friends and family, or even their retirement accounts to cover unexpected expenses.

This is supported by a similar survey of 1,000 adults carried out earlier this year by personal finance site Bankrate.com, which also found that 62% of Americans have no emergency savings for things such as a $1,000 emergency room visit or a $500 car repair. Faced with an emergency, they say they would raise the money by reducing spending elsewhere (26%), borrowing from family and/or friends (16%) or using credit cards (12%). And among those who had savings prior to 2008, 57% said they’d used some or all of their savings in the Great Recession, according to a U.S. Federal Reserve survey of over 4,000 adults released last year. Of course, paltry savings-account rates don’t encourage people to save either.

In the latest survey, 29% said they have savings above $1,000 and, of those who do have money in their savings account, the most common balance is $10,000 or more (14%), followed by 5% of adults surveyed who have saved between $5,000 and just shy of $10,000; 10% say they have saved $1,000 to just shy of $5,000.

Some age groups are less likely to have savings than others. Some 31% of Generation X — who are roughly aged 35 to 54 for the purpose of this survey — while being older and presumably more experienced with money than their younger cohorts, actually report a savings account balance of zero, which is the highest percentage of all age groups. Around 29% of millennials — aged 18 to 34 — and 28% of baby boomers — aged 55 to 64 — said they have no money in their savings account. Baby boomers (17%) and seniors aged 65 and up (20%) have the most money saved of any age group while less than 10% of millennials and approximately 16% of Generation X have $10,000 or more saved.

Posted in Poverty | Tagged , , | Comments Off on Poverty is Increasing

Natural Gas Facts and Statistics

Impurities can also be present in large proportions, including carbon dioxide (CO2), helium, water, nitrogen and hydrogen sulfide (H2S), but also mercury. All of these impurities, especially CO2 and H2S, must be removed from the natural gas stream before transport and commercialization. CO2 and H2S can corrode pipelines, are highly toxic and are significant sources of air pollution. Gases with high levels of H2S and CO2 are also called sour gases.

Impurities can also be present in large proportions, including carbon dioxide (CO2), helium, water, nitrogen and hydrogen sulfide (H2S), but also mercury. All of these impurities, especially CO2 and H2S, must be removed from the natural gas stream before transport and commercialization. CO2 and H2S can corrode pipelines, are highly toxic and are significant sources of air pollution. Gases with high levels of H2S and CO2 are also called sour gases.

SBC. October 2014. Factbook Natural Gas Factbook. SBC Energy Institute

  • 83% of natural gas comes from conventional reservoirs: 2.9 trillion cubic meters
  • 13% of reservoirs account for 70% of global reserves
  • The number of discoveries of giant fields has fallen since 1972
  • 17% comes from unconventional resources: .6 tcm and 43% of that (2.6 tcm) was produced in the US. In 2013, shale gas accounted for 39% of total natural gas output in the US
  • At 3.5 trillion cubic meters (tcm) world-wide production in 2013, reserves will last from Rystad’s 2014 estimate 60.4 tcm for 17 years, or 58 years if OPEC’s estimate of 200 tcm reserves is correct. Page 24  
  • Technically recoverable resources (the volume of natural gas recoverable with current exploration and production technology and no regard to cost) are 855 tcm and would last 244 years @ 3.5 tcm/year (if we can get them).
  • Conventional
  • Conventional reservoirs tend to require less technology to be developed and to yield higher recovery rates. However, reservoirs located in deep water or Arctic environments, and those containing a high level of sour gas may also be very challenging to develop.

We are counting on shale gas, but we’re drilling the best “sweet” spots, and even so, it declines rapidly:

shale gas declines fast graph


Due to the properties of the source rock, shale-gas wells usually exhibit early production peaks and then enter rapid decline – typically 50% over 3 years. In addition, shale-gas plays concentrations of recoverable generally have lower resources – typically around 0.04-0.6 bcm/km2, compared with an average of 2 bcm/km2 in the case of conventional resources. Consequently, shale-gas production requires more wells.

Conventional Tight Gas Shale Gas Coalbed Methane
Proved reserves (tcm) 60.4 78.0 4.9 0.98
USA reserves   (tcm) 3.2 10.4 0.8
Technically recoverable resources (tcm) 519.0 2.3 210.0 48.0
Current Production bcm/y 2831.0 215.0 266.0 71.0
USA Production   bcm/y 211.8 133.2 242.3 52.8
Cost of production per Mbtu $0.2 – 9 (a) $3 – 9 (b) $2-10 © $3-8 (d)
Recovery Factor % 60-80 30-50 8-30 50-85

Sources:

(a) Source: IEA (2013), “World Energy Outlook 2013”; Rystad databases (accessed May 2014); BP (2013), “BP Statistical World Energy Review 2013”
(b) Rystad databases (accessed May 2014); IEA (2013), “Resources-to-Reserves 2013”; Schlumberger (2011), “Basic Petroleum Geochemistry for Source Rock Evaluation”
(c) Schlumberger (2011), “Shale Gas: A Global Resource”; Schlumberger (2006), “Producing Gas from Its Source”; Rystad databases (accessed May 2014); IEA (2013), “Resources-to-Reserves 2013”
(d) Schlumberger (2009), “Coalbed Methane: Clean Energy for the World”; Rystad databases (accessed May 2014); IEA (2013), “World Energy Outlook”

The slide below is especially scary because it shows that USA conventional reserves are only 26%:

world reserves by 4 types of NG Rystad database April 2014


And the United States is producing its reserves at a very rapid rate:

NG production world-wide Rystad database

Proved reserves are based on figures from the Organization of the Petroleum Exporting Countries (OPEC) and Rystad (P90 for the latter). They correspond to those quantities of natural gas which, by analysis of geological and engineering data, can be estimated with reasonable certainty to be commercially recoverable, from a given date forward, from known reservoirs and under current economic conditions, operating methods, and government regulations.

Like CO2, methane is a potent greenhouse gas (GHG). However, it has a higher global warming potential (GWP) than CO2. According to the IPCC, methane GWP would be 28 to 84 times higher than CO2 GWP over 100-year and 20-year horizons, respectively.

While abundant, the largest conventional gas resources are concentrated in a small number of countries. In the 2000s, it was thought that Russia, Iran and Qatar owned more than 70% of known conventional gas resources, but recent discoveries of conventional reservoirs in East Africa and the Mediterranean Sea have opened up new gas frontiers, reducing the concentration of natural gas reserves.

According to OPEC, natural gas production was led by North America, Russia, and the Middle East; of this, 83% came from conventional reservoirs.

Raw natural gas collected at the wellhead needs to be processed to meet pipeline quality standards, to ensure safe and clean operations, and to extract valuable natural gas liquids (NGLs). As of 2013, there are close to 2, 000 gas-processing plants operating worldwide, with a global capacity of around 7.6 billion cubic meter (bcm) per day.

About 21% and 10% of all produced natural gas is now traded internationally via, respectively, pipelines and LNG. As a rule of thumb, the longer the shipping distance, the more economically attractive LNG tends to become compared with pipelines. Growth in the LNG trade has been made possible by the expansion of LNG infrastructure: there are now 29 countries with import facilities and 19 with export facilities, trading 237 million tons per annum (Mtpa) of LNG. With new export and regasification facilities under construction, the expansion is expected to continue. Meanwhile, floating liquefaction and regasification concepts have garnered attention as a way of reducing development time, increasing flexibility and lowering capital costs. The first floating storage and regasification units (FSRU) have been commissioned. Four floating liquefaction (FLNG) projects have achieved a final investment decision. Nevertheless, many gas fields are too small or remote to justify pipelines or LNG investment. In order to tap these resources, known as stranded gas, two alternative technologies are being considered: compressed natural gas (CNG) and gas-to-liquids (GTL).

The buildings segment still accounts for 22% of direct natural gas demand and this share is expected to remain stable in the next few decades. Thermal applications are dominant: space heating, water heating and cooking account for 54%, 22% and 11% of natural gas demand in the buildings sector, respectively. The use of natural gas in buildings varies significantly, depending on climate, urbanization patterns, or building design and insulation.

In industry, natural gas is used as a heat source, but also as a chemical feedstock. Direct natural gas consumption represents around 18% of final energy consumption in industry. The chemicals and petrochemicals sectors are by far the most important consumers (accounting for 44% of total industry demand for gas). This is because natural gas is largely used as a source of heat in refineries and as feedstock for producing ammonia and methanol. Other than for chemicals, the bulk of industrial gas demand comes from small-scale industrial consumers using natural gas in small-to medium-scale boilers to generate heat. Any switch from coal to gas in the industrial sector is likely to be relatively limited and subject to the development of carbon pricing.

Conventional gas refers to resources accumulated in a reservoir in which buoyant forces keep hydrocarbons in place below a sealing cap rock. Reservoir and fluid characteristics typically permit natural gas to flow readily into a wellbore. The term unconventional reservoirs, in which gas might throughout a reservoir at the basin scale, and in which buoyant forces are insufficient to expel gas from the reservoir, meaning that intervention is required. Conventional gas reservoirs can either be isolated (non-associated) or associated with oil. Associated gas can be in form of a gas cap (free gas) or it can exist in solution within the oil (solution gas). Natural gas was long considered an unwanted byproduct of oil and was only considered as a commercial prospect when deposits were located close to markets or gas infrastructure.

Coalbed methane is generated during the formation of coal and is contained to varying degrees within all coal microstructure. Because of coal’s porous nature and its many natural cracks and fissures, coal can store more gas than a conventional reservoir of similar volume. However, production from CBM wells can be difficult because of the low permeability of most coal seams. As a result, technologies such as directional drilling and hydraulic fracturing are used to open access to larger areas, enhancing well productivity. Finally, CBM production is often associated with extensive production of water. Water must be removed in order to reduce pressure within the reservoir, making lifting and surface separation more complex and costly. CBM production is advanced in the U.S., Canada and Australia.

Pipelines

Pipelines are the backbone of gas transportation, with a global network of 1. 4 million kilometers

Globally, more than 89% of natural gas is transported along a 1.4 million km pipeline grid. One-third of this network are lines transporting large pressure, large-diameter (6’’-48’’) pipelines. The other two-thirds comprise thinner pipelines at production sites, called gathering lines, and the medium- and low-pressure distribution grids that supply end-customers. Pressure is required to maintain the gas flow. As a result, compression stations are located every 80-160 kilometers along the transport grid. Each station contains one or several compressor units (up to 16). These are classified by their horsepower (up to 50,000-80,000) and gas capacity (up to 90 Mcm/d). Compressors can use a motor (reciprocating) or a turbine (known as centrifugal). Gas-filtering, but also cooling and heating facilities are often included in the station to maintain gas temperature. Gas transport pipelines are usually made of carbon steel and protected against corrosion by external coating and cathodic protection systems.

Pipeline costs vary significantly according to capacity, length and their physical environment, but are dominated by the costs of labor and materials.

Before liquefaction, natural gas must be cleaned to remove contaminants, which might freeze during liquefaction or corrode pipelines. Heavier hydrocarbons are also extracted to meet gas specifications.

LNG

Several liquefaction projects are in development in the U.S., but most are awaiting final investment decisions. Sabine Pass is the only project under construction as of 2014.

Australia is the third largest LNG exporter (22.2 mtpa, or 10% of world exports) after Qatar (77.2 mtpa) and Malaysia (24.7 mtpa) but ahead of Indonesia (17 mtpa). However, Australia, where 53% (63.8 mtpa) of the liquefaction capacity under construction worldwide is located, is expected to take over Qatar as the largest LNG exporter by 2020.

Natural gas prices: for distances up to 9,000 km, LNG tends to require more energy than pipelines, making it more exposed to price increases (i.e. the break-even point between pipeline and LNG may occur over a longer distance than when a pipelines system is used).

Many gas fields are too small or too remote to justify investment in pipelines or LNG facilities. In some environments, the use of pipelines is simply not practical. A possible alternative is compressed natural gas, which is already being used for local gas distribution onshore, but whose application offshore, although conceptually CNG’s main benefit is that it requires relatively little infrastructure, so capital requirements are low : compression is a common feature of most gas-production units and less costly than liquefaction; offloading requires simple buoys. However, CNG has a lower energy density than LNG (typically around one-third, depending on the pressure). As a result, investments in CNG carriers are greater and operating costs are also higher (notably fuel costs).

If the US ever needs to import LNG because shale gas gets too expensive to drill, there are very few regasification plants:

US and south america regasification plants


LNG is very expensive as well
LNG cost breakdown


NG vs coal power plants


energy demands by fuel in buildings and homes


Aluminum, pulp & paper, cement, iron & steel, and chemicals & petrochemicals are the main energy-intensive industries and together account for more than 50% of industrial energy demand

Aluminum, pulp & paper, cement, iron & steel, and chemicals & petrochemicals are the main energy-intensive industries and together account for more than 50% of industrial energy demand


Natural gas plays an important role as a feedstock for producing ammonia, methanol and other hydrocarbon-based products (e.g. olefins, such as ethylene and propylene, using natural gas liquids2). Ammonia is one of the most extensively produced chemicals in the world, helping to create over 500 million tons of nitrogen fertilizer per year. Similarly, methanol is a widespread chemical product, with around 100 million tons used every year as anti-freeze, solvent or fuel. In recent decades, natural gas has become the primary feedstock in ammonia and methanol production. Low natural gas prices and progress in plant design encouraged its use, leading to gains in energy efficiency. Steam methane reforming represents around 77% of hydrogen produced as a basis for ammonia; 75% of methanol production comes from natural gas. In both cases, the remainder is mainly made up of coal

June 2014: The Middle East has 43.2% of the total natural gas deposits in the world (80.3 trillion cu/m) according to the BP Statistical Review of World Energy June 2014 report. Qatar has 24.7 trillion cu/m with Saudi Arabia next in line containing 8.2 trillion cu/m in the region. he International Energy Agency (IEA) has, however, stated that the demand for natural gas will exceed its production from Middle East countries by the year 2019.

25 Jan 2013. Rush to Natural Gas has Coal-fired utilities Seeing Red. Wall Street Journal.

Electricity from Natural Gas is now 30%, up 12% from 10 years ago (18%). From coal:  now 37%, down 13% from 10 years ago (50%)

U.S. electricity in trillions of kWh (kilowatt hours):

  • Coal 1.7 Trillion
  • Natural Gas 1.0 Trillion
  • Nuclear .79 Trillion

Some prefer coal power plants, where coal can be stockpiled. Gas is hard to store in bulk near power plants, making plants dependent on natural gas pipelines that simetimes have delivery issues.

Only 3 states buy gas under contracts longer than 3 years (OR, CO, OK).

More than you wanted to know about Natural gas. Below are excerpts. You’d be far better off reading in pdf format where all the pictures and graphs are): SBC. October 2014. Factbook Natural Gas Factbook. SBC Energy Institute. 87 pages

Natural gas is not solely methane. It is composed of a mixture of hydrocarbon components, including methane but also ethane, propane, butane and pentane– commonly known as natural gas liquids (NGLs)– and of impurities such as carbon dioxide (CO2), hydrogen sulfide (H2S), water and nitrogen. The composition is highly variable and depends on the resource’s location. In some fields, contaminants, especially those that characterize sour gas (CO2 or H2S), represent a high proportion of the natural gas mixture, making exploitation harder and more expensive. Sometimes, NGLs – hydrocarbons that are in gaseous form in the reservoir, but that become liquid under ambient conditions– account for a significant share of natural gas; a mix rich in NGLs, known as wet gas. In 2013, wet gas yields 9 million barrels of oil equivalent a day, contributing 10% to global liquid hydrocarbon supply. In all situations, natural gas must be processed to remove NGLs and contaminants.

Natural gas’s main drawbacks relative to other hydrocarbon fuels are its low volumetric energy density and gaseous nature, which makes it harder to handle than solid or liquid fuels. In order to be transported, natural gas needs to be conditioned in some way– either by compression or by liquefaction. This increases shipping costs and results in limited fungibility. The global-warming potential of its main constituent, methane, presents another problem. Similar to CO2, methane is a potent greenhouse gas. However, an equivalent quantity of methane emitted into the atmosphere would entail 84 and 28 more radiative forcings than CO2 over 20- and 100-year horizons, respectively. As a consequence, methane leaks from natural gas systems, if significant and not mitigated, could negate the climate benefit of natural gas compared with other fuels

Natural gas is an energy source that can be used as gaseous fuel, but also in non-gaseous forms– for instance, as electricity after conversion in a turbine or as a liquid after conversion in a gas-to-liquids plant.

Natural gas systems rely on a complex, infrastructure-intensive value chain for extracting, processing, transporting and distributing energy to end customers.

Natural gas resources are usually classified according to the properties of the reservoir in which they are trapped. Resources are referred to as conventional when accumulated in a reservoir whose permeability characteristics permit natural gas to flow readily into a wellbore; and as unconventional when buoyancy forces are insufficient and intervention is required to make the gas flow. Conventional reservoirs are broken down further into, respectively, the non-associated and associated categories, depending on whether gas is found in isolation or dissolved in oil.

There are four main types of unconventional reservoir: tight, shale, coalbed and methane hydrates. Tight and shale accumulations refer to low permeability formations. However, unlike in tight reservoirs, gas in shale rocks has remained in the rock where it formed, making exploration and production more difficult.

Coalbed methane (CBM) is generated during the formation of coal and is contained to varying degrees within all coal microstructure. The presence of this gas is well known from underground coal mining, where it presents a serious safety risk. It is called coal-seam methane in Australia, where it is an important resource. However, producing from CBM wells can be difficult because of the low permeability of most coal seams and the associated production of large volumes of water. In general, unconventional reservoirs tend to yield lower recovery rates than conventional reservoirs, and usually require more technology.

Two technologies have been instrumental in exploiting unconventional resources. Hydraulic fracturing, which involves creating cracks in the rock through which the gas can flow to the wells; and horizontal drilling, which enables wells to penetrate a greater length of the reservoir than is possible with vertical wells, increasing contact with the production zone.

Taken together, natural gas resources are abundant. Depending on data sources and the definition used for reserves, reserves amount to between 69 and 200 trillion cubic meters (tcm) and technically recoverable resources amount to up to 855 tcm. Reserves would, therefore, last between 20 and 58 years, based on a figure for gas consumption in 2013 of 3.5 tcm. Technically recoverable resources, meanwhile, would last over 200 years. While abundant, the largest conventional gas resources are concentrated in a small number of countries. In the 2000s, it was thought that Russia, Iran and Qatar owned more than 70% of known conventional gas resources.

Unconventional resources are much more widespread and recent discoveries of conventional reservoirs in East Africa or the Mediterranean Sea have opened up new gas frontiers, reducing the concentration of natural gas reserves.

According to the OPEC, natural gas production reached 3.5 tcm in 2013, led by North America, Russia, and the Middle East; of this, 83% came from conventional reservoirs. However, while conventional reservoirs continue to dominate production, output from unconventional accumulations grew 9 times faster than conventional production in 2013, reaching 0.6 tcm. Production from shale reservoirs in the U.S. has been the main driver of growth and now represents 43% of global unconventional gas production. Going forward, natural gas production is expected to continue to increase, driven by unconventional resources and new conventional resources (associated and non-associated gas). For instance, Rystad forecasts that natural gas production will reach 4.6 tcm by 2035.

Complex infrastructure is needed to get natural gas to end-users – processing plants, transport & distribution grids, and storage units

Raw natural gas collected at the wellhead needs to be processed to meet pipeline quality standards, to ensure safe and clean operations, and to extract valuable natural gas liquids (NGLs). As of 2013, there are close to 2, 000 gas-processing plants operating worldwide, with a global capacity of around 7.6 billion cubic meter (bcm) per day. More than half of capacity is located in North America, but the Middle East and Asia, where utilization rates (i.e. gas processing throughput / gas-processing capacity) are much higher than in the U.S., are expected to take over as market drivers.

The low energy density of natural gas has long been an impediment to long- distance transportation, and most natural gas is still consumed close to production centers. However, long-distance trade has increased steadily in recent decades. Along with pipelines, which have been in use since the 19th century, LNG is playing a growing role in long-distance shipping. About 21% and 10% of all produced natural gas is now traded internationally via, respectively, pipelines and LNG. As a rule of thumb, the longer the shipping distance, the more economically attractive LNG tends to become compared with pipelines. Growth in the LNG trade has been made possible by the expansion of LNG infrastructure: there are now 29 countries with import facilities and 19 with export facilities, trading 237 million tons per annum (Mtpa) of LNG. With new export and regasification facilities under construction, the expansion is expected to continue. Meanwhile, floating liquefaction and regasification concepts have garnered attention as a way of reducing development time, increasing flexibility and lowering capital costs. The first floating storage and regasification units (FSRU) have been commissioned. Four floating liquefaction (FLNG) projects have achieved a final investment decision. Nevertheless, many gas fields are too small or remote to justify pipelines or LNG investment. In order to tap these resources, known as stranded gas, two alternative technologies are being considered: compressed natural gas (CNG) and gas-to-liquids (GTL).

The former is already in use onshore, but its application offshore is still at an early deployment phase. The latter is technically mature but still in its commercial infancy, with only four plants operating worldwide and subject to the development of economically viable small-scale modular systems.

Underground storage vessels include depleted oil and gas fields, aquifers and salt formations; the choice depends on local geology and how the storage facility will be used. Flexibility in storage capacity has become an important parameter because of growth in the use of natural gas in power generation and because of the limited flexibility of production from unconventional gas reservoirs. As a result, salt caverns have become popular; although they are relatively expensive, their flexibility is unrivalled.

natural gas needs to be pressurized, odorized and controlled to be safely delivered to end-customers. Except for a few large customers, most end- users are supplied through low-pressure networks.

Local distribution involves smaller delivery volumes than long-distance transmission, and delivery over shorter distances to many more locations. As a consequence, distribution lines make up the majority of installed pipelines. Ensuring safety is the main challenge faced by distribution-grid operators.

natural gas plays a major role in all end-use sectors, except for transport. Power generation is the main driver of natural gas consumption, representing 40% of gas demand globally, up from 35% in 1990.

For many years, the use of natural gas in commercial and residential buildings was the backbone of natural gas demand. The buildings segment still accounts for 22% of direct natural gas demand and this share is expected to remain stable in the next few decades. Thermal applications are dominant: space heating, water heating and cooking account for 54%, 22% and 11% of natural gas demand in the buildings sector, respectively. The use of natural gas in buildings varies significantly, depending on climate, urbanization patterns, or building design and insulation.

In industry, natural gas is used as a heat source, but also as a chemical feedstock. Direct natural gas consumption represents around 18% of final energy consumption in industry. The chemicals and petrochemicals sectors are by far the most important consumers (accounting for 44% of total industry demand for gas). This is because natural gas is largely used as a source of heat in refineries and as feedstock for producing ammonia and methanol. Other than for chemicals, the bulk of industrial gas demand comes from small-scale industrial consumers using natural gas in small-to medium-scale boilers to generate heat. Any switch from coal to gas in the industrial sector is likely to be relatively limited and subject to the development of carbon pricing.

1785 First commercial use of manufactured gas1 fuel for lighting.

1812 First gas company founded in London.

1885 Bunsen burner invented: ability to create a flame safe enough for cooking and heating applications 1936 First industrial gas turbine developed independently from jet engine.

1970s First combined-cycle power plants with a power output around 200 MW.

2000s Major development programs for compressed natural gas vehicles 1800 1850 1900 1950 2000 MANUFACTURED GAS CONVENTIONAL GAS & UNCONVENTIONAL GAS 1785 1821 First well specifically intended to obtain natural gas drilled in Fredonia, New York. 1872 First long-distance natural gas pipeline in the U. S. completed in Pennsylvania. 1915 1947 Hydraulic fracturing first used in U.S. 1951 First production of natural gas from coal beds. 2014 1995 Hydraulic fracturing and horizontal drilling led to successful exploitation of shale gas in Barnett, Texas. 1959 First use of depleted reservoirs for natural gas Methane Pioneer shipped the first cargo of LNG from storage. the U.S. to the U.K. 1992 World’s largest gas field, South Pars/North Field fully delineated. Note: 1Manufactured

Organic matter, such as the remains of recently living organisms ( e.g. plants, algae, animals, plankton…), is the origin of all the hydrocarbons generated in the earth. A very small portion of this organic matter is deposited in poorly oxygenated aqueous environments (seas, deltas, lakes…), where it is protected from the action of aerobic bacteria and is mixed with sediments to form the source rock.

Over time, the weight of gradually accumulating organic material and debris causes source rock to subside to great depths, where its organic content entrapped in a mud-like substance known as kerogen, is subject to increasing temperature and pressure.

These conditions lead to the thermal cracking of kerogen’s long molecular chains into smaller and lighter hydrocarbon molecules1. During the catagenis phase (50-150°C), kerogen bounds are gradually cracked into oil or into wet gas depending on the kerogen type. As temperatures rise in proportion with depth, hydrocarbon molecules become lighter as depth beneath the surface increases. During a last stage, known as metagenesis, additional heat and chemical changes eventually convert most of the remaining kerogen into methane and carbon residues. Hydrocarbon molecules are then expelled from the source rock during a “primary migration” phase, mainly as a consequence of high pressures. Hydrocarbons will then set off on a“secondary migration phase, making their way upward through rocky layers. If stopped by an impermeable layer of rock, also referred to as seal, hydrocarbons may accumulate in the pores and fissures of a reservoir rock. Otherwise, they may escape from the surface or solidify into bitumen.

Methane [CH4] is the chief constituent of most natural gas, but it may also contain lesser amounts of ethane [C2H6], propane [C3H8], butane [C4H10] and pentane [C5H12], commonly known as natural gas liquids (NGLs).

Impurities can also be present in large proportions, including carbon dioxide (CO2), helium, water, nitrogen and hydrogen sulfide (H2S), but also mercury.  All of these impurities, especially CO2 and H2S, must be removed from the natural gas stream before transport and commercialization. CO2 and H2S can corrode pipelines, are highly toxic and are significant sources of air pollution. Gases with high levels of H2S and CO2 are also called sour gases.

Components heavier than methane, known as natural gas liquids (NGLs), represent 10% of global liquid hydrocarbon supply

Hydrocarbon components of natural gas that are heavier than methane are called natural gas liquids (NGLs). They can be extracted in a processing plant2 and commercialized as liquid fuels. Natural gas that is rich in NGLs is usually called wet gas or rich gas, as opposed to dry gas or lean gas. Liquefied petroleum gas (LPG), to make a further distinction, is a subset of NGLs, comprising propane and butane. LPG can be liquefied through pressurization (i.e. without requiring cryogenic refrigeration), and used as a liquid fuel.

In 2012, supply of NGLs amounted to 9 million barrels a day, representing about 10% of world liquid hydrocarbon production. While total liquid supply has increased at a 1% compound average annual growth rate (CAGR) since 1980, NGLs production has more than doubled with a CAGR of 3.1%.

In some fields, contaminants can be found in very high concentrations. This increases investment needs and production costs to the extent that production may even be rendered uneconomic. Natural gas rich in hydrogen sulfide (H2S) or carbon dioxide (CO2) is called sour gas or acid gas. CO2 and H2S are both extremely corrosive and H2S is also toxic. When these gases are present, special equipment is needed (e.g. special alloys for tubing and piping) to ensure that the natural gas can be safely transported and processed, prior to being sold.

20-40% of global recoverable gas resources could be considered, to varying degrees, to be sour gas, especially in the Middle East and Central Asia, but also in North America, Australia and Russia. Even if sour gas fields have a long history of successful development in several places, lowering the costs of sour-gas operation is essential if its potential is to be fully tapped. This could be through innovation in gas-separation technologies used in processing plants or more advanced deployment of capture and re-injection, including enhanced oil recovery.

Natural gas’s volatility and low energy density make handling it difficult

VOLUMETRIC ENERGY DENSITY OF CHEMICAL FUELS1 ? Natural gas’s main drawback relative to other MJ/liter hydrocarbon fuels is its low volumetric energy density, i.e. energy stored per unit of volume. This becomes especially challenging when natural gas is used as a Diesel  transport fuel. In addition, its gaseous nature makes it volatile and harder to handle than solid fuels like coal or Gasoline liquid fuels such as crude oil.35 ? As a consequence, natural gas needs to be“packaged” in some way in order to increase its energy density and to allow for safe and economic transport and storage. Two main conditioning technologies are used: 1) compression, in which natural gas is pressurized, and 2

liquefaction, in which cryogenic refrigeration turns natural gas into a liquid. Compression is by far the most common handling technology, but liquefaction, which results in Liquefied natural gas 22 greater energy density, is also a mature technology and common in long-distance transport2. Finally, natural gas can Methanol also be converted into liquid fuels in a process known as gas-to-liquids (GTL)3.

Whatever the technology, gas conditioning incurs high handling costs and has limited flexibility. Unlike oil, for instance, which is fungible, natural gas relies on a heavy infrastructure pressurized or storage caverns or cryogenic carrier).

Without such infrastructure, natural gas would be flared or vented

Like CO2, methane is a potent greenhouse gas (GHG). However, it has a higher global warming potential (GWP) than CO2. According to the IPCC, methane GWP would be 28 to 84 times higher than CO2 GWP over 100-year and 20-year horizons, respectively.

Conventional reservoirs tend to require less technology to be developed and to yield higher recovery rates. However, reservoirs located in deep water or Arctic environments, and those containing a high level of sour gas may also be very challenging to develop.

Conventional gas refers to resources accumulated in a reservoir in which buoyant forces keep hydrocarbons in place below a sealing cap rock. Reservoir and fluid characteristics typically permit natural gas to flow readily into a wellbore. The term unconventional reservoirs, in which gas might throughout a reservoir at the basin scale, and in which buoyant forces are insufficient to expel gas from the reservoir, meaning that intervention is required. Conventional gas reservoirs can either be isolated (non-associated) or associated with oil. Associated gas can be in form of a gas cap (free gas) or it can exist in solution within the oil (solution gas). Natural gas was long considered an unwanted byproduct of oil and was only considered as a commercial prospect when deposits were located close to markets or gas infrastructure.

Coalbed methane is generated during the formation of coal and is contained to varying degrees within all coal microstructure. Because of coal’s porous nature and its many natural cracks and fissures, coal can store more gas than a conventional reservoir of similar volume. However, production from CBM wells can be difficult because of the low permeability of most coal seams. As a result, technologies such as directional drilling and hydraulic fracturing are used to open access to larger areas, enhancing well productivity. Finally, CBM production is often associated with extensive production of water. Water must be removed in order to reduce pressure within the reservoir, making lifting and surface separation more complex and costly. CBM production is advanced in the U.S., Canada and Australia.

Methane hydrates could considerably increase natural gas resources but are still at a very early development phase Four production methods are under investigation for methane-hydrate recovery: 1) depressurization, which has emerged as the preferred solution, involves lowering the water level in the well; 2) thermal stimulation, which involves warming the formation; 3) chemical inhibition, which exploits the ability of certain organic or ionic compounds to destabilize gas hydrates; and 4) CO2 injection.

The industry does not expect any large-scale commercial production to happen before 2030 because of the considerable technology and environmental barriers faced. Besides, the development of methane hydrates has been affected by the shale-gas revolution. The latter has resulted in new– and less concentrated– gas resources, and in lower gas prices in most regions.

Conventional reserves in Russia and the Middle East, and unconventionals in North America make the largest contributions to natural gas reserves

Natural gas resources are relatively concentrated geographically: 13% of discovered reservoirs account for 70% of global reserves

Giant gas fields– with recoverable totals that exceed 100 bcm– hold more than 70% of global reserves but account for just 13% of the total number of fields.

The number of fields discovered each year increased steadily between 1950 and 1982, and has remained high ever since. But growth in the size of discoveries slowed down after 1972 as the number of giant discoveries fell.

Resources in unconventional reservoirs are expected to account for an increasing share of natural gas production

According to natural gas continue to increase, albeit at a slower pace, reaching 4.6 tcm/y by 2035. Shale reservoirs would make the single-largest contribution accounting incremental 2035, unconventional gas production could account for 27% of the natural gas mix2. Nevertheless, forward- looking projections of this type are sensitive to numerous parameters, such as advances in technology, global or regional economic growth, policies and incentives, and the availability alternative should remember that, just 10 years ago, a supply shortage was widely predicted for North America.

In 2013, shale gas accounted for 39% of total natural gas output in the U. S., the leading producer, with 90% of global shale-gas supply U.S.

Between 2007 and 2012, natural gas production from shale in the United States more than quadrupled3.

Natural gas production profiles in conventional formations vary significantly, according to field size, location and management. Larger fields are generally characterized by longer production plateaus than smaller fields. Offshore reserves are recovered more quickly than onshore ones: offshore production increases more rapidly and settles at a higher plateau. One-third of reserves are generally produced during the plateau.

Due to the properties of the source rock, shale-gas wells usually exhibit early production peaks and then enter rapid decline – typically 50% over 3 years. In addition, shale-gas plays concentrations of recoverable generally have lower resources – typically around 0.04-0.6 bcm/km2, compared with an average of 2 bcm/km2 in the case of conventional resources. Consequently, shale-gas production requires more wells.

The ramp-up of CBM production is slower than the ramp-up of conventional and shale-gas production. This is because of the large quantity of water, naturally occurring or introduced during fracking, that must be extracted in order to reduce pressure within the formation sufficiently to allow gas to flow to the wellbore. Natural gas production then increases as the volume of water produced decreases.

Complex infrastructure is needed to get natural gas to end-users – processing plants, transport & distribution grids, and storage units

Processing is an essential step in turning raw natural gas into a commercial product and extracting natural gas liquids (NGLs)

Natural gas collected at the wellhead must usually be processed to meet the pipeline-quality standards defined by each system (energy content, water content…) and to ensure safe and clean operation, both of the grid and of end-appliances. The type of gas processing required depends on the composition of the raw gas and on the pipeline system’s quality specifications. Although it is less complex than crude-oil refining, natural-gas processing is a crucial stage in the natural gas value chain. In addition to its primary purpose, cleaning,

Gas-processing plants are located all over the world, since they are usually sited close to production centers. However, it is worth noting that, as of 2013, 50% of processing capacity was concentrated in North America, which accounts for only 24.9% of world production. Iran, Algeria and Indonesia have processing capacities that correspond to their respective shares of production.

As of 2013, there were 1,954 gas-processing plants operating in the world, with a global capacity of 7,657 mcm/d. In 2012, these plants operated at an average utilization rate of 57%, processing a throughput of natural gas of 4. 432 mcm/d.

Despite the emergence of significant global LNG flows, gas trade remains dominated by regional pipeline trade

MAJOR TRADE MOVEMENTS BY PIPELINE (2012) AND LNG

Pipelines are the backbone of gas transportation, with a global network of 1. 4 million kilometers

Globally, more than 89% of natural gas is transported along a 1.4 million km pipeline grid. One-third of this network are lines transporting large pressure, large-diameter (6’’-48’’) pipelines. The other two-thirds comprise thinner pipelines at production sites, called gathering lines, and the medium- and low-pressure distribution grids that supply end-customers. Pressure is required to maintain the gas flow. As a result, compression stations are located every 80-160 kilometers along the transport grid. Each station contains one or several compressor units (up to 16). These are classified by their horsepower (up to 50,000-80,000) and gas capacity (up to 90 Mcm/d). Compressors can use a motor (reciprocating) or a turbine (known as centrifugal). Gas-filtering, but also cooling and heating facilities are often included in the station to maintain gas temperature. Gas transport pipelines are usually made of carbon steel and protected against corrosion by external coating and cathodic protection systems.

North America, TransCanada Alaska will connect Alaska to Alberta and the U. S., while an 804 km pipeline is planned from Arizona to the northwest of Mexico.

Pipeline costs vary significantly according to capacity, length and their physical environment, but are dominated by the costs of labor and materials.

Before liquefaction, natural gas must be cleaned to remove contaminants, which might freeze during liquefaction or corrode pipelines. Heavier hydrocarbons are also extracted to meet gas specifications.

Vessel design is dictated largely by the high energy density and extremely low temperature of LNG. LNG carriers must be double-hulled, with water ballast. On-board storage tanks require special alloys to ensure effective insulation.

Several liquefaction projects are in development in the U.S., but most are awaiting final investment decisions. Sabine Pass is the only project under construction as of 2014.

Australia is the third largest LNG exporter (22.2 mtpa, or 10% of world exports) after Qatar (77.2 mtpa) and Malaysia (24.7 mtpa) but ahead of Indonesia (17 mtpa). However, Australia, where 53% (63.8 mtpa) of the liquefaction capacity under construction worldwide is located, is expected to take over Qatar as the largest LNG exporter by 2020.

Natural gas prices: for distances up to 9,000 km, LNG tends to require more energy than pipelines, making it more exposed to price increases (i.e. the break-even point between pipeline and LNG may occur over a longer distance than when a pipelines system is used).

Many gas fields are too small or too remote to justify investment in pipelines or LNG facilities. In some environments, the use of pipelines is simply not practical. A possible alternative is compressed natural gas, which is already being used for local gas distribution onshore, but whose application offshore, although conceptually CNG’s main benefit is that it requires relatively little infrastructure, so capital requirements are low : compression is a common feature of most gas-production units and less costly than liquefaction; offloading requires simple buoys. However, CNG has a lower energy density than LNG (typically around one-third, depending on the pressure). As a result, investments in CNG carriers are greater and operating costs are also higher (notably fuel costs).

Small-scale gas-to-liquid (GTL) conversion systems may provide an alternative means of transporting and monetizing stranded gas

Despite its discovery in the early 20th Century, and past use on a relatively large scale by Germany and South Africa, the gas-to-liquids (GTL) process is still in its commercial infancy. As of 2013, there were four commercial GTL plants operating worldwide. The largest, Shell’s Pearl GTL, started operation in 2010 in Qatar, with a capacity of 140,000 bbl/day.

Concerns have lead to project cancellations (Shell in Louisiana andTalisman’s exit from Montney in Canada). Pearl’s costs were estimated to have tripled compared with its initial budget, rising to $18-19 bn. Despite a favorable price spread between oil and gas, capital costs are still too high (e.g. $80,000 per bbl/d of capacity for Pearl) and energy efficiency too low (as a rule-of-thumb, only a tenth of the energy in natural gas used in the GTL process is converted into useable products) to justify GTL on large-scale.

Small-scale, modular GTL systems seem to be the key to GTL becoming more widespread. These would have the ability to monetize stranded gas and associated gas resources that are currently flared, notably those offshore. Small-scale GTL also obviates the construction of an on-site reforming unit, reducing capital costs1. As a general estimate, if 50% of the gas that is flared were to be used as GTL feedstock, it would produce around 7 mbbl/d of additional liquid fuels. R,D&D efforts (catalyst…) remain crucial in reducing costs and improving efficiency.

Aquifers are porous, permeable, underground rock formations that act as natural water reservoirs and can be used to store gas when overlaid by an +impermeable cap rock. However, aquifers require more cushion gas1 (50-80%) than depleted fields and more investment in injection infrastructure. They are +usually, therefore, utilized only when there are no depleted fields nearby. They usually have high delivery rates and are used for balancing seasonal variations (summer/winter) in supply and demand.

Salt formations, whether bedded salt or salt domes, can be used to store gas due tosalt’s natural insulation properties. They are usually more expensive + than the alternatives, since– unless abandoned mines are used– a cavern has to be created. However, they require a small proportion of cushion gas1 +

However, recently, natural gas storage needs have radically evolved, as natural gas trade has become more liquid and as natural gas’s role in power generation has grown:  Storage provides a means of hedging against natural gas price volatility, especially in the most liquid markets, North America and Western Europe; Storage requirements are also affected by natural gas’s increasing share of power generation. Indeed, many countries now use open-cycle gas turbines in peaker mode to balance supply from intermittent renewables. This variability from the procurement. transfers unpredictability and power sector into natural gas In both cases, the flexibility of storage capacity has become essential, generating new momentum behind salt caverns, which provide unrivalled flexibility, albeit at a high cost.

Natural gas needs to be depressurized, odorized and monitored to be safely delivered to end-customers through a dense network of small pipelines for a few customers, such as power stations or large industrial plants, which are connected directly to the high-pressure transmission system (up to 75 bar), most end-customers are supplied by the low-pressure gas network (up to 1 bar, and ~20 mbar at the meter)2. Unlike long-distance transportation, distribution is characterized by smaller volumes transported to many more locations, over shorter distances. As a consequence, distribution accounts for most of the pipelines installed

Historically, natural gas has played a crucial role in increasing oil- recovery rates

Oil’s natural flow results in low primary recovery factors, typically 5- 15%2. Various techniques are therefore used to improved recovery rates. These include a number of artificial-lift techniques. One of the most common, especially in mature offshore wells, involves injecting natural gas through the tubing-casing annulus in a producing oil well. Injected gas creates bubbles in the produced fluid, making the liquid less dense and allowing pressure in the formation to lift the column of fluid3.

New techniques have been developed to cope with more complex offshore environments (e.g. new valves or auto-gas lift to meet the safety and pressure requirements of deepwater oil fields). Natural gas can also be injected to maintain sufficient pressure in reservoirs. Also known as gas flooding, this involves “pushing” oil towards the wellbore. Natural gas injection, usually into the gas cap, is the preferred method of disposing of or storing associated gas when it has no economic value or to balance continuous supply rate with seasonal variations in demand. Gas can be injected as part of enhanced recovery. This differs from gas flooding because it changes the make-up of the reservoir. Various gases can be injected: natural gas, produced from the same or a neighboring field, exhaust gas from a nearby industrial plant/power plant, nitrogen, once separated, and carbon dioxide. The latter is the most popular and serves at the same time as a means of sequestering anthropogenic sources of a greenhouse gas.

Natural gas’s role in the global energy mix is growing

Natural gas demand is currently divided among three main generation; residential buildings; and industry. The power sector is fastest-growing driver demand (40%). Electricity is followed by industry (23%), where natural gas can be used as fuel or as a chemical feedstock, and by demand from commercial and residential buildings (22%). Transport is the only end-use sector in which natural gas does not yet play a central role.

Gas power-generation technologies are attractive because of their considerable flexibility and high degree of efficiency

There are two dominant gas power generation technologies: open-cycle gas turbine (OCGT) and combined cycle gas turbine (CCGT). Both are based on the same principle: compressed air is ignited by natural gas combustion. This spins a turbine, whose high-speed rotations drive an electric generator. However, unlike OCGT, CCGT makes use of waste heat from the gas turbine:

exhaust gas is captured to boil water into steam in order to feed an additional turbine. CCGT has contributed 73% of gas-turbine capacity additions since 1990.CCGT’s efficiency and relatively low capital costs– combined with its high degree of flexibility and economic competitiveness with coal, even when utilization rates are high– have strongly influenced growth in the use of natural gas in power generation. However, for peaking uses, which require a very high degree of flexibility, OCCT is still favored.

Natural gas power plants tend to be an important source of flexibility for power systems because of the flexibility of natural gas turbines. System operators use gas-fired power plants to match supply and demand by adjusting their output upwards or downwards1. As a consequence, natural gas power plants are typically operated as mid-merit plants (i.e. running ~50% of the time) or peaking plants (i.e. running less than 20% of the time), as opposed to baseload plants, such as nuclear or coal units, which are used virtually all year-long to leverage their relatively low operating costs and amortize their relatively high initial investment.

Overall, buildings represent 22% of the world’s direct natural gas demand. When natural gas used to generate electricity and commercial heat for buildings is added, the share rises to almost 29%. The direct use of natural gas in buildings is predominantly for thermal end-uses. Space and water heating represent 54% and 22% of natural gas use in buildings, respectively, and heat for cooking 11%. Within buildings, the commercial sector represents 30% of total gas consumption and the residential sector 70%.

The chemicals and petrochemicals sector is by far the most important consumer of natural gas in industry (44% of all industrial demand). In this industry, natural gas is not only used as a fuel, but also as a feedstock for producing ammonia, methanol and other chemicals. In other energy intensive industries2, natural gas continues to play a secondary role e.g. in the iron & steel sector, coal accounts for 74% of the energy mix, compared with 7% in the case of natural gas). Therefore, with the exception of the chemicals & petrochemicals industry, the bulk of industrial gas demand comes from a wide range of industrial consumers who use natural gas in small-to-medium-scale boilers to generate heat.

Natural gas is a crucial feedstock for the petrochemicals and fertilizer industries

Natural gas plays an important role as a feedstock for producing ammonia, methanol and other hydrocarbon-based products (e.g. olefins, such as ethylene and propylene, using natural gas liquids2). Ammonia is one of the most extensively produced chemicals in the world, helping to create over 500 million tons of nitrogen fertilizer per year. Similarly, methanol is a widespread chemical product, with around 100 million tons used every year as anti-freeze, solvent or fuel. In recent decades, natural gas has become the primary feedstock in ammonia and methanol production. Low natural gas prices and progress in plant design encouraged its use, leading to gains in energy efficiency. Steam methane reforming represents around 77% of hydrogen produced as a basis for ammonia; 75% of methanol production comes from natural gas. In both cases, the remainder is mainly made up of coal

CNG refueling stations require lower investment costs than LNG refueling stations and result in lower GHG emissions (because CNG processes are less energy intensive). It would also be easier to refit vehicles to run on CNG or as bi-fuel vehicles.

The liquefaction process also incurs an energy penalty and regular vehicle use is required to minimize fuel losses arising from boil-off.

Conversion is costly and incurs significant energy losses (especially for drop-in gasolines and diesels, which could be used without modification to the existing system).

natural-gas vehicles have a poorer range and their fuels require expensive conditioning. Finally, the impact on global warming of using natural gas for powering vehicles remains uncertain and highly system-specific. Indeed, well-to-wheel analysis depends heavily on whether or not there is methane leakage at any stage in the process (see slide 17).


Posted in Natural Gas | Comments Off on Natural Gas Facts and Statistics