Toasters are Toast

Preface. Thomas Thwaites’ book, “The Toaster Project” illustrates why it will be so hard, if not impossible, to bounce back from collapse in the future to anything like what we take for granted today.  Thwaites set about trying to make a simple toaster from scratch. How hard could that be? Well, toasters, it turns out, are not so simple. The most basic toaster Thwaites could find had 404 parts, consisting of steel, mica, plastic, copper, and nickel.

You’d think that plastic would be the easiest, but that is the most recent material in a toaster, since it is derived from petroleum, while humans have been smelting and forging copper and iron for thousands of years.

Alice Friedemann  www.energyskeptic.com  Author of Life After Fossil Fuels: A Reality Check on Alternative Energy; When Trucks Stop Running: Energy and the Future of Transportation”, Barriers to Making Algal Biofuels, & “Crunch! Whole Grain Artisan Chips and Crackers”.  Women in ecology  Podcasts: WGBH, Jore, Planet: Critical, Crazy Town, Collapse Chronicles, Derrick Jensen, Practical Prepping, Kunstler 253 &278, Peak Prosperity,  Index of best energyskeptic posts
***

Iron

What made industrialization possible was fossil fuels, coal to begin with, and later oil and natural gas.   In the future, there may well be lots of fossil fuels left, but most will be miles under the deep ocean, the Arctic, and other places hard to get at or to even now.

To find out how to make iron, Thwaites had to use one of the first metallurgy books ever written from the 16th century.

Modern books don’t tell you how to make iron at home, because you need a multimillion dollar factory.  Figuring out how to use coke (coal roasted to remove impurities), instead of charcoal (since nearly all the trees were gone), to make iron is what started the Industrial Revolution.

It took a long time to figure out how to make iron and steel because there are still several kinds of impurities remaining in the coke, and each impurity requires different processes to remove them.  For example, to remove the oxygen (which causes iron to rust), you need to tempt it away with carbon monoxide at 1200 degrees Celsius (2370 F) which involves a very tricky precise calibration of not too much or too little air and other calibrations.  Check out the contents of Metallurgy for the Non-Metallurgist, Metal Forming: Mechanics and Metallurgy, or Physical Metallurgy Principles in “Look Inside!” Table of contents or Surprise Me! for an inkling of how complex metallurgy is.

It’s not something you can do at home, as Thwaites discovered trying to make iron with coal rather than charcoal.  He resorted to using a microwave oven.

Plastic

Plastics are all derived from natural gas or oil, appliances typically use polypropylene.  They are much harder to make than iron.

Crude oil is composed of hundreds of different hydrocarbon molecules (carbon and hydrogen) ranging from just a few atoms to longer molecules with 30 atoms.  Oil refineries split these molecules into dozens of different products, including propylene, a carbon chain so small it’s a gas, that you need to turn into a solid.

Oil refineries cost billions of dollars, and check out the flow diagram of a typical refinery.  So you can’t refine raw oil at home to get the propylene out. Nor was Thwaite able to talk an oil company into doing this for him.

Even if you managed to do this, plastic is much harder than iron to make.  As Adrian Higson points out to Thwaite (page 115):

Metals are refined physically through heating and cooling.  “We’ve been making iron since the Iron age, but we’ve only been making plastic for about 100 years (most only for 60 years). Plastic needs physical , molecular, and chemical transformations with “strict control of temperature, pressure, mixtures of chemicals, and catalysts” which are difficult to make. Polyethylene is one of the simplest plastics to make, but requires a “minimum of 6 chemical transformations”.

Nor is it easy to melt down and reuse existing plastic, that’s why so little of it is recycled.  This is what Thwaite resorts to, and the result is a sorry mess.

In the end, the project was a failure.  Thwaite says “It worked for a few seconds, but then the element melted itself.  It was quite scary, since there was no insulation on the wires.”

Nor did he make anything from scratch.  Thwaites ended up having to use a microwave to make iron, and melted down existing plastic, after failing to make it from potatoes or raw oil.  He obtained copper by melting coins, and didn’t attempt to make nickel (doesn’t exist within Great Britain, the boundaries of his project).  Only his hunt for mica was successful.

Posted in Manufacturing & Industrial Heat, Peak Resources | Tagged , | 7 Comments

Even Pencils will be hard to make

Preface. Most of us are unaware of how complex our society is, how things are made, how food is grown, how stuff is delivered, and the people, energy, transportation, and kinds and sources of materials in every day objects.  This essay, written over 50 years ago, gives you an idea of how complex the antecedents of simple objects in your life are, how difficult many will be to make locally.   I’ve shrunk and paraphrased much of the essay.

This is also a good way to appreciate the concept of Energy Returned on Energy Invested.  Every single step of gathering the ingredients for a pencil and making it required energy.  Though this is mainly a concern for building devices that will supply energy, like solar panels or nuclear power plants.  If their construction uses more fossil energy than they can deliver, the energy return is negative.  But for pencils it doesn’t matter, unless the materials for it grow too expensive.

After this, I recommend reading my post on the Toaster Project, microchips, and motherboards.

Alice Friedemann www.energyskeptic.com  author of “Life After Fossil Fuels: A Reality Check on Alternative Energy”, April 2021, Springer, “When Trucks Stop Running: Energy and the Future of Transportation”, 2015, Springer, Barriers to Making Algal Biofuels, and “Crunch! Whole Grain Artisan Chips and Crackers”. Podcasts: Collapse Chronicles, Derrick Jensen, Practical Prepping, KunstlerCast 253, KunstlerCast278, Peak Prosperity , XX2 report

***

Read, Leonard E. 1958. I, Pencil My Family Tree.

“…not a single person on the face of this earth knows how to make me.”

This sounds fantastic, especially when there are about 1.5 billion of my kind made in the U.S.A. every year.  Pick me up and what do you see? Not much — some wood, lacquer, printed labeling, graphite lead, a bit of metal, and an eraser.

My family tree begins with … a cedar tree from Northern California or Oregon. Now contemplate the antecedents — all the people, numberless skills, and fabrication:

  • all the saws and trucks and rope and countless other gear to harvest and cart cedar logs to the railroad siding
  • the mining of ore, the making of steel and its refinement into saws, axes, motors
  • the growing of hemp and bringing it through all the stages to heavy and strong rope
  • the logging camps with their beds and mess halls
  • the cookery and the raising of all the foods to feed the men
  • the untold thousands of persons who had a hand in every cup of coffee the loggers drank!

The logs are shipped to a mill in San Leandro, California. Can you imagine how many people were needed to make flat cars and rails and railroad engines, to construct and install the communication systems required? These are just a few of the antecedents.

Consider the mill work in San Leandro. The cedar logs are cut into small, pencil-length slats less than a quarter inch thick. These are kiln dried and then tinted.  The slats are waxed and kiln dried again. How many skills went into the making of the tint and the kilns, into supplying the heat, the light and power, the belts, motors, and all the other things a mill requires? Plus the sweepers and the men who poured the concrete for the dam of a Pacific Gas & Electric Company hydroplant which supplies the mill’s power!

Don’t overlook the ancestors present and distant who have a hand in transporting sixty carloads of slats across the nation.

Once in the pencil factory—worth millions of dollars in machinery and building—each slat is given eight grooves by a complex machine, after which another machine lays leads in every other slat, applies glue, and places another slat on top—a lead sandwich, so to speak. Seven brothers and I are mechanically carved from this “wood-clinched” sandwich.

My “lead” itself—it contains no lead at all—is complex. The graphite is mined in Ceylon. Consider these miners and those who make their many tools and the makers of the paper sacks in which the graphite is shipped and those who make the string that ties the sacks and those who put them aboard ships and those who make the ships. Even the lighthouse keepers along the way assisted in my birth—and the harbor pilots.

The graphite is mixed with clay from Mississippi in which ammonium hydroxide is used in the refining process. Then wetting agents are added such as sulfonated tallow—animal fats chemically reacted with sulfuric acid. After passing through numerous machines, the mixture finally appears as endless extrusions—as from a sausage grinder-cut to size, dried, and baked for several hours at 1,850 degrees Fahrenheit. To increase their strength and smoothness the leads are then treated with a hot mixture which includes candelilla wax from Mexico, paraffin wax, and hydrogenated natural fats.

My cedar receives six coats of lacquer. Do you know all the ingredients of lacquer? Who would think that the growers of castor beans and the refiners of castor oil are a part of it? They are. Why, even the processes by which the lacquer is made a beautiful yellow involve the skills of more persons than one can enumerate!

Observe the labeling. That’s a film formed by applying heat to carbon black mixed with resins. How do you make resins and what is carbon black?

My bit of metal—the ferrule—is brass. Think of all the persons who mine zinc and copper and those who have the skills to make shiny sheet brass from these products of nature. Those black rings on my ferrule are black nickel. What is black nickel and how is it applied? The complete story of why the center of my ferrule has no black nickel on it would take pages to explain.

Then there’s my crowning glory, inelegantly referred to in the trade as “the plug,” the part man uses to erase the errors he makes with me. An ingredient called “factice” is what does the erasing. It is a rubber-like product made by reacting rape-seed oil from the Dutch East Indies with sulfur chloride. Rubber, contrary to the common notion, is only for binding purposes. Then, too, there are numerous vulcanizing and accelerating agents. The pumice comes from Italy; and the pigment which gives “the plug” its color is cadmium sulfide.

Does anyone wish to challenge my earlier assertion that no single person on the face of this earth knows how to make me?

Actually, millions of human beings have had a hand in my creation, no one of whom even knows more than a very few of the others. Now, you may say that I go too far in relating the picker of a coffee berry in far off Brazil and food growers elsewhere to my creation; that this is an extreme position. I shall stand by my claim. There isn’t a single person in all these millions, including the president of the pencil company, who contributes more than a tiny, infinitesimal bit of know-how. From the standpoint of know-how the only difference between the miner of graphite in Ceylon and the logger in Oregon is in the type of know-how. Neither the miner nor the logger can be dispensed with, any more than can the chemist at the factory or the worker in the oil field—paraffin being a by-product of petroleum.

I, Pencil, am a complex combination of miracles: a tree, zinc, copper, graphite, and so on.

Posted in EROEI Energy Returned on Energy Invested, Localization, Supply Chains | Tagged , , , , | 2 Comments

The Fragility of Microchips

Preface. This is an introduction to how microchips are made to give you an idea of how difficult and amazing they are.  This is a very high-level overview gathered mostly from the textbooks of Quirk (2001) and Van Zant (2004). Given the improvements since then, multiply whatever I say many fold as chips have only gotten more complex since them. 

Alice Friedemann  www.energyskeptic.com  Author of Life After Fossil Fuels: A Reality Check on Alternative Energy; When Trucks Stop Running: Energy and the Future of Transportation”, Barriers to Making Algal Biofuels, & “Crunch! Whole Grain Artisan Chips and Crackers”.  Women in ecology  Podcasts: WGBH, Planet: Critical, Crazy Town, Collapse Chronicles, Derrick Jensen, Practical Prepping, Kunstler 253 &278, Peak Prosperity,  Index of best energyskeptic posts

***

Microprocessors are essential, they’re in just about everything

Billions of chips are created every year for a myriad of applications: in autos, airplanes, ATMs, air conditioners, calculators, cameras, cell phones, clocks, DVDs, machine tools, medical equipment, microwave ovens, office and industrial equipment, routers, security systems, thermostats, TVs, VCRs, washing machines – nearly all electrical devices.

Microchip fabrication 

Creating a chip begins by cutting a thin 12 inch slice, called a wafer, from a 99.9999999% pure silicon crystal, one of the purest materials on earth.  Wafers require such a high degree of perfection that even a missing atom can cause unwanted current leakage and other problems in manufacturing later on. This is the platform that about 5000 computer chips will be built on. Each chip will contain millions of transistors, capacitors, diodes, and resistors built by punching and filling in holes in more layers than a Queen’s wedding cake.

Cleanliness

Particles 500 times smaller than a human hair can cause defects in microchips. The more particles that get on a wafer, the greater the chance there is of a killer defect. Some particles are worse than others — a single grain of salt could ruin all the chips on a wafer.  Sodium can travel through layers even faster than stray bits of metal.  Particles that outright kill a chip are caught during the testing phase at the factory.  Sometimes only 20% make to the end.  The traveling particles are insidious, and can cause a chip to malfunction, perform poorly, or die later on (hopefully before your warranty expires).  Consumer reports recommends not even trying to repair a personal computer after four years, and in the two to four year range it’s a tossup whether to repair or buy a new one.

Typical city air has 5 million particles per cubic foot.  There are processes that require a maximum of 1 particle per square cubic foot.

People are among the worst offenders, as far as particle generation goes.  If you walk at a good clip, you emit 7.5 million particles per minute.  Even sitting still, you are still emitting particles.  A smoker is a particle-emitting dragon long after the cigarette, and a sneezing worker is even worse, a veritable Krakatoa.

City water is not pure enough to be used — it’s full of bacteria, minerals, particulates, and other junk. To make city water clean enough requires many filters, UV-light, and other water treatments.  Intel has two plants in drought-stricken Arizona that use 11 million gallons of water a day and even more than that with a new expansion underway. This requires a huge investment in water processing and delivery systems.

Microchip fabrication is primarily a chemical process, requiring ultra-clean 99.9999% chemicals and 99.9999999% gases. About one in five steps use water or chemicals to clean the wafers or prepare their surface for the next layer.

Firemen practically need a chemical engineering degree to inspect and fight fires in a chip fabrication plant. During a fire, they risk being exposed to volatile, flammable, or combustible solvents, and chemicals like arsine, used in chemical warfare.

The chips also require humidity to be just right.  If the humidity is too high, the wafers accumulate moisture, and the layers won’t stick.  Too dry and static electricity will suck particles out of the air and practically glue them to the surface, they’re so hard to remove.

So it shouldn’t surprise you that it costs over billions of dollars to build a clean room. The inside is composed of non-shedding materials, especially stainless steel. Floors have sticky mats to pull dirt off of operators’ shoes.  Pens, notebooks, tools, and mops – everything is built of material that sheds as few particles as possible, but even so, equipment particles cause a third of the contamination.

The slightest vibration can make the expensive machines malfunction, so the plant is built with huge concrete slabs on top of special shock absorbers.  To make the foundation requires 890,000 cubic yards of dirt to be removed and dumped, then filled in with 445,000 cubic yards of concrete with 100,000 tons of embedded steel — more than required by the world’s tallest building, the burj Khalifa in Dubai.

It takes over 100 trucks to bring in the pieces of the huge cranes required for the project, which can life 55-ton chillers.

In order to move large amounts of liquids and gases, the plant needs to be very tall. Intel’s factories top level is 70 feet  high to make room for giant fans to circulate air in the clean room below. Beneath the clean room there are thousands of transformers, pumps, cabinets, utility pipes, and chillers.

How chips are made

Wafers move from workstation to workstation and have different operations performed on them at each one.  Wafer fabrication for a chip might involve 450 processes with operations that overall take several thousand individual steps. The machines that make this all happen include high-temperature diffusion furnaces, wet cleaning stations, dry plasma etchers, ion implanters, rapid thermal processors, vacuum pumps, fast flow controllers, residual gas analyzers, plasma glow dischargers, vertical furnaces, optical pyrometers, and more.

If you were shrunk to chip size and tied to a wafer, you’d go through the car wash from hell.  You’ll be moved along by robotic wafer handlers from one machine to the next, where you’d be layered with different materials, centrifuged, electro-polished, dyed, scraped, heated to 1,800 degrees Fahrenheit, ultrasonically agitated, sputtered, doped, hard baked, dipped in toxic chemical baths, irradiated, blasted with ultrasonic energy, spray-cleaned, dry-cleaned, scrubbed, micro-waved, x-rayed, shot with metal, etched, and probed.

At various points, the chip “Survivor” TV show comes on. Chips are examined at an atomic level for defects, and their electrical functioning tested. They’re usually thrown out if anything is wrong, since most mistakes can’t be fixed.

There are many problems that can cause a chip to fail besides contamination. The wafer must be perfectly flat in structure and while it goes through the workstations.  If the wafer were 10,000 feet high, you’d see bumps or holes no higher than 2 inches – more than that and the layering is thrown off.   If the wrong step was performed after 3,841 correctly performed steps, the chip was under or overheated, the layer didn’t fully stick, was improperly aligned before the next layer was added, or a chemical misapplied, the chip is thrown out.  It’s amazing any chips make it out the door.

After your makeover, you’d emerge in a designer outfit composed of up to 25 layers embedded with millions of transistors, diodes, and resistors.  You’ll find yourself “best in show” at tattoo competitions and irresistible to Terminator fans.

Discussion

Chips are the pinnacle of human achievement, the most complex objects on earth, requiring fabrication plants costing ten billion dollars or more. They require chemicals, water, and air that are up to 99.99999999% pure.  It takes thousands of steps and up to four months to process a wafer, all of them lost in an electricity outage.

Their precision is phenomenal. Before fossil fuels objects could be crafted to within a tenth of an inch. Today chips are created at an atomic level of precision.

They are also subject to a single point of failure. More than 90% of the world’s manufacturing capacity for the most advanced chips is in Taiwan, so any time Taiwan has a drought, earthquake, invaded by China, or can’t get the components needed for chips, the whole world is affected. And some of the machines that make chips are from just one factory. In Germany a fire impacted the only manufacturer making extreme ultraviolet lithography machines used to etch circuits onto silicon wafers for Apple, IBM, and Samsung and other companies (Koc 2022).

Microchips are constructed out of finite critical, precious, platinum group elements, and rare earth elements — 90% of them produced in China.  And all of them mined with declining fossil fuels.

Chips have gotten so complex that their miniaturization has been causing hardware problems for over a decade. With switches just a few atoms wide, hardware failures that aren’t easy to identify are occurring more often. I don’t understand why chips work at all after reading this metaphor: Imagine a computer chip with 1,000 processors and 28 billion transistors is blown up to the scale of a building covering the United States. Finding the failure would be like finding the leaky faucet in just one of the apartments which only happens when the bedroom light is on and front door open.  

There are trillions of tiny switches with billions of transistors in a microprocessor, so even a tiny imperfection can disrupt the billions of calculations taking place every second. About 4% of Google’s millions of computers crashed unexpectedly from errors that couldn’t be detected. A 2020 report by chip maker Advanced Micro Devices discovered the most advanced computer memory chips were 5.5 times less reliable than the previous generation. Other researchers say the switches are wearing out sooner and shortening the lifespan of processors. 

Even really simple objects like pencils and toasters are more complex than you may know. 

Microchips are incredibly important to civilization — like energy, there isn’t a single business endeavor, infrastructure, or electronic device that isn’t dependent on them. 

New cars can have more than 100 semiconductors in their touch screens, computerized engine controls and transmissions, built-in cellular and Wi-Fi connections, collision avoidance systems, cameras and other sensors (Ewing and Clark 2021).

But because of their complexity, precision, dependency on rare minerals, supply chains, single points of failure, natural disasters, and extremely pure materials, they they will be one of the first industries to fail when the electric grid becomes unreliable and oil shortages become common, forcing society to simplify and localize, cascade to the myriad products that need them and making them obsolete as well.

Nearly all knowledge is being stored in electronically on media and devices that will be lost after energy decline, lost to the future generations forever, since fossil fuels and the mostly fossil-fueled electric grid make them possible. Books and microfiche have a finite lifespan as well, about 500 years if stored in optimal environments. I hope there are material scientists, librarians, and others working on more permanent media.  And you can help as well by considering what knowledge you would like preserve, and how we could do so in “Peak Oil and the Preservation of Knowledge“.

The fragility of chips in the news:

Ting-Fang C et al (2021) Taiwan hit by triple blow of drought, blackouts and COVID surge

Zhong R et al (2021) Drought in Taiwan Pits Chip Makers Against Farmers. The island is going to great lengths to keep water flowing to its all-important semiconductor industry, including shutting off irrigation to legions of rice growers. New York Times:  The drought is the worst in over half a century. Chip makers use lots of water to clean their factories and wafers, the thin slices of silicon that form the basis of the chips. Much of the water used by residents is deposited by the summer typhoons. But the storms also send soil cascading from Taiwan’s mountainous terrain into its reservoirs. This has gradually reduced the amount of water that reservoirs can hold.


References Much of above came from the textbooks written by Quirk & Van Zant

Clark D (2022) The huge endeavor to produce a tiny microchip. New York Times.

Ewing J, Clark D (2021) Lack of Tiny Parts Disrupts Auto Factories Worldwide. New York Times.

Koc C et al (2022) ASML keeps part of Berlin manufacturing site shut after fire. Bloomberg.

Markoff J (2022) Tiny Chips, Big Headaches. New York Times.

Quirk M, J. Serda J (2001) Semiconductor manufacturing technology. Prentice Hall.

Van Zant, P (2004) Microchip Fabrication, fifth edition. McGraw-Hill.


Posted in 2) Collapse, An Index of Best Energyskeptic Posts, Infrastructure & Fast Crash, Interdependencies, Localization, Manufacturing & Industrial Heat, Microchips and computers, Supply Chains | Tagged , , , , , | 8 Comments

Autos need finite rare earth, critical, & precious metals

This image has an empty alt attribute; its file name is rare-earth-metals-in-cars-2011.jpg

An electric car uses five times as many minerals as a conventional car (IEA 2020):

This image has an empty alt attribute; its file name is IEA-2020-EV-5x-more-minerals-conventional-car.jpg

IEA, Minerals used in selected power generation technologies, IEA, Paris https://www.iea.org/data-and-statistics/charts/minerals-used-in-selected-power-generation-technologies

There are 17 rare earth elements (REE) that China controls up to 97% of (Klare 2012, Shumsky 2011). These are essential for transitioning to so-called green energy — not just cars but solar panels, windmills, solar photovoltaic, computers, electronics, the smart grid and more.

While we can import oil from dozens of nations, REE make us dependent on China, and China is also constructing mines all over the world — it’s as if Saudi Arabia bought up all the remaining oil fields.

Mining is the second most toxic, environmentally damaging industry on earth.  So whatever the cost may be, no matter how high, let the Chinese destroy their land.  It’s a cheaper price to pay rather than destroy our own nation’s precious topsoil, which in the long run is the most valuable possession we have.

Already 20% of China’s arable land is polluted with toxic heavy metals from mining and industry.  Plus since conventional oil peaked in 2018, why would we bother to do this, since all of these contraptions are utterly dependent on oil, coal, and gasoline to be constructed for every step of their life cycle?  By the time even a small fraction of our vehicle fleet could be electrified, since it lasts ten to forty years (diesel trucks), and new vehicles are unaffordable for 90% of Americans, the oil age will long be gone and we will have wasted precious time and energy on mining when we could have been insulating homes, conserving energy, and converting industrial agriculture to organic..

 In 2011, nine of the REE were used in cars.  Some EV car motors use REE elements neodymium, terbium, or dysprosium in their magnet motor. Each electric Prius motor requires 1 kilogram (2.2 lb) of neodymium, and each battery uses 10 to 15 kg (22-33 lb) of lanthanum (Gorman 2009). Other EVs use induction motors with copper coils.

Cars using internal combustion engines also use precious and rare earth metals in their catalytic converter: palladium, rhodium, cerium, and/or platinum and the gasoline they burn oil was refined using rare earths, such as lanthanum and cerium, and critical elements like cobalt.

In addition, these applications use rare earth elements, i.e. metal alloys or production process, so cars may also have these as well: Aluminum and steel, ceramics, computer chips, electronics, LCD screen, light-emitting diodes.

If an electric car uses electricity & electric grid or GPS, then these REE and critical elements were indirectly used: Wind turbines (up to 150 kg neodymium & praseodymium per MW), Solar panels (indium, gallium), Photovoltaic cells (Germanium, silicon metal), Steel production (fluorspar, vanadium, Ytterbium), Nuclear power (Europium, Gadolinium, Cerium, Yttrium, Samarium, Erbium, Beryllium, Niodymium), Satellites (Niobium), Semi-conductors (gallium, Holmium), Semi-conductors (gallium, Holmium), Fiber optics (Germanium, Erbium Europium, Terbium, Yttrium), Electronics and electricity (Tungsten) and more.

Already, and increasingly, China controls REE from mining to final production of high-tech goods, and is likely to export REE less and less as they use them for their own high-value products.  Until some point of oil decline that is…

And there simply aren’t enough minerals on earth:

2023 What is the Cost of Electric Vehicle Batteries?

Alice Friedemann  www.energyskeptic.com  Author of Life After Fossil Fuels: A Reality Check on Alternative Energy; When Trucks Stop Running: Energy and the Future of Transportation”, Barriers to Making Algal Biofuels, & “Crunch! Whole Grain Artisan Chips and Crackers”.  Women in ecology  Podcasts: WGBH, Financial Sense, Jore, Planet: Critical, Crazy Town, Collapse Chronicles, Derrick Jensen, Practical Prepping, Kunstler 253 &278, Peak Prosperity,  Index of best energyskeptic posts

***

References

Gorman S. 2009. As hybrid cars gobble rare metals, shortage looms. Reuters.

IEA. 2020. Clean energy progress after the Covid-19 crisis will need reliable supplies of critical minerals. International Energy Agency.

Klare, M. 2012. The Race for what’s left. Picador

Shumsky, T. 2011. Testing Their Metals. Companies are searching for ways to reduce their need for increasingly scarce minerals. Wall Street Journal.

Posted in Automobiles, Peak Rare Earth Elements | Tagged , , , , , , , , , | 1 Comment

How are microchips made?

Preface. Computer chip fabrication plants need to run continuously for weeks to accomplish the thousands of steps needed to make microchips. A half-hour power outage at Samsung’s Pyeongtaek chip plant caused losses of over $43 million dollars (Reuters 2019).

Chip production requires massive amounts of water, but reservoirs in Taiwan are critically low and authorities have already cut supplies to agriculture to support industrial and residential use. Taiwan’s tech manufacturers fear their output is under threat from the island’s worst drought in decades, risking more turmoil for global supply chains already strained by shortages of semiconductors and other key components (Ting-Fang and Li 2021).

An electric grid depending on intermittent power like wind and solar will be up and down too much to make chips, which takes hundreds of steps over several days. If a grid can come up and down that is — blackstarting is not easy and outages can damage transformers.

As oil declines, at some point the energy to mine the materials and to make the precision machines that make the chips, chemicals, etching and other machines will end. But until then, appreciate what you have a lot more!  

Alex commented below about a post at here.  Felix Moreno predicts that because oil peaked in 2019. peak memory and peak data will arrive in 2021, or optimistically as late as 2024.  If true there’ll be problems storing data and at some point society will lose the ability to hold onto archived files,  starting with individuals but that will affect governments and companies.  And much more…

Alice Friedemann   www.energyskeptic.com  author of “When Trucks Stop Running: Energy and the Future of Transportation”, 2015, Springer, Barriers to Making Algal Biofuels, and “Crunch! Whole Grain Artisan Chips and Crackers”. Podcasts: Collapse Chronicles, Derrick Jensen, Practical Prepping, KunstlerCast 253, KunstlerCast278, Peak Prosperity , XX2 report

***

The crowning achievement of our civilization is the ability to make microchips.  It is by far the most complex object ever made by mankind.  Probably second in complexity to the microchip is the $10 billion dollar clean room they’re made within.  And third, the motherboard inside computers.  Everything else pales in comparison.  Nearly any electronic device you can think of depends on a microchip to function. Even toasters.  Somewhere along the line, even complex objects that don’t have one, like batteries, were made with equipment that used chips.

Enormously expensive

Moore’s Law says that over the history of computing hardware, the number of transistors in a dense integrated circuit doubles approximately every two years.  Some say that Moore’s 2nd Law is the escalating cost of a semiconductor fab plant, which doubles every 3 years. For example,  Intel’s Fab 32 cost an estimated $3 billion in 2007, revised to $3.5 billion in 2011. A 2009-2010 upgrade to an Intel fab, Fab 11X, cost $2.5 billion (on top of a 2007 $2 billion upgrade). The first stage of GlobalFoundriesNew York 1.3 million square foot fab will cost >$4.6 billion dollarsTSMC’s Fab 15 in Taiwan is estimated at >$9.3 billion, and they are preparing to start a fab in 2015 projected at >$26 billion

Only 5 companies can afford to make the best microprocessors: a supply chain threat

The costs and risks involved in building new fabs have already driven many makers of logic chips (processor or controller chips) towards a “fabless” chip model, where they outsource much of their production to chip “foundries” in the Far East (Nuttall).

High capital costs require fabs to keep their production lines running at full capacity to pay back the money sunk into them. “The most expensive thing on the planet is a half-empty fab,” says Brian Krzanich, general manager of Intel’s manufacturing and supply chain. Consequently, only the highest-volume processor manufacturers–such as Samsung and Intel are still sole owners and operators of state-of-the-art plants. As the elements on a chip become smaller, designing processors is getting tougher costing a lot more — R&D costs are rapidly increasing. In 2009, around $30 billion, or 17 percent of revenue, went to R&D across the industry–a 40 percent increase over 1999 (Mims).

Back when 130 nm chips were made, there were 20 companies, but now there are only 5 companies making the cutting edge 20/22 nm.  Below you can see the declining number of companies as the size got smaller and cost significantly more to make (Benini):

  • 20/22 nm: Globalfoundries, Intel, Samsung, ST Microelectronics, TSMC
  • 28/32 nm: 20/22 and Panasonic, UMC
  • 40/45 nm: 20/22, 28/32, and Fujitsu, IBM, Renesas (NEC), SMIC, Toshiba
  • 55/65 nm: 20/22, 28/32, 40/45 and Freescale, Infineon, Sony, Texas Instruments
  • 90 nm: 20/22, 28/32, 40/45, 55/65 and Dongbu Hitek, Grace Semiconductor, Seiko Epson
  • 130 nm: 20/22, 28/32, 40/45, 55/65, 90 nm and Altis Semiconductor

Only 3 companies still make internal hard disk drives

Seagate Technology, Toshiba, and Western Digital.  Once there were 200 companies.

One company, ASML, makes most of the lithography equipment for the semiconductor industry 

ASML is a lithography equipment manufacturer for the semiconductor industry, without which chip manufacturers cannot make computer chips for the computer and telecom industries.  ASML is nearly a monopoly company in the semiconductor lithography market with 74% of the market share. Traditional lithography has reached the limits and smaller chips can only be made using extreme ultraviolet lithography [EUV]. ASML enjoys a monopolistic position in EUV as it is the only company that is developing EUV equipment to produce these smaller computer chips. The capital required is so huge that ASML’s main customers such as Intel (INTC) are participating in a customer co-investment program (SeekingAlpha).

Benini says that Moore’s Law is about to hit a brick wall because of:

  1. Market volume wall: only the largest volume products will be manufactured with the most advanced technology (above)
  2. Thermal wall: transistor count still increases exponentially but we can no longer power the entire chip (voltages, cooling do not scale)
  3. Memory wall: larger data sets and limited bandwidth at high power cost for accessing external memory

Financial fragility

In a (civil) war, fabrication plants are a likely target.  Given how expensive they are, could a company survive the destruction of one or two of their plants given that their revenues now are often less than the cost of building a new fab plant (i.e. TSMC $14 billion, Globalfoundry $3.5 billion)?

Overview of how Chips are made

The main steps are oxidation layering, photoresist coating, patterning, etching, layering, doping (diffusion and ion implantation), depositing interconnection metals, testing, and packaging.  Each step can have dozens to hundreds of steps, with every process requiring astonishingly pure air, water, and chemicals.  Even the tiniest particle can contaminate the wafer and the microchip will have to be thrown out.

The fabrication building semiconductors are made in is also amazing. It’s made of materials that shed as few particles as possible, and the flooring and machinery must be built to prevent even the slightest vibrations from a truck going by or the chips will be damaged. Temperatures and humidity must stay within very narrow limits.

There are hundreds of thousands of kinds of equipment, chemicals, metals, minerals, and complex heating, cooling, building systems.  All of them are potential victims of supply chain failures.

As the world becomes less complex on the down-slope of the fossil fuel energy curve, it will get harder to keep the air, water, chemicals, and silicone as pure as they are now.  The more impurities or particles there are, the more chips will fail at the end-of-the-line. I personally experienced these frustrations when I worked at a neuroanatomy lab in Puerto Rico that moved from Urbana, Illinois. Suddenly we couldn’t get histology to work. The water and air weren’t pure enough, and this was worsened by not being able to come and go all hours of the day and night since the area was so unsafe.

At this point there are enough facilities and suppliers in about 9 countries that can back each other up after earthquakes (Taiwan & Japan), tsunamis (Japan), floods (Thailand), and other natural disasters, lessening supply chain worries.

But this is changing. According to Quartz, only four companies, Intel, Samsung, Taiwan Semiconductor Manufacturing (TSMC), and GlobalFoundries, are able to make advanced microchips.   In the relentless pursuit of Moore’s law, only a few companies remain with the money and knowledge to stay up-to-date.  Smaller suppliers of the big 4 that couldn’t afford to do the research to reach the next level of complexity in EUV lithography, 3D-IC chip packages and 450mm wafers are going out of business as well.

The biggest threat to chip production in the future are world-wide financial crashes, electric grid outages, and oil shortages resulting in disruption of supply chains, which will eventually affect facilities in more and more of the countries that are still making chips.

Another world-wide threat to the production of microprocessors is (nuclear) war, and cyber war and cyber attacks. While looking for a list of devices with chips, I came across an article about how Russians detected spy chips hidden inside electric irons and electric kettles that could put malware and viruses on computers within 600 feet.

Everything depends on semiconductors.  Financial and business transactions, logistics, shopping, corporations and small businesses, shipping, trucks, trains, autos, and so on. No microchips, no Civilization As We Know It.

As you can tell from my booklist, for me the greatest tragedy will be the loss of most of the knowledge gained during this short Age of Enlightenment, and then it’s back to superstition and fear of the Unknown.  More and more of what we know is only being stored electronically.  Librarians have written me to say their university or library is trying to put everything online.  Whatever is electronic will all be lost when we’re no longer able to make semiconductors.  We’ll also lose what’s on paper or microfilm since those don’t last more than a few centuries. I discuss this at greater length in Peak Resources and the Preservation of Knowledge.  Carl Sagan best expresses the sadness I feel in “The Demon-Haunted World: Science as a Candle in the Dark” and anthropological works like Chagnon’s “Noble Savages”.

The physics and calculus

You really need to see the diagrams, calculus, problems, and discussions of the physics involved to truly appreciate the complexity.  The list of processes below doesn’t begin to capture how amazing, brilliant, and unappreciated this enterprise is! Try scrolling a bit through one or more of these textbooks to get an inkling of what I mean:

Handbook of Semiconductor Manufacturing Technology, Second Edition

Advanced Processes for 193-nm Immersion Lithography

Handbook for Cleaning for Semiconductor Manufacturing

Fundamentals of Semiconductor Manufacturing and Process Control

Semiconductor Manufacturing Technology

Videos:  From sand to chip – How a CPU is made

A Detailed Look at the process of making Microchips from an 800 page textbook

Hwaiyu Gent. Semiconductor Manufacturing Handbook. Wafer Processing Technologies. Nanotechnology and MEMs. Fab yield, operations, and facilities. 2005.

Here are just a few devices that depend on microchips: medical equipment of all kinds, manufacturing equipment, Vehicles, Cameras & Video Equipment, Cellular Phones, Copy Machines, Printers, Hearing Aids, Sewing Machines, stereos, radios, televisions, VCRs, air conditioner, thermostat, microwave, washing machine, security system,  routers, ATMs, clock radios, coffee makers, ovens, etc.

Now and then I note the chemicals or minerals used in the process to give you an idea of the complexity.

A Brief description of some of Intel’s Fab facilities (Andrews)

  • 400,000 square feet of cleanrooms a quarter-mile on a side.
  • 40 miles of pipes for ultrapure water
  • 3 miles of internal monorail transportation
  • clean rooms  constructed with custom pre-cleaned construction materials.
  • Cement consumption is so high that Intel builds cement plants on their construction site
  • Chip fab energy consumption is 55-65 megawatts in one case. I
  • The largest land-based crane in the world was used to pick up and place massive roof trusses that weigh approximately 300 tons each.
  • The crane is so large it had to be delivered on trucks to the site in pieces by 250 trucks
  • 24,000 tons of steel rebar
  • 21,000 tons of structural steel. And to make room for the fab,
  • 875,000 cubic yards of dirt had excavated to make room for the fab plant
  • 10.5 million man hours will be required to complete the project.
  • Basic equipment can cost over $40,000,000 for a lithography machine, and over $50,000,000 for steppers
  • Software.  In 1995 a chip that went into a stand-alone product and required 100,000 lines of code, in 2002: a typical chip for a networked programmable product required a million lines of code (Fiddler)

How Silicon Wafers are made

Silicon wafers are the platform for microprocessors used in transistors, power and RF devices, dynamic random access memories (dram), and microprocessors. There are many ways to make them.  The more complex microprocessors require much more processing and materials often layering is done with diamonds, Si-Ge, and other materials, like a complex submarine sandwich that might include gallium arsenide, indium phosphide and antimonide, Si-Ge.

Arc furnace:  reduce quartz in quartzite by carbon into metallurgical grade silicon purified with halogenation and fractional distillation processes. HCl SiHCl SiCl4 H2 AlCl3 BCl3 FeCl3

Reactor: Decompose Trichloro silane into silicon and HCL. molybdenum

Quartz crucible. Within a chamber having a controlled atmosphere to grow the silicon crystals using very careful temperature control

Annealing. Wafers placed in an atmosphere of argon or hydrogen to remove oxygen, etc.

Slice:   multiwire saws slice and then grinders, lapping, and polishing machines produce wafers

Interconnects/wiring systems     

These provide power, grounding for various systems on the chip.  Copper, TaN, TiN, TiSiN, TiW

Make interconnect (with copper): A mold is coated with liner and seed layers, then copper is electrochemically poured in, with excess removed in a polishing step, and finally the surface is capped with a dielectric material to protect the copper often with a plasma-enhanced chemical vapor deposition.

Apply Silicide:  Because as devices shrink to the submicron level, circuit performance has encountered problems that can slow it down, and this is solved by applying silicides, which ideally have low resistivity, easily form thin films, withstand chemicals and high temperatures, adhere well to other layers, is smooth, and much more. titanium, cobalt, nickel, platinum, tungsten, molybdenum, tantalum and other metals.  There are many possible compositions of silicides, each with their strengths and weaknesses. TiSi2  CoSi2  NiSi  Pd2Si PtSi Wsi2 MoSi2

Deposit a film of metal on a silicon substrate and bind by annealing.

  1. sputter clean silicon wafer with Ar ions
  2. the metal is sputter deposited
  3. anneal in a 100% N2 ambient
  4. wet etch
  5. Another annealing cycle from 700 to 850 degrees C (depending on metal).  Now they’re ready for contact dielectric deposition and 1st level metal-interconnect processing

Plasma process control

An intricate and central feature of making semiconductor devices. Plasma chambers etch or deposit thin films of material. Etching needs a high-density plasma that generates ions which remove atoms of material.  Deposition is similar except coating is the objective.

Optical Emmission Spectroscopy(OES): uses an optical sensor(CCD image sensor and optical filter)  to detect the oxide-etch endpoint and measure the spectral emission from the plasma

Dry etch process: 2 types: chemical and physical, which combine to form 4 plasma processes: sputtering or physical, chemical, ion-energy-driven, and ion-enhanced-inhibitor etching. Chemical etch is done in high-pressure conditions.

Vacuum technology: Essential in many processes that need a controlled environment to deposit thin films so that the atmospheric gas molecules don’t interfere.

Vacuum technology Measurement Equipment required:  Force Displacement Gauges (liquid level barometer, U-Tube manometer, McLeod Gauge, Bourdon-tube gauge, diaphragm gauge), Capacitance Manometers, Thermal Transfer Gauges (thermocouple gauge Pirani gauge, convection-enhanced Pirani gauge), Ionization Gauges (hot cathode ionization, cold cathode ionization, Partial Pressure analyzers, Residual gas analyzers.  Platinum

Vacuum creating equipment required: Primary vacuum pumps (oil sealed rotary vane mechanical, dry (diaphragm, scroll, screw, sorption pumps). Secondary vacuum pumps (momentum transfer, Oi0-pVapor diffusion, Turbomolecular, Gas Capture, Cryogenic Vacuum, Sputter Ion)       liquid nitrogen, titanium, helium, neon, argon, krypton, xenon, radon

Vacuum creating components:  Flanges with demountable seals to connect to vacuum vessel, valves to control the flow of gas in and out, feed-throughs allow for mechanical motion, radiation, or fluids in and out of vacuum vessels to manipulate objects inside the vacuum

Vacuum Leak Detectors: Untrasonic leak detection, Helium Mass Spectrometer leak Detector (HMSLD)

Photomasks

The intermediate steps between design and wafer, the stencils used to print images onto the semiconductor material.

Data Prep: Design data is conditioned to generate instructions for the pattern generator to use to print the mask features, then converted to a file format acceptable to the pattern generation tool. Enormous computer resources are needed for this complex step.  As chips shrink, exponentially larger pattern files are required to cope.  The generated files are so large that transferring them from the design center to the photomask vendor taxes networks.

Pattern Generation: The design data are printed on resist-coated photoblank with electron beam (ebeam) systems in a high vacuum that take 10 to 18 hours, or with laser-beamed systems using deep ultraviolet lasers in 5 to 9 hours.  Atlas laser systems split the laser into 32 separate beams that are raster scanned across the mask with a 24-facet rotating cylindrical mirror.

Postexposure Bake: After patterning, this step removes standing waves formed from reflections of the substrate surface since these can degrade the resist image leading to poor uniformity

Develop process: The exposed resist is removed by solvents, and surfactants improve the wetting of the resist, then developers are added with puddle processes left on top for a while and then rinsed off, or sprayed on. tetramethylammonium hydroxide

Etch process:  After the exposed resist is removed, the underlying chrome is etched with wet processes using powerful acids or dry etch methods that use gases such as chlorine in a plasma induced by radio frequency energy

Resist removal and cleaning:            After the pattern is etched into the chrome of the photomask, unexposed resist is removed with strong acids

Inspections: Quality assurance to make sure mask features were printed at the proper size, defect inspections

Final Cleaning and pellicle mounting: Strong acids to clean, then a pellicle (rectangular anodized metal frame with optically transparent film on it)  over the printable field to protect it from contamination at the wafer fabrication plant.

Final shipment:  The photomask is read to be shipped to the wafer lab

Some statistics: File sizes for design data ranged from 1.5 to 76 GM. Data preparation times averaged 6.5 hours of CPU time with a max of 360 hours.

Wafer processing with Microlithography

Fabrication processes of an integrated circuit fall into 3 categories: film deposition, patterning, and semiconductor doping. Conductors and insulators are used to connect and isolate transistors. Doping allows the conductivity of the silicon to vary with voltage. fundamental to all of these processes is lithography which forms 3D relief images on the substrate where the pattern can be transferred to.  The patterns are written with a photoresist lithography and etch transfer step usually up to 30 times to build the millions of transistors and many wires. Each pattern printed is aligned to the previous pattern and slowly the conductors, insulators, and doped regions are built up to form the final device.

Lithography:  “This accounts for about 30% of the cost of manufacturing, and it’s often the technical limitation on reducing the size of the chip even further.   Optical lithography is a photographic process which exposes the photoresist (a light sensitive polymer) and developed to form 3D images on the substrate.

Lithography process: substrate preparation, photoresist spin coat, prebake  exposure, postexposure bake, development, postbake, resist strip

Substrate Preparation improves adhesion of photoresist material to substrate by cleaning, baking at 600 C or using chemicals to get rid of water, and adding an adhesion promotor.

Photoresist Coating. Spin coating: the photoresist is made liquid, poured on, then spun on a turntable at high speed.  This has to be very carefully controlled to get the right thickness and uniformity which varies depending on the substrate material.

Postapply Bake: Dry the photoresist after the spin coat process by removing excess solvent using a hot, high-mass metal plate in a vacuum

Alignment & Exposure: Scanning projection printing uses a slit of light from the mask onto the wafer after it’s been aligned properly (very complicated)

Postexposure bake: To remove standing wave ridges

Development: Once exposed, the photoresist must be developed with tetramethyl ammonium hydroxide poured on a rotating wafer or sprayed on

Ion Implantation        

Dozens of ion implantation steps are usually required that very precisely plant the right amount of dopants (ions) at just the right spot.  p-tpye dopant boron (B+, FB2_,), n-type phosphorus, arsenic, other dpoants are indium, antimony, germanium etc

Beamline architectures: 3 types of tools all have implanter beamlines that start with an ion source and extraction optics that inject an appropriately shaped beam of ions into subsequent elements of the beamline. Implanter beamlines also need a mass analysis devise to provide momentum dispersion and transverse focusing of the ion beams.  There are high-current beamlines, high-energy beamlines, and medium current beamlines.

Multi-wafer & single wafer. High-current and energy architectures use a multi-wafer batch processing chamber where many wafers can be implanted at once using a spinning disk at 1000 rpm of the wafers across a fixed-spot beam.  Single wafer processing just ipmlants a single wafer.

Thermal Annealing: Postimplant thermal annealing repairs the crystalline structure of the wafer from the damage created during implantation and electrical activation of the new dopant ions. This is done usually with isothermal lamp or hot-walled furnaces

Wet Etching: The etch process transfers a pattern from a mask layer to the underlying layer by using a chemical etchant, and the rest is intact because it’s protected by the mask layer below. Wet chemical etching reacts with the substrate to produce soluble products that can be washed off. Dry etching uses plasma gas to etch both chemically and physically.

  • HF-based etching chemistry   Hydrofluoric acid (HF)-based etching are the most commonly used wet etchants.
  • Metal Etching Used on aluminum (al), copper, gold, nickel, platinum, chromium, and titanium.     cyanide solutions, phosphoric acid, ammonia
  • Wet etching for compound semiconductor:   Oxidize substrate surface and remove soluble reaction products.

Wet Etching Equipment: Immersion processors (wet benches).  Wafers are immersed, then rinsed, often with physical agitation from ultrasonic agitation, nitrogen bubbling through the solution, or mechanically.  Rinse tanks : 1) quick-dump with top spray, 2) cascade overflow with hot water, 3) Spin rinse dry.  Drying equipment: 1) hot nitrogen, vacuum, slow pull, or isopropyl alcohol vapor drying

Environmental and health issues:    Some of the most hazardous chemicals are used in the wet etching process, such as hydrogen peroxides. Strong acids and oxidizers are often mixed and heated generating fumes that can spread highly corrosive droplets. Cynaide solutions for gold can turn into the deadly gas HCN.

Plasma Etching. Plasma is the only way to etch micron-sized features and faithfully transfer submicron patterns and has replaced wet etching in making semiconductors.  The 4 basic ways plasma etching is used are: 1) sputtering ions strike the substrate and eject materials at low pressure, 2) chemical etching where neutrals in the plasma react with substrate materials to form volatile products, 3) ion-enhanced etching where ions strike the substrate surface, enhance chemical reactivity, and improve desorption of volatile products, 4) sidewall inhibitor etching

Plasma etching systems: This equipment varies depending on what frequencies, pressures, external power sources, load size, and vicinity of the substrate to the plasma source is desired.

Silicon etching: done with F-, Cl-, and Br-based chemistries using ion-driven anisotropy or inhibitor-assisted anisotropy.

Dielectric materials and metal etching: Other materials besides silicon need to be etched when making IC devices.

MEMS device plasma etching: Microelectromechanical systems device makers don’t use transistors as the basic building blocks like IC devices, nor are the relatively uniform.  MEMS can be tens to hundreds of micrometers deep.

Multiplex etching: Time Division Multiplex etching alternates plasma deposition with etching steps.


Chapter 38 the fabrication plant.

I am going to skip ahead to give you an idea of what the building is like where all these processes are going on.

The temperature must stay between 68.4 and 71.4 degrees Fahrenheit, and the relative humidity between 44.1% and 45.9% or the equipment doesn’t function properly.  It becomes misaligned, impacts repeatability of the developed process, and reduces output. This is a huge building to keep within such a narrow range, and some areas require even narrower ranges of between 69.9 and 70.1, which increases costs up to 50%.

Table 38.5 Generic cleanroom ISO class 3 criteria specifications.

  1. Air change rate. 600 times per hour
  2. Airflow. Unidirectional
  3. Air filtration. Terminal (UPLA) filters 99.99995% efficience at .012 um
  4. Air handlers. Rooftop makeup AHUs, recirculating indoor units
  5. Air pressure. Pressure differential + .005” w.g. versus reference corridor
  6. Temperature. 70 degrees Fahrenheit +/- 2%, no more than 3% variation in 4 hours
  7. Humidity. 45% relative humidity +/ 1/2%, no more than 3% variation in 4 hours
  8. Exhausts. Scrubbed acid, abated solvents, general, and heat exhausts
  9. Vibration and noise. NC-50, < 300 uin/s peak to peak, 0-15 Hz
  10. Magnetic flux. .5 G maximum
  11. Electrostatic charge. 1 mJ x 10-7 m2 maximum
  12. Energy. 1,200,000 BTU per square foot per year (operating 23 hours a day, 365 days)
  13. Form, function. 60,000 ft2 floor. Bay and chase, subbasement, mec. Floor, office
  14. Particulate. Particles per cubic food, .3 u in size <1   .12 u in size < 35
  15. Process piping. DI water-virgin PVDF, ultrapure gases, ultrapure chemicals-seamless 316L electropolished tubing stainless steel

Mechanical only construction:

  • makeup AHUs with ductwork
  • recirculating AHUs
  • cooling: refrigerant coir. Air cooled with piping
  • Heating: steam. Zone reheat-electric
  • Humidification: steam with piping
  • Exhaust systems with ductwork
  • Process piping
  • Fan-filter units with grid
  • Cooling: chillers with cooling towers
  • Heating: hot water. Zone reheat-hot water
  • Humidification: adiabatic

Section titles of the clean room design and construction chapter:

  • Airflow Layouts and Patterns: unidirectional airflow, turbulent airflow, air changes. Recirculating air units. Controls. Electrical. Structural. Air-balancing dampers. Return-air path. Differentuial-pressurization limitations.
  • Ceiling systems, wall systems, floor systems. Structure. Fire sprinkler penetrations. HEPA ceiling coverage. Unidirectional flow ceiling height. Unidirectional flow ceiling grid alignment.
  • Cleanroom Lighting.  Lighting type, levels, yellow lighting
  • Cleanroom walls, windows, doors and flooring. Interior movable walls construction. Rearrangement flexibility. Finish. Doors. Caulking practice. Clean flooring. Antistatic flooring. Floor finish. Floor installation. Vibration-sensitive tool mounting.
  • Exhaust systems, makeup air systems, recirculation air systems
  • Air Pressure differential.
  • Process Contamination Control. Air filtration, prevention, isolation, sweep
  • Vibration and noise control.  Concrete “waffle” slabs under the cleanroom floor
  • Magnetic and electromagnetic flux.
  • Electrostatic charge of air and surfaces.
  • Life Safety.

There are thousands of companies involved in clean room technologies
http://www.cemag.us/companies

Uncle!

At this point I am only 20% of the way through this 800-page book.  I can’t take it anymore!  I’ve checked it out twice and must return it, and if I check it out again, and again, and again to finish this post, I’ll wonder whatever happened to my life, it will almost be over…

So below is an outline of some of the chapters I didn’t cover on manufacturing, and then you’ll just have to get the book to see the other dozens of missing chapters.

Chapter 12. Etching of GaAs and Related Materials

  • Front Etch of GaAs
  • Backside Etch of GaAs
  • Etching of InP Materials
  • Etching of GaN Materials
  • ENDPOINT DETECTION IN PLASMA ETCHING
  • Pressure change, Bias change, Mass spectrometry, laser interferometry and reflectance, optical emission spectroscopy

Chapter 13: Physical Vapor Deposition

  • VACUUM EVAPORATION
  • Evaporator equipment: resistive heater or electron beam
  • LAYERS DEPOSITED USING EVAPORATOIN AND THEIR PROPERTIES
  • Metals, alloys, multilayer, chemical compounds, reactive evaporation
  • SPUTTERING
  • Stage 1: creation of ions through collision of inert gas atoms (Ar) with electrons and acceleration of ions toward a target, Stage 2: removing of target atoms by impact of ions with target, Stage 3: transport of free target atoms to the substrate, Stage 4: Condensation of target atoms on the substrate
  • Mechanism
  • Film Microstructure and Mechanical Properties
  • SPUTTER EQUIPMENT: DC-sputtering, HF/RF sputtering
  • Vacuum system, cooling water, Cathodes and Targets
  • Self-bias Effect
  • Bias Sputtering
  • Reactive Sputtering
  • Magnetron Sputtering
  • LAYERS DEPOSITED USING SPUTTERING
  • Metals: Au, Pt, Pd, Ni, Ti, Al, Cr, Mo
  • Alloys: NiCr, CrSi, TiW
  • Multilayers: Cr-Al, Ti-Au, Ti-Pd-Au, Ti-TiN-Au, Ti-TiWN-Au, NiCr-Ni-Au, SnO2, Cr-Al
  • Chemical compounds: Al2O3, SnO2, SiO2, ZnO, Ga2O3, HfB2, NiO, V2O5, Mo2O3, In2O3, glass (pyrex)
  • Step Coverage

Chapter 14: Chemical Vapor Deposition (CVD)

In this step, reactive gases pass over the silicon wafer and are adsorbed onto the surface where the reaction forms a film. By-products leave as gases and pumped away. Reactions are activated heating or radio frequency energy through plasma.

Components/Equipment:

  • Chamber
  • Pumps
  • Wafer Handling
  • Gas Delivery System
  • Radio Frequency system

PRECOATING AND CLEANING with fluorine containing molecules such as NF3, CF4, and C2F6, which react with the cvd film deposited on the chamber walls and forms volatile compounds that are then pumped away.

TROUBLESHOOTING particle problems: Gas-phase nucleation, Flaking, Abrasion, Condensation.

Deposition rate and Uniformity.

Chapter 15: Epitaxy

  • Epitaxy refers to the growth of a crystal on top of a host crystal in an orderly way.  The three most common modes are 1) layer-by-layer growth 2) Nucleation Growth 3) layer-by-layer followed by nucleation growth
  • Growth techniques and equipment
  • Molecular Beam Epitaxy
  • Silicon Epitaxy for Advanced CMOS technology: overview of Silicon Epitaxy
  • Epitaxy Parametric
  • Thickness. Resistivity. Surface defects. Bulk Metals. Flatness and Nanotopography.

Chapter 16: ECD Fundamentals

  • Basic Process Flow for Copper Damascene Processing,
  • Fundamental ECD technology (how plating works).
  • Basic electrochemistry.

Chapter 17: Chemical Mechanical Polishing.

  • Most common CMP processes: Oxide/Poly Si CMP, Metal CMP,
  • Removal Rate control.
  • Within Wafer Uniformity Control
  • Process consumables
  • Pad conditioning
  • Endpoint systems
  • In Situ metrology
  • Post-CMP Wafer Cleaning
  • Dry in-Wet out CMP tools, Dry in-Dry out tool, CMP wafer cleaners, Internal CMP cleaning systems
  • Common CMP platforms & tools: single head rotational systems, multihead rotational CMP systems, Multiplaten CMP systems, Orbital CMP systems, Linear Drive CMP tools
  • CMP Process Waste Management: oxide CMP process waste, Metal CMP process waste

Chapter 18: Wet Cleaning

  • Contaminants.
  • Theory of Particle Adhesion.
  • Wet Processing techniques: 1) liquid chemical cleaning, 2) scrubbing, 3) Pressurized Jet Cleaning, 4) Sonic Cleaning
  • Wet Cleaning Equipment: immersion, placing the wafers in a tank filled with a chemical, spray, using a nozzle to spray the wafers with a chemical, and dispense, directing a stream of appropriate chemical to the wafer
  • Front End-of-Line processes: Wafer cleans. Post-dry Etch or Ash residue removal. Metal removal. Post-CMP clean. Backside Cleans.
  • Back End-of-Line cleaning. Post-CMP. Post-etch residue removal. Backside and bevel cleans.
  • Wet Cleaning Equipment technology.
  • Batch Tank.  Batch Spray. Single Wafer.

Table 41.1 Chemical substances common in Semiconductor manufacturing

Toxic: Ammonia, arsine, boron trifluoride, carbon tetrafluoride, chlorine, hydrochloric acid, hydrofluoric acid, methyl alcohol, nitric acid, methylene chloride, phosphine, phosphorus pentafluoride, 1,1,1-trichloroethane

Corrosive: Acetic acid, ammonia, chlorine, fluorine, hydrochloric acid, hydrofluoric acid, nitric acid, ozone, sulfur dioxide, sulfuric acid

Irritants: Acetic acid, acetone, ammonia, chlorine, formaldehyde, isoproponal, methyl alcohol, NMP, Ozone,, PGME, PGMEA, Tolulene, Xylene

Odorous: acetic acid, ammonia, butyl acetate, chlorine, formaldehyde, hydrofluoric acid, hydrogen sulfide, isopropanol, NMP, PGME, PGMEA, phosphine, xylene

References

Andrews, Esther. Jan 22, 2012. What’s Behind the Products you Love?  intel.com

Benini, Luca. Resource Allocation & Scheduling in Moore’s Law Twilight Zone. Università di Bologna & STMicroelectronics

Fiddler, Jerry (chairman of Wind River Systems). 2002 “Keynoter says chip value is in its intellectual property,” EE Times

Mims, C. April 20, 2010. The High Cost of Upholding Moore’s Law. Technology Review.

Nuttall, Chris. July 20, 2009. “Moore’s Law reaches its economic limits”, Financial Times.

Reuters (2019) Samsung electronics chip output at South Korea plant partly halted due to short blackout. https://www.reuters.com/article/us-samsung-elec-plant/samsung-electronics-chip-output-at-south-korea-plant-partly-halted-due-to-short-blackout-idUSKBN1Z01K3

SeekingAlpha (2014) ASML And Smaller Computer Chips: Will Moore’s Law Break?

Ting-Fang C, Li L (2021) Taiwan’s chip industry under threat as drought turns critical. TSMC and UMC activate water-supply plans as reservoirs face depletion in 60 days. Nikkei Asia.

Posted in Chemicals, Microchips and computers | Tagged , | 16 Comments

Many steps using fossil fuels to make cans & potato chips

Preface.  I am gobsmacked by how much energy goes into making beverage cans and potato chips, look at all the steps, each one using energy!  Why haven’t we run of oil yet? Especially when you look at everything else out there, cars, roads, bridges, buildings, each of them going through even more energy intensive steps.  

One of my ideas to preserve knowledge was to etch books on aluminum cans since they don’t rust and there are so many of them. Books and microfiche only last 500 years at best, and the electric grid will be down long before that.  But with conventional oil peaking in 2018 (EIA 2020), there’s not much time left for my aluminum can preservation of knowledge, if it would work that is — the materials scientists I wrote didn’t write back. They probably still think I’m a crackpot!

EIA. 2020. International Energy Statistics. Petroleum and other liquids. Data Options. U.S. Energy Information Administration. Select crude oil including lease condensate to see data past 2017.

Alice Friedemann   www.energyskeptic.com  author of “Life After Fossil Fuels: A Reality Check on Alternative Energy”, 2021, Springer; “When Trucks Stop Running: Energy and the Future of Transportation”, 2015, Springer, Barriers to Making Algal Biofuels, and “Crunch! Whole Grain Artisan Chips and Crackers”. Podcasts: Collapse Chronicles, Derrick Jensen, Practical Prepping, KunstlerCast 253, KunstlerCast278, Peak Prosperity , XX2 report

***

Paul Hawken, Amory Lovins & L. Hunter Lovins. 1999. Natural Capitalism. Earthscan Publications   Chapter 3: “Waste Not”, pages 49-50.

A striking case study of the complexity of industrial metabolism is provided by James Womack and Daniel Jones in their book Lean Thinking, where they trace the origins and pathways of a can of English cola. The can itself is more costly and complicated to manufacture than the beverage.

  1. Bauxite is mined in Australia,
  2. trucked to a chemical reduction mill,
  3. each ton of bauxite processed and purified into a half ton of aluminum oxide.
  4. It is then stockpiled,
  5. loaded on a giant ore carrier
  6. and sent to Sweden or Norway, where hydroelectric dams provide cheap electricity.
  7. After a month-long journey across two oceans, it usually sits at the smelter for as long as two months.
  8. The smelter takes two hours to turn each half ton of aluminum oxide into a quarter of a ton of aluminum metal, in ingots ten meters long.
  9. These are cured for two weeks before being shipped to roller mills in Sweden or Germany.
  10. There each ingot is heated to nearly 900 degrees Fahrenheit
  11. and rolled down to a thickness of an eighth of an inch.
  12. The resulting sheets are wrapped in ten-ton coils
  13. and transported to a warehouse,
  14. and then to a cold rolling mill in the same or another country,
  15. where they are rolled tenfold thinner, ready for fabrication.
  16. The aluminum is then sent to England,
  17. where sheets are punched and formed into cans,
  18. which are then washed,
  19. dried,
  20. painted with a base coat,
  21. and then painted again with specific product information.
  22. The cans are next lacquered,
  23. flanged (they are still topless),
  24. sprayed inside with a protective coating to prevent the cola from corroding the can,
  25. and inspected.
  26. The cans are palletized,
  27. fork lifted,
  28. and warehoused until needed.
  29. They are then shipped to the bottler,
  30. where they are washed
  31. and cleaned once more,
  32. then filled with water mixed with flavored syrup, phosphorus, caffeine, and carbon dioxide gas.
  33. The sugar is harvested from beet fields in France and undergoes
  34. trucking,
  35. milling,
  36. refining
  37. and shipping.
  38. The phosphorus comes from Idaho, where it is excavated from deep open-pit mines – a process that also unearths cadmium and radioactive thorium. Round-the-clock, the mining company uses the same amount of electricity as a city of 100,000 people in order to reduce the phosphate to food-grade quality.
  39. The caffeine is shipped from a chemical manufacturer to the syrup manufacturer in England.
  40. The filled cans are sealed with an aluminum ‘pop-top’ lid at the rate of fifteen hundred cans per minute,
  41. then inserted into cardboard cartons printed with matching color and promotional schemes.
  42. The cartons are made of forest pulp that may have originated anywhere from Sweden or Siberia to the old-growth, virgin forests of British Columbia that are the home of grizzly, wolverines, otters, and eagles.
  43. Palletized again, the cans are shipped to a regional distribution warehouse,
  44. and shortly thereafter to a supermarket where a typical can is purchased within three days.

The consumer buys twelve ounces of the phosphate-tinged, caffeine-impregnated, caramel-flavored sugar water. Drinking the cola takes a few minutes; throwing the can away takes a second. In England, consumers discard 84% of all cans, which means that the overall rate of aluminum waste, after counting production losses, is 88%. The United States still gets three-fifths of its aluminum from virgin ore, at 20 times the energy intensity of recycled aluminum, and throws away enough aluminum to replace its entire commercial aircraft fleet every three months.

Every product we consume has a similar hidden history, an unwritten inventory of its materials, resources, and impacts. It also has attendant waste generated by its use and disposal … The amount of waste generated to make a semiconductor chip is over 100,000 times its weight; that of a laptop computer, close to 4,000 times its weight. Two quarts of gasoline and a thousand quarts of water are required to produce a quart of Florida orange juice. One ton of paper requires the use of 98 tons of various resources.

Ryan JC, Durning AT. 2012. Stuff:  The secret lives of everyday things.  Sightline Institute.

This image has an empty alt attribute; its file name is potato-chip-manufacturing.jpg

A diesel-powered harvester dug up my potato, which was trucked to a processing plant nearby.

Half the potato’s weight, mostly water, was lost in processing.

The remainder was potato parts, which the processing plant sold as cattle feed.

Processing my potato created two-thirds of a gallon of waste-water. This water contained dissolved organic matter and one-third gram of nitrogen.

The waste-water was sprayed on a field outside the plant. The field was unplanted at the time, and the water sank underground.

Freezing the potato slices required electrical energy, which came from a hydroelectric dam on the Snake River. 

Frozen foods often require 10 times more energy to produce than their fresh counterparts. In 1960, 92% of the potatoes Americans ate were fresh; by 1990, Americans ate more frozen potatoes, mostly french fries, than fresh ones. My fries were frozen using hydrofluorocarbon coolants, which have replaced the chlorofluorocarbons (CFCs) that harm the ozone layer. Some coolants escaped from the plant. They rose 10 miles up, into the stratosphere, where they depleted no ozone, but they did trap heat, contributing to the greenhouse effect.

A refrigerated 18-wheeler brought my fries to Seattle. They were fried in corn oil from Nebraska, sprinkled with salt mined in Louisiana, and served with ketchup made in Pittsburgh of Florida tomatoes. My ketchup came in four annoyingly small aluminum and plastic pouches from Ohio.

Posted in EROEI Energy Returned on Energy Invested, Manufacturing & Industrial Heat | Tagged , , , , | 8 Comments

Will the Great Game be won by Cyber Attacks?

Preface.  This is a book review of Joel Brenner’s “America the Vulnerable: Inside the New Threat Matrix of Digital Espionage, Crime, and Warfare”.

The ransom cyber attack on the colonial pipeline forced the shutdown of a vital pipeline delivering half the gasoline, jet fuel, and diesel traveling from the Gulf Coast to the Northeastern U.S., causing panic as thousands of fueling stations ran out of fuel (Kraus 2021).

So consider what will happen after a cyber attack in the Great Game to get control of the last oil and other resources.  Perhaps better than a nuclear war, eh.

Alice Friedemann   www.energyskeptic.com  author of “Life After Fossil Fuels: A Reality Check on Alternative Energy”, 2021, Springer; “When Trucks Stop Running: Energy and the Future of Transportation”, 2015, Springer, Barriers to Making Algal Biofuels, and “Crunch! Whole Grain Artisan Chips and Crackers”. Podcasts: Collapse Chronicles, Derrick Jensen, Practical Prepping, KunstlerCast 253, KunstlerCast278, Peak Prosperity , XX2 report

***

Brenner J (2011) America the Vulnerable: Inside the New Threat Matrix of Digital Espionage, Crime, and Warfare. Penguin Press.

After reading this book you’ll wonder what secrets haven’t been stolen, what infrastructure doesn’t have hidden time bombs waiting to go off, and if there are any corporations, government organizations, or military departments that haven’t lost data to cyber attacks and cyber criminals.

Brenner makes the case that so many industrial and military secrets are being stolen that our prosperity and security are threatened. We’ve probably lost half a million jobs and hundreds of billions of dollars from all the technological secrets stolen that we spent years developing.

The problem with cyber attacks is that when a system is infected with malicious code, it can be impossible to remove.  The code can evade detection by opening electronic “trapdoors” allowing hackers to bypass the system’s security.  If a trapdoor is closed, the code opens another door.  And even if you manage to find the code, you have no way of knowing who did it, so how so how can you put anyone in jail or stop them from continuing to attack, and steal personal data, intellectual property, and national defense secrets?

Worse yet is the kind of cyber warfare Brenner calls the “Criminal-Terrorist symbiosis”. The only difference between terrorists and nation-states is the latter have more expertise right now, but that is likely to change. As China’s Dr. Shen Weiguang wrote, “Every computer has the potential to be an effective fighting unit; and every ordinary citizen may write a computer program for waging war.”  Thanks to the 2010 Wikileaks list of world-wide critical infrastructure, terrorists know exactly what targets to attack.

Who’s stealing information?

Freelance hackers, Russian mobsters, and other countries – especially China, Iran, France, Israel plus another 108 foreign intelligence services.

The FBI has discovered that the People’s Liberation Army (PLA) in China has 30,000 cyber-spies, who can draw on 150,000 private sector computer experts for help in stealing “American military and technological secrets and cause mischief in government and financial services”.

Corporations conduct industrial espionage against one other.  Oracle won a $1.3 billion lawsuit against German company SAP for getting into their systems and stealing their software code.

Employees steal information to sell.

  • Ford lost a great deal of design documents for engines, transmissions, and so on when a product engineer sold them to his new employer, Beijing Automotive Company.
  • An employee at Goldman Sachs stole secret algorithms used to automate their securities trading.
  • Engineers at Goodyear Tire & Rubber stole trade secrets to sell to a Chinese tire maker.
  • Dow Chemical, General Motors, and DuPont all had intellectual property stolen

Why is it so easy?

The internet wasn’t built to be secure — it was built to be used by educational and government institutions to share information.  It was never meant to be the backbone of commerce and military communications.

How do they do it?

Criminal hackers can park in a van with powerful antennas.  For many years, retail stores used wireless networks that transmitted un-encrypted data, which could easily be read with “sniffer” programs that grabbed credit and debit card data.

Thieves can get your personal data by getting you to click on attachments or other links that load malware, which then searches through your files looking for any that might have passwords to your banking and brokerage accounts.  These files are packaged and sent back to the hackers.

Anyone who loads P2P software to get free music, movies, and other free stuff is just asking to be robbed, because now all your files are visible to cyber-criminals.  Examples of such software are LimeWire, Kazaa, BearShare, and FastTrack.

If you use passwords like 12345 or ‘password’, then you’re almost certainly hosting a botnet, which could be doing many things, though most likely what it’s doing is sending millions of spam emails.  But the owners can also use your computer to attack companies and governments with denial of service attacks.

Many hackers steal data but have no idea what to do with it.  No problem, there are middlemen who pay for credit card data and sell it to cyber-criminals.  So much stolen credit card data is available that the price has dropped.

Thieves love getting PIN numbers – which is bad news for you.  If a criminal uses your PIN to get cash, it’s up to you to prove the withdrawal was a fraud, which is almost impossible.

Thieves also get your data by churning out 57,000 new fake web addresses every day that they load with computer malware and viruses.  They’re hoping you’ll think the site is real and log on to your bank account.  They’re also operating within Twitter, Facebook, YouTube, and Flickr.  Soon, if not already, they’ll be looting the Cloud.

It’s so easy to hand out free poisoned USB drives at conferences and trade shows, or leave them lying around in places where someone might find them. This is how about 1 in 4 computer worms get into networks.

Executives routinely have their laptops searched and loaded with malware in their hotel rooms in some foreign countries.

Billions of dollars in intellectual property espionage has taken place.  The Chinese have been very clever at getting this data.  One backdoor method was to sneak into the networks of intellectual property lawyers.  They’re privy to business and investment plans, business strategies, technical secrets, and much more.

This was much easier than breaking into a corporate network because lawyers don’t like listening to technical people. They’re impatient to make money, and can’t be bothered with trivial things like requiring passwords on mobile devices that connect to the firm’s servers. U.S. Law firms have been penetrated here and abroad, especially if they have branches in China or Russia.

Military

The first sentence of the book is about twenty terabytes of data stolen from the Pentagon – that’s equal to 20% of what’s in the Library of Congress. It would take a line of trucks 50 miles long to haul this data if it were in print.

The Chinese realized that they could get military secrets by going after military contractors, who get $400 of the $700 annual Pentagon budget.  So they’ve broken into computer systems at Boeing, Lockheed Martin, General Dynamics, and Northrop Grumman.  These companies don’t just make tanks and airplanes – they make complex subsystems function as a whole, including merging voice, video, and data signals that travel on the same fiber-optic cables, microwave signals, and satellite links.

China has stolen military technology that cost American Taxpayers tens of billions of dollars to develop, such as:

  • The Quiet Electric Drive propulsion system that makes our naval ships and submarines almost impossible to track and detect.
  • Information on the next generation of “U.S. Navy destroyers, aircraft carrier electronics, submarine torpedoes, electromagnetic artillery systems, the electronics of our next-generation Joint Strike Fighter aircraft, the F-35, etc.
  • They have built radar systems stolen from us, only better, since they know how our radar works, when they built their own systems they modified them in ways we can’t penetrate.

Government:  The GAO says that the number of malicious software attacks on government computers is up 650% since 2006

Banks

Most of the time, banks hide theft from their systems so that people don’t lose confidence and start a run on the bank.  Here are a few scams that did manage to make the news:

  • Heartland Payment Systems (processes bank card payments for merchants). In 2009  130 million credit and debit card numbers and data were stolen.   Their stock price went from $15 to $3.78 per share.
  • Royal Bank of Scotland payroll system 2008: information stolen on ATM cards.  Cards created and used at 139 ATMs and $9 million stolen within 30 minutes in the USA, Canada, Russia, and China.  It’s one of the largest bank robberies in history.

Infrastructure

Brenner states that losing control of infrastructure systems “would create widespread disruption and loss, and bring our society to a standstill”.

We are totally vulnerable – all of our industrial, military, banking, financial, satellite, air traffic control systems, dams, electric grid, oil and gas infrastructure, Nuclear Power plants, stock exchanges, sewage, water delivery systems, railroad signaling systems, telecommunications, and business systems are electronic and connected to the internet.  Worse yet, essential infrastructure isn’t isolated electronically like it should be – having the electric grid and other essential infrastructure connected to the internet is crazy and dangerous, but regulatory agencies are powerless to force corporations to protect themselves.

Lives are at stake, many millions of people could die if electric grids, water delivery systems, telecommunications, the financial system, and so on were brought down for long.  These targets would certainly be brought down in a war, but might even be attacked during a diplomatic standoff like the one Brenner envisions in Chapter 7 between China and the USA.

Businesses could be attacked in many ways.  Production lines can be shut down.  Goods can be sent to the wrong destination.  HVAC could be turned off. And the cyberthieves could delete the log entries of their entry into business systems and leave no footprints or DNA like regular burglars.

CEO’s and other top executives could be kidnapped or killed if their calendars can be tapped into.

Companies are also vulnerable to extortion or the electric grid will be brought down, as has already happened in India, Saudi Arabia, the Middle East, China, and France.

We also have too many single points of failure, where the entire system comes down if just one part fails. All cyber-attackers would need to do is disable one electric substation, one financial exchange, and so on. An example of this (not done by hackers) was when the 1998 Galaxy IV communications satellite failed and up to 90% of pagers in the United States stopped working.  Hospitals couldn’t reach doctors; credit cards didn’t work at gas stations, and so on.

Industrial control systems are run by SCADA systems that supervise and control components scattered over many places.  SCADA is constantly checking on temperature, pressure, inputs, outputs, and other variables to make changes faster than a person could.  These systems were never designed to be connected to the internet.  Only a few are encrypted.  It was assumed a person would use them at the local facility in question.

By putting these systems on the internet, the entire economic security of our nation is put at risk.  Some of it can even be accessed with Bluetooth wireless technology, which is highly insecure. This vulnerability isn’t necessary.

Industries say they need to keep their facilities hooked up to the internet so they can patch their software with the latest fixes.  But they don’t systematically patch their systems, and if they did, that could be dangerous, the patch could crash or slow the industrial system down. Usually patches have d to be tested before a company dares to apply it.

Brenner says that the real reason our infrastructure is at risk is because companies don’t want to spend the money to make their systems secure.  A survey by McAfee, “In the Crossfire, Critical infrastructure in the age of Cyber War” surveyed oil and gas, electricity, sewage, and telecom companies about why they weren’t protecting their systems.  They said they wouldn’t be held liable and expected a government bailout, ratepayers, customers, or insurance to pay for any cyberattacks.

Electric Grid

This system is so vulnerable to physical and cyber-attack that I thank every day the electric grid is still up.  I’m in awe that the operators can balance the electric load from so many intermittent sources of power, like wind, and all the hundreds of other providers and keep electricity within the narrow bandwidth it must stay in or blow up the system.

If cyber-attackers or terrorists attacked the large generators that supply large cities, it would take us two to five years to replace them.  That’s because nearly all North American industrial electric generators are made overseas, and the biggest, most important ones come mainly from China, and some from India.  Can you imagine living for 2 years without electricity?  And even longer if the cyberattack came from China – they’re not going to be in any rush to fulfill that order!

There are more than 1,800 owners and operators in the North American bulk-power system.  There are 200,000 miles of high-voltage transmission lines, thousands of generation plants, and millions of digital controls.  This is regulated by the North American Electric Reliability Corporation, or NERC.  Naturally NERC wanted to know which, if any of these assets are being protected.  So NERC contacted the industry and asked them to identify the assets that “if destroyed, degraded, or otherwise rendered unavailable would affect the reliability or operability of the Bulk Electric System”.  Since there’s no definition of what’s critical, the results were disappointing to put it mildly.  73% of respondents said they didn’t have any critical cyber assets.

That’s because engineers are trained to think about the odds of equipment failing, but they don’t have a clue about the risks of malicious cyberattacks. Nor can NERC force utilities to do anything, because each utility can do whatever they want, NERC has no teeth.  Congress has allowed owners and operators to control whatever standards they feel like applying to themselves.

What needs to happen is for the electric grid to have systems that can recover quickly because of redundant systems.  Thanks to the deregulation of the electricity, no one is responsible for the physical infrastructure of the grid, and it’s falling apart.  It used to be triple-plated, or triply redundant, now it’s a bare bones single plated skeleton.  I’ve got an Electric Grid Overview at energyskeptic that explains this in detail.

President Obama has said that “We know cyberintruders have probed our electrical grid and in other countries cyberattacks have plunged entire cities into darkness.”

Senior intelligence officials believe the Russians and Chinese are already inside parts of the electric grid in the USA, and have left behind software that could be turned on and used to destroy the grid if we went to war.  Meanwhile, Iran and terrorist groups like al-Qaeda are trying to do this as well.

Electric grid attacks:

  • Brazil had blackouts affecting 3 million people and took down world’s largest iron ore producer, costing that company $7 million dollars.
  • Australia: extremists with the Pakistani group Lashkar-e-Taiba tried to bring the grid down in 2003 (the group that committed mass murders in Mumbai 2008)

If an insider could be bribed or hired, the odds of a successful attack would be quite high.  A disgruntled employee could help ID critical systems, let cyberattackers through internet and real physical doorways, and send details of how security works at a given facility.

Oil and Gas. Disastrous economic and environmental harm could be done by sabotaging oil and gas infrastructure.

  • Oil rig blowout preventers could be attacked and other components of offshore drilling equipment and create another Gulf Oil spill or worse.
  • In 2009 an employee at pacifric Energy Resources sabotaged the leak-detection system on an oil rig off the California coast (luckily discovered before harm was done)
  • This sector has the highest infiltration rate, with more than half of companies in this sector with stealth attacks every month.

Sewage systems

In 2000 an angry sewer system operator in Australia got even by driving around and giving radio commands to sewage equipment that made the system fail.  Pumps stopped, alarms remained quiet, and pumping stations couldn’t communicate with the main computer.  The result was millions of gallons of raw sewage erupting into parks and rivers.  If he’d attacked the water supply instead, he’d have killed people

Botnets

In 2010 a gigantic botnet was discovered that had gotten into at least 75,000 computers at 2,500 different companies around the world, such as Marck, Paramount Pictures, and Juniper Networks.  This malware was stealing the logins for corporate electronic financial systems.

Credit and Debit card number theft

Below are some of the companies mentioned in the book.  The number in parentheses is the number of customer credit and debit card numbers & data stolen:

  1. Best Western hotel group 2008: (8,000,000)  Sold to Russian mafia.
  2. BJ’s Wholesale Club (400,000), DSW (1,000,000), Marshalls & T. J. Maxx (45,600,000), Dave & Buster’s, OfficeMax, Boston Market, Barnes & Noble, Sports Authority
  3. Walmart: Kim Zetter, “Big-Box Breach: The inside story of Wal-Mart’s Hcker Attack,” Wired, October 13, 2009.
  4. Montgomery Ward 2008: (51,000) Brian Bergstein, “Wards didn’t tell consumers about credit card hack”, USA today.
  5. HEI hotels & resorts (i.e. Hilton, Marriott, Sheraton, etc.) 2010: credit card data of several thousand guests by altering swipe machines at check-in counters
  6. 7-Eleven: $2 million from 2,200 Citibank ATMs and $5 million in fake prepaid iWire cards
  7. Hannaford supermarket chain: (4,200,000)

Energy companies

The ‘bid data’, which as the quantity, value, and location of oil discoveries worldwide was stolen by Cina from Marathon Oil, ExxonMobil, and ConocoPhillips. This information costs tens of millions of dollars to get  by using expensive exploration equipment and software.

China

On page 67 Brenner describes the history of China, the upshot of which is that “China does not regard Western domination as normal, and it does not suffer from an inferiority complex.”  For most of history, China was the top dog. Until the 15th century, they had the world’s highest per capita income and best technology.  Their goal is to be the top dog again.

On page 75, Brenner believes that “an armed conflict between the United States and China would likely be a naval confrontation, and naval modernization is one of China’s highest priorities”.

Chapter 7 is how a war scenario between China and the U.S. would turn out in the South China Sea (which is all about oil, that’s one of the few places left where oil reserves might be discovered besides the Arctic). The U.S. is very likely to lose since China could easily launch a cyber war on the U.S. that would take out much or most of our electric grid and do other damage as well, while they can shut down access to their system and prevent retaliation.  Chapter 7 has the scenario in detail.

As far back as 1988 the idea of information warfare was presented by Dr. Shen Weiguang at a lecture at Beijing’s National Defense University.  Weiguang said that instead of killing or occupying enemy land, victory would come by using the “information space” to destroy the enemy’s military, financial, and telecommunications networks.

This idea really struck home as the Chinese watched the USA smash the Iraqi forces in 1991, when they realized we could do the same to the People’s Liberation Army.  Clearly a better way to fight the Americans would be economically by stealing secrets electronically and using cyberwarfare — much less expensive and potentially more destructive than military weapons – rather than direct confrontation.  If the military could be paralyzed, their information systems corrupted, and made blind and deaf, the American military would be useless, impotent.

In addition, the Chinese realized they could attack a nation’s currency after watching George Soros attack the currencies of East Asian nations.

The Chinese haven’t even tried to hide how they’d go about using cyberwarfare to their advantage.  They’ve made it clear they’d attack a nation’s communication and control nodes so that they couldn’t trust their own systems, which would disrupt decision making, operations, and moral.  They’d bring down the electric grid, transportation systems, and financial networks.

The Chinese military understands that nations too fond of war perish and believe that Americans are incapable of realizing that due to their love of technology.

Cyberwarfare

Brenner defines 6 kinds of cyberwarfare:

  1. Electronic propaganda, where each side tries to portray themselves as superior through TV, internet, and radio broadcasts
  2. Massive Denial of Service attacks. Russia used denial of service attacks to shut down the Estonian governmental and financial institutions.
  3. Strategic cyberwar against infrastructure: railways, power grids, air traffic control. Brenner thinks this is unlikely because it would be hard to limit to a single country, and disrupting financial markets would affect everyone.
  4. Electronic sabotage is passing along bad information, computers and microchips that might initially perform well, but eventually fail, or attacking supply chains.  Most devices are composed of hundreds of parts that come from all over the world, so counterfeit computer chips, low-quality screws, and other components could disable an enemies products.
  5. Operational cyberwarfare is taking over the enemies communications systems, like the USA did in 2003 in Iraq, tricking their radar systems, and so on.
  6. Criminal-Terrorist symbiosis.  The definition is in the introduction above.

Related articles

Electric Grid


Posted in China and War, Cyber, Cyber Attack Books, CyberAttacks, War Books | Tagged , , , | Comments Off on Will the Great Game be won by Cyber Attacks?

Renewables: not enough minerals, energy or time and mining is destructive

This image has an empty alt attribute; its file name is mining-waste-pollution-from-air.jpg

Preface. Electricity generating contraptions like wind and solar can’t replace the 50% of oil used in global manufacturing, because they can’t generate the high heat needed, or run battery or catenary electric trucks as I explained in “When Trucks Top Running”. Nor are there enough rare earth metals, lithium, cobalt and others to scale up renewables.

Peak metals in the news:

Tabuchi H (2021) Thieves Nationwide Are Slithering Under Cars, Swiping Catalytic Converters. The pollution-control gadgets are full of precious metals like palladium, and prices are soaring as regulators try to tame emissions. Crooks with hacksaws have noticed. New York Times.

And there simply aren’t enough minerals on earth to make a transition to “renewables”:

Alice Friedemann  www.energyskeptic.com Women in ecology  author of 2021 Life After Fossil Fuels: A Reality Check on Alternative Energy best price here; 2015 When Trucks Stop Running: Energy and the Future of Transportation”, Barriers to Making Algal Biofuels, & “Crunch! Whole Grain Artisan Chips and Crackers”.  Podcasts: Crazy Town, Collapse Chronicles, Derrick Jensen, Practical Prepping, KunstlerCast 253, KunstlerCast278, Peak Prosperity

***

Since renewables depend on fossil fuels entirely for every step of their life cycle, I call them Rebuildables. The showstoppers keeping them from replacing fossil fuels are that they can’t substitute for fossils in either transportation (explained in When Trucks Stop Running), or in manufacturing (explained in “Life After Fossil Fuels”, because they can’t generate the high heat needed to smelt and forge metals, ceramics, solar cells, and the other components they’re made of. Without transportation and manufacturing, they can’t make “babies” and reproduce, no matter how much electricity they generate. And given their fossil-dependent life cycle, their energy return is certainly negative.

In addition, there aren’t enough rare earth metals, platinum group metals, steel, copper, and so on to scale them up to replace fossil fuels.

Just look at the materials to make a 2 MW wind turbine. To generate just half of U.S. electricity with wind would require 1,095,000 2 MW wind turbines (Friedemann 2015), each of them requiring 1,671 tons of material, including 1300 tons concrete, 295 tons steel, 48 tons iron, 24 tons fiberglass, 4 tons copper, and Chinese rare earth metals 0.4 tons of neodymium and .065 tons dysprosium (Guezuraga 2012, USGS 2011).  Then rinse and repeat every 20 years with 3.7 trillion pounds of materials. 

Utility scale batteries simply don’t scale up. The world’s largest lithium-ion battery project, a 300 MW facility, is being built in Moss Landing, California, adding enough storage capacity to the grid to supply about 2,700 homes for a month (or to store about .0009 percent of the electricity the state uses each year). But they’re far too expensive and don’t last long (15 year lifespan). At best, batteries can step in when peak power is needed, which mainly natural gas plants do today. They can not fill in the gaps of days, weeks, and even months when wind and solar generation flags. Especially in California, where both solar and wind fall off greatly in the fall and winter (Temple 2018).

Add billions more tons of materials to the rebuildable power shopping list for transmission, power plants, hundreds of square miles of backup utility-scale batteries, and then replace them in 20-25 years. 

Using fossil energy every step and releasing a lot of CO2, since mining consumes 10% of world energy (TWC 2020).

If you can get these minerals that is. By mid-century many minerals and metals needed for high-tech could be running short , including stainless steel, copper, gallium, germanium, indium, antimony, tin, lead, gold, zinc, strontium, silver, nickel, tungsten, bismuth, boron, fluorite, manganese, selenium, and more (Pitron 2020 Appendix 14, Sverdrup 2019, Kerr 2012 and 2014, Frondel 2006, Barnhart 2013, Bardi 2014, Veronese 2015).

Computers are made of 60 minerals, many quite rare with no substitutable elements (EC 2017, NRC 2008, Graedel 2015). Fortunately the abacus can be made entirely with renewable wood.

Bardi (2014) wrote “The limits to mineral extraction are not limits of quantity; they are limits of energy. Extracting minerals takes energy, and the more dispersed the minerals are, the more energy is needed. Today, humankind doesn’t produce sufficient amounts of energy to mine sources other than conventional ores, and probably never will. But long before they “run out”, if oil peaks, then game over, fossil fuel resources are necessary for the extraction of almost everything else, and the easy high-grade ores have been mined, leaving crummy ore and expensive declining fossils left to extract it.”

We’re out of time. It would take 15 years to ramp up rare earth mining to prevent China from controlling most of these 17 metals (GAO 2010). Though all China has to do is drop the price of a metal to drive a mine out of business. 

Not a problem many say. We’ll recycle. But some elements are impossible to pry out of composite materials and alloys (Bloodworth 2014, Hageluken 2012). The cost to recover most rare metals exceeds their value. Recycling is time-consuming and uses toxic chemicals to separate them out. Of the 60 most used industrial metals, 34 recycled less than 1% of the time, and another eight less than half the time (UNEP 2011). 

Solar panels don’t last forever. Ninety percent of solar panels are going into the landfill or are sent to Europe. They are not being recycled in the U.S. because it costs more, isn’t required and is expensive to dissemble, etch, and melt them to remove lead, cadmium, copper, gallium, aluminum, glass, and silicon solar cells.

While some parts of a wind turbine can be recycled, 720,000 tons of blade material are expected to end up in landfills over the next 20 years, especially the up to 300-foot-long blades made of materials not worth salvaging: resin and fiberglass (Stella 2019).

And it is not just solar, wind, nuclear, and other alternatives that use rare metals. The entire universe of green energy depends on dozens of metals (i.e. rare earth, platinum) as alloys in steel, electronics, computers, the power grid, phones, wind turbines, magnets, photovoltaic cells, electric motors, satellites, semi-conductors, telecommunications, fuel cells, batteries, lasers, fiber optics, catalysts, aluminum alloys, integrated circuits, GPS navigation, and much more. 

We are running out of time. China produces 90% of rare earth metals, and nearly all of dozens of other metals, plus owns part of all of mining companies around the world.  It’s as if Saudi Arabia bought most of the world’s oil fields.

The Chinese now control the entire manufacturing chain from mining to metals to making missiles, components used in defense systems, communications, computers and more. This is driving calls in the U.S. and Europe to open their own rare metal mines lest a missile using Chinese parts be programmed to fail in war.

Why compete? Let China mine for essential minerals. Mining and ore processing are the second most polluting industry on earth, spewing out acid rain and heavy metals onto land, water, and air (PEBI 2016). One fifth of China’s arable land is polluted from mining and industry (Chin 2014).  If their high-technology parts are booby-trapped to prevent war, all the better.  Why waste rapidly declining oil on wars?

Green energy is anything but clean and green, and quite a Pyrrhic victory for China! 

References

Andrews R. 2015. Renewable energy storage and power-to-methane. Energy Matters.

ASCE. 2017. America’s infrastructure report card. Energy D+. American society of civil engineers.

Bardi U. 2014. Extracted: How the Quest for Mineral Wealth Is Plundering the Planet. Chelsea Green.

Barnhart C, et al. 2013. On the importance of reducing the energetic and material demands of electrical energy storage. Energy Environment Science 2013(6): 1083–1092.

Bloodworth A. 2014. Track flows to manage technology-metal supply. Recycling cannot meet the demand for rare metals used in digital and green technologies. Nature 505: 19-20.

Cartlidge E. July 11, 2017. Fusion energy pushed back beyond 2050. BBC.

CE. 2020. Solar energy generation by state. ChooseEnergy.com.

CEC. 2014. Estimated cost of new renewable and fossil generation in California. California Energy Commission.

CCST. 2011. California’s energy future: The view to 2050 summary report. California Council on Science & Technology.

CCST. 2012. California’s energy future: electricity from renewable energy and fossil fuels with carbon capture and sequestration. California: California Council on Science and Technology.

Chin J, et al. 2014. China details vast extent of soil pollution. About a fifth of nation’s arable land is contaminated with heavy metals. Wall Street Journal.

Cooper M. 2013. Renaissance in reverse: competition pushes aging U.S. nuclear reactors to the brink of economic  abandonment. Institute for Energy & the environment, Vermont Law School.

Davidsson S, et al. 2012. A review of life cycle assessments on wind energy systems. The International Journal of  Life Cycle Assessment.

Davidsson S, et al. 2014. Growth curves and sustained commissioning modelling of renewable energy: Investigating resource constraints for wind energy. Energy Policy.

De Decker K. 2011. The bright future of solar thermal powered factories. Low Tech magazine.

Dittmar M. 2011. The end of cheap uranium. Science of the Total Environment.

DOE/EPRI. 2013. Electricity storage handbook in collaboration with NRECA. USA: Sandia National  Laboratories and Electric Power Research Institute.

Droste-Franke B. 2015. Review of the need for storage capacity depending on the share of renewable energies (Chap. 6). In Electrochemical energy storage for renewable sources and grid balancing.  Netherlands:  Elsevier.

EC. 2017. Communication from the commission to the European Parliament on the 2017 list of critical raw materials for the EU. European Commission.

EIA. 2017. Wind turbines provide 8% of U.S. generating capacity, more than any other renewable source. U.S. Energy information administration.

EIA. 2019a. Table 7.2a Electricity net generation total (all sectors). U.S. Energy Information Administration.

EIA. 2019b. Table 6.7.B. Capacity factors for utility scale generators not primarily using fossil fuels. U.S. Energy Information Administration.

EWG. 2013. Fossil and nuclear fuels – the Supply Outlook. Energy Watch Group.

Ferroni, F., et al. 2016. Energy Return on Energy Invested (ERoEI) for photovoltaic solar systems in regions of moderate insolation. Energy Policy 94: 336–344

Flavelle, C., et al. 2019. U.S. Nuclear power plants weren’t built for climate change. Bloomberg.

Friedemann A. 2015. When trucks stop running: Energy and the future of transportation. Springer.

Frondel M, et al. 2006. Trends der angebots- und nachfragesituation bei mineralischen rohstoffen. Federal ministry of economics and energy.

GAO. 2010. Rare earth materials in the defense supply chain. U.S. Government Accountability Office.

Graedel TE, et al. 2015. On the materials basis of modern society. U.S. Proceedings of the National Academy of Sciences.

Hageluken C, et al. 2012. Precious Materials Handbook, Ch 1. Hanua-Wolfgang.

Hirsch H, et al. 2005. Nuclear reactor hazards ongoing dangers of operating nuclear technology in the 21st century. Amsterdam: Greenpeace International.

Hoffert MI, et al. 2002. Advanced technology paths to global climate stability: energy for a greenhouse planet. Science 298: 981-987.

HS. 2011. Dams and energy sectors interdependency study. U.S. Department of Energy and Homeland Security.

GTM. 2019. Why Flexible Gas Generation Must Be Part of Deep Decarbonization. Greentechmedia.

Hippel FN, et al. 2016. Reducing the danger from fires in spent fuel pools. Science & Global security 24: 141-173.

House 112-115. 2012. The EMP threat: Examining the consequences. U.S. House of representatives.

House 113-68. 2014. EMP threat to critical infrastructure. U.S. House of representatives.

Hovorka S. 2009. Characterization of bedded salt for storage caverns: case study from the Midland Basin. Tx: Texas Bureau of Economic Geology.

HS. 2011. Dams and energy sectors interdependency study. U.S. Department of Energy and Homeland Security.

IEA. 2017. Bioenergy’s role in balancing the electricity grid and providing storage options – an EU perspective.  International Energy Agency.

Kerr, R. A. March 2, 2012. Is the World Tottering on the Precipice of Peak Gold? Science 335: 1038-1039.

Kerr, RA. February 14, 2014. The Coming Copper Peak.  Science 343:722-724.

Klein G, et al. 2005. California’s water-energy relationship. California Energy Commission.

Lyman E, et al. 2017. Nuclear safety regulation in the post-Fukushima era. Science 356: 808-809.

MacFarlane D. 2018. The Southwest might be in one of the worst mega-droughts in history. Weather.com

Mackay M. 29 Dec 2012. Wind turbines’ lifespan far shorter than believed, study suggests. The Courier.

Makansi J. 2007. Lights Out: The Electricity Crisis, the Global Economy, and what it means to you. Wiley.

Mendick R. 30 Dec 2012. Wind Farm Turbines wear sooner than expected. The Telegraph.

Michaelides EE. 2012. Alternative Energy Sources. Springer.

MISO. 2018. Planning year 2019-2020. Wind & solar capacity credit. Midcontinent Independent System Operator.

Moyer M. 2010. Fusion’s false dawn. Scientific American.

Munson R. 2008. From Edison to Enron: The business of power & what it means for the future of electricity. Praeger 

Navigant. 2013.  U.S. Offshore Wind Manufacturing and Supply Chain Development. U.S. Department of Energy.

NRC. 2008. Minerals, critical minerals, and the U.S. economy Chapter 2. National Academies Press.

NRC. 2013. An Assessment of the Prospects for Inertial Fusion Energy. National Research Council.

NREL. 1983. Wind Energy Resource Atlas of the United States. National Renewable Energy Laboratory.

NREL. 1991. U.S. Solar Radiation Resource Maps: Atlas for the solar radiation data manual for flat plate and concentrating collectors. National Renewable Energy Laboratory.

NREL. 2010. Assessment of offshore wind energy resources for the United States. National Renewable Energy Laboratory, U.S. Department of Energy.

NREL. 2012. Geothermal power and interconnection: The economics of getting to market. National Renewable Energy Laboratory.

NREL. 2013a. Beyond renewable portfolio standards: An assessment of regional supply and demand conditions affecting the future of renewable energy in the west. Golden: National Renewable Energy Laboratory.

NREL. 2013b. Concentrating solar power projects. Colorado: National Renewable Energy Laboratory.

PEBI. 2016. World’s worst pollution problems. The toxins beneath our feet. Pure Earth Blacksmith Institute.

Perlman D. 2014. Livermore Lab’s fusion energy tests get closer to ‘ignition’. San Francisco Chronicle.

Pitron G. 2020. The Rare Metals War: The Dark Side of Clean Energy and Digital Technologies. Scribe US.

PU. Princeton University. 2017. US nuclear regulators greatly underestimate potential for nuclear disaster, researchers say. Phys.org.

Roberts D. 2019. These huge new wind turbines are a marvel. They’re also the future. Vox.

SBC. 2013. Electricity storage. SBC Energy Institute.

SBC. 2014. Hydrogen-based energy conversion. California: SBC Energy Institute.

Scrosati B., et al. 2013. Lithium batteries. Advanced technologies and applications. Wiley.

Shaibani M. 2020. Solar panel recycling: turning ticking time bombs into opportunities. PV magazine.

Stella C. 2019. Unfurling the waste problem caused by wind energy. National Public Radio.

St. John J. 2020. Transmission Emerging as major Stumbling Block for State Renewable Targets. Greentechmedia

Sverdrup HU, et al. 2019. Assessing the long-term global sustainability of the production and supply for stainless steel. Biophysical economics and resource quality.

Temple J (2018) The $2.5 trillion reason we can’t rely on batteries to clean up the grid. Fluctuating solar and wind power require lots of energy storage, and lithium-ion batteries seem like the obvious choice—but they are far too expensive to play a major role. MIT Technology Review.

TWC. Energy use from mining. The World Counts.

UNEP. 2011. Recycling rates of metals. United Nations Environmental Programme.

Vazquez S, et al. 2010. Energy storage systems for transport and grid applications. IEEE Transactions on Industrial Electronics 57(12): 3884.

Veronese K. 2015. The high-stakes race to satisfy our need for the scarcest metals on earth. Prometheus books.

Vikström H. et al. 2013. Lithium availability and future production outlooks. Applied Energy, 110: 252-266.

Wolfson R. 1993. Nuclear choices: a citizen’s guide to nuclear technology.  MIT Press.

Posted in Alternative Energy, Battery - Utility Scale, Peak Critical Elements, Peak Platinum Group Elements, Peak Rare Earth Elements, Peak Resources, Recycle, Recycling, Solar, Wind | Tagged , , , , , , , | 5 Comments

Ugo Bardi’s The Universal Mining Machine

Preface. Below I’ve excerpted some of Ugo Bardi’s “The Universal Mining Machine” (24 January 2008 europe.theoildrum), but I’ve left a great deal out of this excellent article, I encourage you to read all of it if you have time. The biggest problem the world faces is “Peak Diesel”, which is what my book “When Trucks stop running” is about. Bardi points out “that 34% of the energy involved in the US mining industry is in the form of diesel fuel.” Nor are there more minerals to be found: “There is little hope of finding high grade sources of minerals other than those we know already. The planet’s crust has been thoroughly explored and digging deeper is not likely to help, since ores form mainly because of geochemical (especially hydrothermal) processes that operate near the surface.” Alice Friedemann www.energyskeptic.com  author of “When Trucks Stop Running: Energy and the Future of Transportation”, 2015, Springer, Barriers to Making Algal Biofuels, and “Crunch! Whole Grain Artisan Chips and Crackers”. Podcasts: Collapse Chronicles, Derrick Jensen, Practical Prepping, KunstlerCast 253, KunstlerCast278, Peak Prosperity , XX2 report ***

Earth’s mineral resources

The Earth’s crust is said to contain 88 elements in concentrations that spread over at least seven orders of magnitude. Some elements are defined as “common,” with concentrations over 0.1% in weight. Of these, five are technologically important in metallic form: iron, aluminum, magnesium, silicon, and titanium. All the other metals exist in lower concentrations, sometimes much lower. Most metals of technological importance are defined as “rare” and exist mostly as low concentration substituents in ordinary rock, that is, dispersed at the atomic level in silicates and other oxides. The average crustal abundance of rare elements, such as copper, zinc, lead and others, is below 0.01% (100 ppm). Some, such as gold, platinum and rhodium, are very rare and exist in the crust as a few parts per billion or even less. However, most rare elements also form specific chemical compounds that can be found at relatively high concentrations in regions called “deposits”. Those deposits from which we actually extract minerals are called “ores”. The total amount of mineral deposits in the crust is often described as inversely proportional to grade (“Lasky’s law”). That is, low grade deposits are much more common than high grade ones and contain a much larger amount of materials. As a consequence, when the progressive depletions of high grade ores forces the mining industry to move to low grade ores, you have the counter-intuitive effect that the amount of resources available increases (“you don’t run out of resources, you run into them”, as Odell said in 1994). This apparent abundance is one of the reasons for the great optimism of some people about the availability of minerals.

Mining

Mining is a multi-stage process. The first is the extraction phase, in which ore materials are extracted from the ground. Then, there follows the beneficiation stage, where the useful minerals are separated from the waste (also called “gangue”). Further processing stages normally follow; for instance the production of metals requires a reduction stage and a refining one. All these stages require energy. To be exact, we should rather use the concept of “exergy” instead of energy, but in the context of mining the difference is marginal. Let’s make a practical example. Today, we extract copper from ores – mainly chalcopyrite, CuFeS2 – that contain it in concentrations of around 1%-2%. The energy involved in the extraction, processing and refining of copper metal is in the range 30-65 megajoules (MJ) per kilogram (Norgate 2007) with an average value of 50 MJ reported by Ayres (2007). Using the value of 50 MJ, we need about 0,75 exajoules (EJ) for the world’s copper production (15 million tons per year). This is about 0.2% of the world total yearly production of primary energy (400-450 EJ) (Lightfoot 2007). The world’s production of steel alone requires an amount of energy (24 EJ) equivalent to about 5% of the total of the world’s supply (ca. 450 EJ). Since making steel requires coal, this datum is in approximate agreement with the fact that 13% of the world’s coal production goes for steel and that coal accounts for about 25% of the world’s primary energy (source www.worldcoal.org). In addition, cement uses 5% of the world’s coal energy. Taken together, these data indicate that the total energy used by the mining and metal producing industry might be of the order of 10% of the total. This estimation seems to be consistent with that of Rabago et al (2001) who report a 4%-7% range and those of Goeller and Weisnet (1978) of 8.5% for the metal industry in the United States only.

Facing the mineralogical barrier

Over the history of mining, we have extracted minerals from high grade ores exploiting the energy provided for free by geochemical processes of the remote past (De Wit 2005). Ores embed a lot of energy, either generated by the heat of Earth’s core or by solar energy in combination with biological processes. The Earth is a geochemically live planet and the existence of ores and deposits is a consequence of that. But the processes that created ores are extremely rare and ores are a finite resource. The ocean bottom could be a source of minerals (Roma 2003) but so far not a single gram of anything has been extracted from there. The oceans themselves contain metal ions but in extremely minute concentrations. With the possible exception of uranium (Seko 2003), extracting minerals from seawater is out of question. For instance, all the copper dissolved in the oceans would last for just ten years of the present mine production (Sadiq 1992). Finally, there is the old science fiction of dream of mining the Moon and the asteroids. But, if our problem is energy, then we can’t afford the energy cost of traveling there. Besides, the Moon and the asteroids are geochemically “dead” and contain no ores. Therefore, as we keep mining, we have no choice but to move down progressively towards to low grade ores. In general, the energy required for extracting something from an ore is inversely proportional to the ore grade. That is, it takes ten times more energy to process an ore which contains the useful mineral in a ten times lower concentration (Skinner 1979). This relation holds for ores of the same composition which just change in grade. We may also completely run out of a certain kind of ore and have to switch to ores of different chemical composition. That has already happened in the past, for instance for native metals. Iron, for instance, was once found in metallic form, ready to be forged, in the form of meteorites. That source has been completely exhausted as a mineral resource long ago. Switching ore normally involves an upward step in the amount of energy required. The depletion of high grade ores is a problem that, eventually, will lead us to face Skinner’s mineralogical barrier. The amount of minerals on the “other side” of the barrier is huge. If we could manage to extract from this region of concentrations, we wouldn’t have problems of depletion forever or at least for the “7 billion years” that Julian Simon mentioned. However, that would require an amount of energy well beyond our present capabilities. Let’s make an approximate calculation for evaluating this energy. Consider copper, again, as an example. Copper is present at concentrations of about 25 ppm in the upper crust. To extract copper from the undifferentiated crust, we would need to break down rock at the atomic level providing an amount of energy comparable to the energy of formation of the rock. On the average, we can take it as something of the order of 10 MJ/kg. From these data, we can estimate about 400 GJ/kg for the energy of extraction. Now, if we wanted to keep producing 15 million tons of copper per year, as we do nowadays, by extracting it from common rock, this calculation says that we would have to spend 20 times the current worldwide production of primary energy. Prices can’t make common rock a source of rare metals any more than ghost shirts could make Indians invulnerable to bullets. Of course, this is just a rough order of magnitude estimation. We may not need to really pulverize the rock at the atomic level and we may find areas of the crust which contain more copper than average. For instance, Skinner (1979) proposed that we could extract copper from a kind of clay named biotite and that would need a specific energy of extraction approximately ten times larger than the present requirements. If the problem were copper alone, that would be doable. But if we have to raise the energy requirement of a factor of ten for all the rare metals, clearly we rapidly run into levels that we cannot afford, at least at present.

The future of mining

In the short run, we don’t seem to face critical problems in terms of ore supply, at least as long as we can keep our energy supply stable. Let’s consider copper again as an example. The U.S. Geological Survey (USGS) estimates the world copper reserve base at 950 million tons (2007) (although Grassmann and Meyer (2003) report a lower value). If we could keep a steady extraction rate, we would have around 60 years of copper supply. Of course, the extraction rate has never been constant over the extractive history of copper. A more realistic model (Bardi and Pagani 2007) takes into account the growth and decline of the supply and sees the copper production peak in about 30 years from now. However, there are cases where depletion looks like a more pressing problem, such as for indium, a metal important for the electronics industry and that may be in short supply soon. Also, some metals may be facing serious depletion problems because of an increase in the demand. For instance, if we were to use fuel cells on a large scale for road transportation, the known reserves of platinum would be most likely insufficient for the catalytic electrodes. (Department of Transport 2007) These are serious problems, but are marginal in comparison to the real problem we have, which is also much more immediate. Ores, as we said, are defined in terms of the energy necessary for exploitation. To keep mining from the present ore supply, we need at least a constant supply of energy. But, in the near future, our energy supply may go down instead of up. Dwindling energy supply affects all the stages of production of mineral commodities, not just the extraction and beneficiation. That can have immediate and adverse effects on the production of mineral commodities. Today, the energy used in extracting and processing minerals comes mainly from fossil fuels and, in some cases, it is directly dependent on liquid fuels produced from crude oil. For instance, it is reported (DOE 2007) that 34% of the energy involved in the US mining industry is in the form of diesel fuel. Fossil fuels are a mineral resource that has been heavily exploited in the past and they are undergoing rapid depletion and are expected to peak within a few decades at most. Peaking in the production of a mineral resource is a general phenomenon which is related to the increasing costs of extraction and processing as the resource becomes rare and more expensive. [Global peak oil production occurred in 2018] and is expected to start an irreversible productive decline in the coming years. The other two main fossil fuels, natural gas and coal, are expected to peak at a later time, but in the coming decades. We don’t need to wait for the actual production peak to see a resource becoming more expensive both in terms of energy and in monetary terms. If it takes more energy to extract and refine oil, this extra investment in energy will directly affect the extraction processes that make use of oil as an energy source. So, if the present trend of decline in the production of fossil fuels continues, we won’t be able to exploit all the mineral resources that exist on the “good” side of the mineralogical barrier. If nothing changes, in a not far future we are going to see a decline in the production of all mineral commodities: “peak minerals” (See Bardi and Pagani 2007). Peaking of minerals production poses a serious and immediate problem in terms of maintaining a supply of mineral commodities to the world’s economy. Our civilization has deeply changed the chemical composition of the upper crust of the Earth. Elemental deposits that were formed in hundred of thousands of years of geochemical processing (Shen 1997) have been removed, transformed, and in large part dispersed. We inherit from past generations a planet that is very different from what it was before the industrial revolution. The cheap and abundant minerals that our ancestors have used to build the industrial society are no more. In the worst case hypothesis, considering also the likely damage deriving from climate change, the crisis could be so bad that it may push us back to an agrarian society. With the scraps left by our civilization, it would be a metal rich kind of agrarian society, but still a low technology one. Could it ever restart with a new industrial revolution? It is difficult to say. The industrial revolution that we know was strictly linked with the availability of cheap coal and that is gone forever after we burned it. It is hard to run Satanic mills with wood charcoal only; forests tend to run out too fast. Perhaps there will be only one industrial revolution in the history of mankind. References Ayres, R. 2007, Ecological Economics vol. 61, p. 115 – 128 Bardi, U. and Pagani M. 2007, “Peak Minerals”, The Oil Drum, http://europe.theoildrum.com/node/3086 Cohen, D., 2007 “Earth’s natural wealth: an audit”, From issue 2605 of New Scientist magazine, 23 May 2007, page 34-41. http://www.science.org.au/nova/newscientist/027ns_005.htm Commonwealth Government Initiative, 2000, “Industry, Science and Resources Energy Efficiency Best Practice Program” http://www.industry.gov.au/assets/documents/itrinternet/aluminiumsummary… Deffeyes, K., 2005 “Beyond Oil”, Hill and Wang ed., New York Department of transport, 2007 (accessed) “Platinum and hydrogen for fuel cell vehicles” http://www.dft.gov.uk/pgr/roads/environment/research/cqvcf/platinumandhy… De Wit, M. 2005, “Valuing copper mined from ore deposits” Ecological Economics, vol. 55 pp. 437– 443 DOE, Department of Energy, 2007 “Mining Energy Bandwidth Analysis Process and Technology Scope http://www1.eere.energy.gov/industry/mining/pdfs/mining_bandwidth.pdf Goeller, H.E. Weinberg, (1976)”The Age of Substitutability” The American Economic Review, Vol. 68, No. 6. pp. 1-11. Gordon R. B., Bertram M., and Graedel T. E., 2006, “Metal stocks and sustainability”, Proceedings of the national academy of sciences, PNAS, January 31, vol. 103, no. 5, pp. 1209–1214 Hagens, N. 2007, “Climate Change, Sabre Tooth Tigers and Devaluing the Future”, http://www.aspo-ireland.org/index.cfm?page=speakerArticles&rbId=8 JSN – Japan for Sustainability newsletter, 2003 http://www.japanfs.org/en/newsletter/200303-1.html Lightfoot, H.D., 2007, “Understand the three different scales for measuring primary energy and avoid errors”, Energy vol 32 pp. 1478–1483 McNulty, 1994, http://www.goldfever.com/gold_sea.htm Meyer, F. M. & Grassmann, J. (2003) Erzmetall 56, 349–355. Norgate T. E. and Rankin W.J., 2000 “Greenhouse gas emissions from aluminium production – a life cycle approach”, CSIRO paper, www.minerals.csiro.au/sd/CSIRO_Paper_LCA_Al.htm Norgate. T.E. 2001 “A comparative life cycle assessment of copper production processes”, CSiro Minerals Reports DMR 1768 http://www.intec.com.au/docs/media/2001%20Oct-CSIRO%20Life%20Cycle%20Ana… Norgate, T., Rankin, J., 2002 “Tops at Recycling, Metals in sustainable development”, CSIRO sustainability papers, http://www.bml.csiro.au/susnetnl/netwl30E.pdf Norgate T.E., Jahanshahi, S. Rankin W.J. 2007,”Assessing the environmental impact of metal production processes” Journal of Cleaner Production vol 15 pp 838-848 Odell, P.R., 1994, World oil resources, reserves and production. The Energy Journal (IAEE) 15 Special Issue, pp. 89–113. Pickard, W.F., Geochemical constraints on sustainable development: Can an advanced global economy achieve long-term stability? Global and Planetary Change (2007), Roma, P. 2003, “Resources of the sea floor”Science 31 January 2003Vol. 299. no. 5607, pp. 673 – 674 Seko, N. Katakai, A. Hasegawa, S., Tamada, M., Kasai, N., Takeda, H., Sugo, T., Saito, K., 2003 “Aquaculture of Uranium in Seawater by a Fabric-Adsorbent Submerged System” Nuclear Energy Volume 144, Number 2 Pages 274-278 Skinner, Brian J. 1976. “A Second Iron Age Ahead?”American Scientist, vol. 64 (May-June issue), pp. 258-269. Skinner, B. 1979, Proc. Natl. Acad. Sci. USA Vol. 76, No. 9, pp. 4212-4217 Simon, J., 1985, http://www.juliansimon.com/writings/Ultimate_Resource/ Simon, J, 1995, The State of Humanity: Steadily Improving Cato Policy Report, http://www.cato.org/pubs/policy_report/pr-so-js.html United States Geological Survey (USGS). Mineral commodities information, minerals.usgs.gov/minerals/pubs/commodity/ Papp, J.F. 2005 “Recycling Metals”, United States Geological report http://minerals.usgs.gov/minerals/pubs/commodity/recycle/recycmyb05.pdf Rábago, K.R., Lovins A.B., Feiler T.E., 2001 “Energy and Sustainable Development in the Mining and Minerals Industries”, IIED report, http://www.iied.org/mmsd/mmsd_pdfs/041_rabago.pdf Sadiq, M. 1992 “Toxic Metal Chemistry in Marine Environments” Taylor & Francis, ISBN: 0824786475, Shen, H. Fossberg, E. 2003 “An overview of recovery of metals from slags” Waste Management Volume 23, Issue 10,Pages 933-949 Stein, H.J., Cathles, L.M., 1997 “The Timing and Duration of Hydrothermal Events” Bulletin of the Society of Economic Geologists Volume 92 November-December Number 7/8 pp. 763-765, http://www.segweb.org/eg/papers/DurationPreface.htm Wikipedia, 2007 (accessed) “Abundance of the elements” http://en.wikipedia.org/wiki/Abundances_of_the_elements_%28data_page%29
Posted in Mining, Peak Critical Elements, Ugo Bardi | Tagged , , , | 4 Comments

Minerals essential for wind, solar, and high-tech, are anything but clean and green

This is a book review of Pitron’s “The rare metals war”.  To produce the metals and minerals to make a transition to wind, solar, nuclear and so on would be incredibly destructive and polluting. A fifth of China’s arable land is laden with toxic heavy metals from mining and industry.  And huge amounts of CO2 are emitted by the fossils used to mine, smelt, fabricate, and transport the metal ores and extracted metals for these short lifespan devices. They’re rebuildable, not renewable once finite fossil fuels decline.

The U.S. and other nations are frightened that China is the sole provider of many essential minerals, and demanding that rare earth and other mines be opened within our own nation so that we can control them. But so what if the Chinese have cornered the market on many essential minerals as well as vertically to make products from them? Why would we destroy our land, water, and air in doing so?  No doubt because a few people will make billions of dollars for a very short while, leaving toxic mining tailings and mining pits that will pollute water tables and rivers for tens of millennia of future generations.

Related posts:

And there simply aren’t enough minerals on earth to make a transition to “renewables”:

Alice Friedemann  www.energyskeptic.com Women in ecology  author of 2021 Life After Fossil Fuels: A Reality Check on Alternative Energy best price here; 2015 When Trucks Stop Running: Energy and the Future of Transportation”, Barriers to Making Algal Biofuels, & “Crunch! Whole Grain Artisan Chips and Crackers”.  Podcasts: Crazy Town, Collapse Chronicles, Derrick Jensen, Practical Prepping, KunstlerCast 253, KunstlerCast278, Peak Prosperity

***

Pitron G. 2020. The Rare Metals War: The Dark Side of Clean Energy and Digital Technologies. Scribe US.

The solution seems obvious: reopen rare metal production in the United States, Brazil, Russia, South Africa, Thailand, Turkey, and even in the ‘dormant mining giant’ of France. Enter the next predicament: mining these rare minerals is anything but clean! Says Pitron, ‘Green energies and resources harbor a dark secret.’ And he’s quite right: extracting and refining rare metals is highly polluting, and recycling them has proved a disappointment.

We are therefore faced with the paradox that the latest and greatest technology (and supposedly the greenest to halt the ecological countdown) relies mostly on ‘dirty’ metals. Thus, information and communication technologies actually produce 50% more greenhouse gases than air transport!

From the 1970s, we turned our sights to the superb magnetic, catalytic, and optical properties of a cluster of lesser-known rare metals found in terrestrial rocks in infinitesimal amounts. Some of the members of this large family sport the most exotic names: rare earths, vanadium, germanium, platinoids, tungsten, antimony, beryllium, fluorine, rhenium, tantalum, niobium, to name but a few. Together, these rare metals form a coherent subset of some thirty raw materials with a shared characteristic: they are often associated with nature’s most abundant metals.

Eight and a half tonnes of rock need to be purified to produce a kilogram of vanadium; sixteen tonnes for a kilogram of cerium; fifty tonnes for the equivalent in gallium; and a staggering 1,200 tonnes for one miserable kilogram of the rarest of the rare metals: lutecium. On average a kilogram of rock has 120 milligrams of vanadium, 66.5 milligrams of cerium, 19m milligrams of gallioum, & 0.8 of lutecium

a minute dose of these metals emits a magnetic field that makes it possible to generate more energy than the same quantity of coal or oil. So less pollution, and at the same time a lot more energy.

(wind turbines, solar panels, and electric cars) are packed with rare metals to produce decarbonized energy that travels through high-performance electricity grids to enable power savings. Yet these grids are also driven by digital technology that is heavily dependent on these same metals.

Enter the military, which is pursuing its own energy transition. Or strategic transition. While generals are unlikely to lose sleep over the carbon emissions of their arsenals, as oil reserves dwindle they will nevertheless have to consider the possibility of war without oil. Back in 2010, a highly influential American think tank instructed the US army to end its reliance on fossil fuels by 2040 (Parthemore 2010 Fueling the future force). How will they do this? By using renewable energy, and by raising legions of electrically powered robots. These remote-controlled weapons, which can be recharged using renewable-energy plants, would be a formidable destructive force and solve the conundrum of getting fuel to the front line (the plan is small renewable energy plants less vulnerable to attacks see Bardi’s extracted). This form of combat is, in fact, already colonizing new virtual territories: cyber armies alone could win future conflicts by targeting the enemy’s digital infrastructure and altering its telecommunication networks.

China has used barely credible chicanery to position itself as the sole supplier of the most strategic of the rare metals. Known as ‘rare earths’, they are difficult to substitute, and the vast majority of industrial groups cannot do without them.   Most rare earths cannot be substituted. See “Commission to the european parliament, the council… on the 2017 list of critical raw materials for the EU” page 4+ and Annex 1 which has substitution indexes EI/SR

An ecological observation: our quest for a more ecological growth model has resulted in intensified mining of the Earth’s crust to extract the core ingredient — rare metals — with an environmental impact that could prove far more severe than that of oil extraction. Changing our energy model already means doubling rare metal production approximately every 15 years.

At this rate, over the next thirty years we will need to mine more mineral ores than humans have extracted over the last 70,000 years.

The continued existence of the most sophisticated Western military equipment (robots, cyberweapons, and fighter planes, including the US’s supreme F-35 stealth jet) also partly depends on China’s goodwill. This has US intelligence leaders concerned, especially as one high-ranking US army officer states that ‘only war can now stop Beijing controlling the South China Sea’.

By seeking to break free from fossil fuels and turn an old order into a new world, we are in fact setting ourselves up for a new and more potent dependence.

We thought we could free ourselves from the shortages, tensions, and crises created by our appetite for oil and coal. Instead, we are replacing these with an era of new and unprecedented shortages, tensions, and crises.

From tea to black oil, nutmeg to tulips, saltpetre to coal, commodities have been a backdrop to every major exploration, empire, and war, often altering the course of history. (see Bill laws 2010 Fifty plants that changed the course of history)

They are associated with abundant metals found in the Earth’s crust, but in minute proportions. For instance, there is 1,200 times less neodymium and up to 2,650 times less gallium than there is iron.

Every year, 160,000 tonnes of rare-earth metals are produced — 15,000 times less than annual iron production of two billion tonnes. Likewise, 600 tonnes of gallium are produced annually, which is 25,000 times less than the 15 million tonnes of annual copper production.

For almost three centuries we have been working tirelessly at developing new engines with increasingly impressive power-to-weight ratios: the more compact and less resource-intensive they are, the greater their mechanical energy output. Enter rare metals.

Magnets are now — to a vast majority of electric engines — what pistons have been to steam and internal-combustion engines. Magnets have made it possible to manufacture billions of engines, both big and small, capable of executing certain repetitive movements  (Note: note, not all engines have them, i.e. heating, ventilation, air-con. But electric vehicles and some wind turbines have them)

Without realizing it, our societies have become completely magnetized. To say that the world would be significantly slower without magnets containing rare metals is not an understatement. (These super magnets are produced with the rare-earth minerals neodymium and samarium alloyed with other metals, such as iron, boron, and cobalt. Magnets are usually 30% neodymium and 35% samarium. The scientific community refers to them as ‘rare-earth magnets’.

Electric engines did more than make humanity infinitely more prosperous; they made the energy transition a plausible hypothesis. Thanks to them, we have discovered our ability to maximize movement — and therefore wealth — without the use of coal and oil.

That is merely scratching the surface of rare metals, for they possess a wealth of other chemical, catalytic, and optical properties that make them indispensable to myriad green technologies. An entire book could be written on the details of their characteristics alone. They make it possible to trap car-exhaust fumes in catalytic converters, ignite energy-efficient light bulbs, and design new, lighter, and hardier industrial equipment, improving the energy efficiency of cars and planes, and the  semiconducting properties regulate the flow of electricity in digital devices.

Between the ages of antiquity and the Renaissance, human beings consumed no more than seven metals; this increased to a dozen metals over the twentieth century; to twenty from the 1970s onwards; and then to almost all eighty-six metals on Mendeleev’s periodic table of elements.

The potential demand for rare metals is exponential. We are already consuming over two billion tonnes of metals every year — the equivalent of more than 500 Eiffel Towers a day.

By 2035, demand is expected to double for germanium; quadruple for tantalum; and quintuple for palladium. The scandium market could increase nine-fold, and the cobalt market by a factor of 24. (Marscheider-Wiedemann 2016 ‘raw materials for emerging technologies’. German mineral resources agency (DERA), Federal institute for geosciences and natural resources (BGR).

The 10,000 or so mines spread across China have played a big role in destroying the country’s environment. Pollution damage by the coal-mining industry is well documented. But barely reported is the fact that mining rare metals also produces pollution, and to such an extent that China has stopped counting contamination events. In 2006, some 60 companies producing indium — a rare metal used in the manufacture of certain solar-panel technologies — released tonnes of chemicals into the Xiang River in Hunan, jeopardizing the meridional province’s drinking water and the health of its residents. (ft. 2006. Environmental disaster strains China’s social fabric). In 2011, journalists reported on the damage to the ecosystems of the Ting River in the seaside province of Fujian, due to the operation of a mine rich in gallium — an up-and-coming metal for the manufacture of energy-efficient light bulbs.

in Ganzhou, where I landed, the local press recently reported that the toxic waste dumps created by a mining company producing tungsten — a critical metal for wind-turbine blades — had obstructed and polluted many tributaries of the Yangtze River.

There is nothing refined about mining. It involves crushing rock, and then using a concoction of chemical reagents such as sulphuric and nitric acid. ‘It’s a long and highly repetitive process,’ explains a French specialist. ‘It takes loads of different procedures to obtain a rare-earth concentrate close to 100 per cent purity.’ That’s not all: purifying a single tonne of rare earths requires using at least 200 cubic metres of water, which then becomes saturated with acids and heavy metals. (2016 Dwindling supplies of rare earth metals hinder China’s shift from coal). Will this water go through a water-treatment plant before it is released into rivers, soils, and ground water? Very rarely.

As rare metals have become ubiquitous in green and digital technologies, the exceedingly toxic sludge they produce has been contaminating water, soil, the atmosphere, and the flames of blast furnaces

Today, China is the leading producer of 28 mineral resources that are vital to our economies, often representing over 50% of global production. It also produces at least 15% of all mineral resources, other than platinum and nickel.   

Ten per cent of its arable land is contaminated by heavy metals, and 80 per cent of its ground water is unfit for consumption. Only five of the 500 biggest cities in China meet international standards for air quality,

The Pascua Lama example inspired the entire Latin American mining sector. Large-scale lithium mining

now sparks environmental activism. As with any mining activity, it requires staggering volumes of water, diminishing the resources available to local communities living on water-scarce salt flats.

Extracting minerals from the ground is an inherently dirty operation. The way it has been carried out so irresponsibly and unethically in the most active mining countries casts doubt on the virtuous vision of the energy and digital transition. A recent report by the Blacksmith Institute identifies the mining industry as the second-most-polluting industry in the world, behind lead-battery recycling, and ahead of the dye industry, industrial dumpsites, and tanneries (2016 the world’s worst pollution problems, the toxics beneath our feet). It has moved up one rung since the 2013 rankings, in which the much-maligned petrochemical industry doesn’t even crack the top ten.

We need to be far more skeptical about how green technologies are manufactured. Before they are even brought into service, the solar panel, wind turbine, electric car, or energy-efficient light bulb bear the ‘original sin’ of its deplorable energy and environmental footprint. We should be measuring the ecological cost of the entire lifecycle of green technologies.   

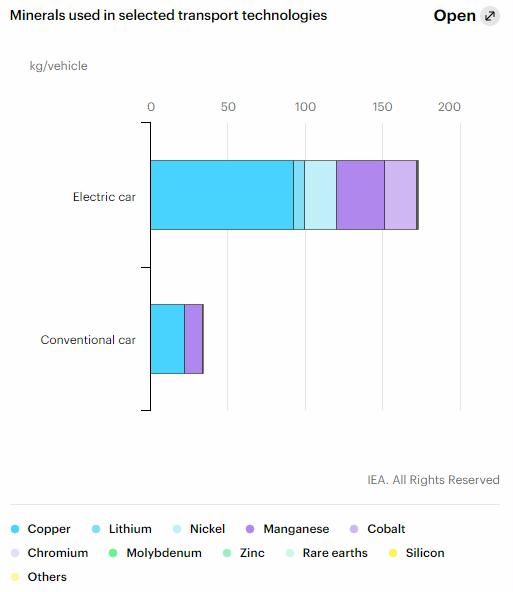
Comparing the carbon impact of a conventional fuel-driven car against that of an electric car, Aguirre (2012) found that the production of the supposedly more energy-efficient electric car requires far more energy than the production of the conventional car. This is mostly on account of the electric car’s very heavy lithium-ion battery.

Then there’s the composition of the lithium-ion battery: 80 per cent nickel, 15 per cent cobalt, 5 per cent aluminum, as well as lithium, copper, manganese, steel, and graphite. (2016 Extraordinary raw materials in a Tesla Model S’ Visual capitalist).

Industrializing electric vehicles is three to four times more energy-intensive than industrializing conventional vehicles.

The caveat of this research is that it was conducted on a medium-sized electric-vehicle battery with a 120-km range in a market that is growing so fast that none of the cars being rolled out today have a range below 300 km. According to Petersen, a battery that is powerful enough to drive a vehicle for 300 km emits twice as much carbon as production-phase emissions — a figure we can then triple for batteries with a 500-km range. Therefore, over its entire lifecycle, an electric car may produce as much as three-quarters of the carbon emissions produced by a petrol car.

John Petersen’s conclusion? Electric vehicles may be technically possible, but their production will never be environmentally sustainable.  This concurs with similar research conducted along the same lines. The 2016 report by the French Environment & Energy Management Agency (ADEME) finds: ‘The energy consumption of an electric vehicle [EV] over its entire lifecycle is, on the whole, similar to that of a diesel vehicle.

Digital technology requires vast quantities of metals. Every year, the electronics industry consumes 320 tonnes of gold and 7,500 tonnes of silver; accounts for 22 per cent (514 tonnes) of global mercury consumption; and up to 2.5% of lead consumption. The manufacture of laptops and mobile phones alone swallows up 19% of the global production of rare metals such as palladium, and 23% of cobalt. This excludes the other forty or so metals, on average, contained in mobile phones.

This is just the tip of the iceberg, for the energy and digital transition will require constellations of satellites — already promised by the heavyweights of Silicon Valley — to put the entire planet online. It will take rockets to launch these satellites into space; an armada of computers to set them on the right orbit to emit on the correct frequencies and encrypt communications using sophisticated digital tools; legions of super calculators to analyze the deluge of data; and, to direct this data in real time, a planetary mesh of underwater cables, a maze of overhead and underground electricity networks, millions of computer terminals, countless data-storage centers, and billions of tablets, smartphones, and other connected devices with batteries that need to be recharged.

Feeding this digital leviathan will require coal-fired, oil-fired, and nuclear power plants, windfarms, solar farms, and smart grids — all infrastructures that rely on rare metals.

Unlike traditional metals such as iron, silver, and aluminum, rare metals are not used in their pure state in green technologies. Rather, the manufacturers in the energy and digital transition are increasingly partial to alloys, for the properties of several metals combined into composites are far more powerful than those of one metal on its own. For example, the combination of iron and carbon gives us steel, without which most skyscrapers would not be standing. The fuselage of the Airbus A380 is in part composed of GLARE (Glass Laminate Aluminum Reinforced Epoxy), a robust fiber–metal laminate with an aluminum alloy that lightens the aircraft. And the magnets contained in certain wind turbine and electric vehicle motors are a medley of iron, boron, and rare-earth metals that enhance performance.

Alloys need to be ‘dealloyed’ to be recycled.  Manufacturers have to use time-consuming and costly techniques involving chemicals and electricity to separate rare-earth metals from other metals.

Metals in Japan’s waste dumps are hidden treasures that no economic model today can retrieve. It is the prohibitive cost of recovering rare metals — a cost that currently exceeds their value — that is holding industry back. The price of recycled metals could be competitive were it not for the fact that commodity prices have been structurally low since the end of 2014.

For manufacturers, there is little point in recycling large quantities of rare metals. Why rummage through e-waste dumps when it is infinitely cheaper to go straight to the source? It is not surprising, therefore, that only 18 of the 60 most used industrial metals have a recycling rate above 50% (aluminum, cobalt, chrome, copper, gold, iron, lead, manganese, niobium, nickel, palladium, platinum, rhenium, rhodium, silver, tin, titanium, zinc).

An additional three metals have a recycling rate over 25% (magnesium, molybdenum, iridium), and three more a rate of over 10% (ruthenium, cadmium, tungsten). The recycling rate of the remaining thirty-six metals is below 10 per cent (UNEP 2011 Recycling rates of metals: a status report. United nations).  For rare metals such as indium, germanium, tantalum, and gallium, as well as certain rare-earth metals, the rate is between 0 and 3 per cent.

Even recycling nearly 100% of lead has not been enough to stop its mining and extraction, because of perpetually growing demand.

‘Green’ technologies require the use of rare minerals whose mining is anything but clean. Heavy metal discharges, acid rain, and contaminated water sources — it borders on being an environmental disaster. Put simply, clean energy is a dirty affair.

While Europe produced nearly 60% of the world’s heavy metals in 1850, its momentum steadily declined to produce no more than 3% today. Mining production in the US hasn’t fared any better: after peaking in the 1930s, accounting for close to 40% of global production, it now represents around 5%.

The United States, when they realized after the Second World War that their own oil reserves would not be enough to meet their growing energy needs, turned to the Kingdom of Saudi Arabia and its extraordinary crude oil reserves. The ‘Quincy Pact’, signed on 14 February 1945 between President Roosevelt and the Saudi king, Ibn Saud, gave Washington privileged access to Riyad’s petroleum in exchange for military protection.

There are many more examples of export restrictions, as observed by the Organization for Economic Co-operation and Development (OECD). Its most recent report on trade in raw materials gives an inventory of all basic product export restrictions declared around the world, and identifies 900 such cases between 2009 and 2012.

Trump took the Chinese policy of slapping quotas on rare metals exports to reignite — and amplify — resource sovereignty across five continents. ‘China galvanized the nationalism of resources,’ says an American expert, ‘not only on its own territory, but all over the world.’ From that point, it was no longer a question of if new trade crises would occur, but rather when they would occur.

We know that an electrical charge coming into contact with the magnetic field of a magnet generates a force that creates movement. Traditional magnets made out of the iron derivative ferrite needed to be massive to generate a magnetic field powerful enough for more sophisticated applications

By orchestrating the transfer of magnet factories, the Chinese accelerated the migration of the entire downstream industry — the businesses that use magnets — to the Baotou free zone. ‘Now they’ve moved onto producing electric cars, phosphors, and wind turbine components. The entire value chain has moved!’  This makes Baotou much more than just another mining area. The Chinese prefer to call it the ‘Silicon Valley of rare earths’. The city hosts over 3,000 companies, fifty of which are backed by foreign capital, manufacture high-end equipment, and employ hundreds of thousands of workers who generate revenues of up to €4.5 billion every year.

Thus, rare-metal restrictions did more than serve China’s sporadic embargos. The second stage of its offensive is far more ambitious: China is erecting a completely independent and integrated industry, starting with the foul mines in which begrimed laborers toil, to state-of-the-art factories employing high-flying engineers. And it’s perfectly legitimate. After all, the Chinese policy of moving up the value chain is not dissimilar from the viticulture strategy of winemakers in the Napa Valley in California, or the Barossa Valley in South Australia. As one Australian expert put it, ‘The French don’t sell grapes, do they? They sell wine. The Chinese feel like rare earths are to them what vineyards are to the French.’

Industrial robots require terrific amounts of tungsten. China has always produced this rare metal in abundance, but there are other tungsten mines around the world, ensuring supply diversity for manufacturers.

During the 1990s, the Chinese machined their own cutting tools — ‘Some hammers, a few drills … really crumby tools,’ said an Australian consultant. But they wanted to move up the value chain in this area as well. ‘They drove down tungsten prices [from 1985 to 2004], hoping that Westerners concerned about getting their raw materials at the best price would buy exclusively from the Chinese, and that competing mines would shut down.’ We can guess what could have happened next: the Middle Kingdom — now the hegemonic power in tungsten production — would have used the same blackmail tactic to force the Germans to move their factories as close as possible to the raw materials. The Chinese would have crushed any German lead in the cutting-tools industry, and would then have made off with the machine-tools segment — a pillar of the Mittelstand.

The Germans saw the Chinese coming, and aligned instead with other tungsten producers (Russia, Austria, and Portugal, among others). ‘They preferred paying more for their resources to sustain the alternative mines and not depend on the Chinese

By now a pattern is emerging, and it is being applied to molybdenum and germanium, a journalist I met in Beijing told me. Lithium and cobalt should go the same way. ‘They’re using the same industrial policy for iron, aluminum, cement, and even petrochemical products,’ warned a German industrialist. In China, there is even talk of applying this policy to composite materials — new materials resulting from alloys of several rare minerals.

The West is starting to put words to what has happened with China: whoever has the minerals owns the industry. Our reliance on China — previously limited to raw materials — now includes the technologies of the energy and digital transition that rely on these raw materials.

Bangka is the world’s biggest producer of tin — a grey-silver metal essential to green technology and modern electronics, such as solar panels, electric batteries, mobile phones, and digital screens. Every year, over 300,000 tonnes of tin are mined around the world. Indonesia represents 34% of global production, making it the biggest exporter of this high-tech mineral, which is nevertheless not considered rare. The archipelago recognized the value of this outstanding mineral: from 2003, as a spokesperson for one of Indonesia’s biggest mining houses, PT Timah, explained: ‘Tin became the first mineral to be used in an embargo.’ It would be the first of a very long series of embargos. From 2014, all of Indonesia’s mineral resources — from sand to nickel, and diamonds to gold — were no longer exported in raw form. As explained by Indonesian authorities, ‘The minerals we don’t sell now will be sold tomorrow as finished products.’

As in China, this policy was a powerful way to generate wealth. By some calculations, preserving the added value in this way quadrupled profits on iron, increased profits on tin and copper sevenfold, bauxite profits by a factor of as much as eighteen, and nickel profits by as much as twenty.

The reality is that China’s definition of indigenous innovation is reworking and adjusting imported technologies to develop its own technologies. ‘The plan is considered by many international technology companies as a blueprint for technology theft on a scale the world has never seen,’ a US report published in 2010 asserted. It continued: ‘With these indigenous innovation industrial policies, it is very clear that China has switched from defense to offense.’ The Chinese applied this very tactic to rare-earth magnets: it enticed — or forced — foreign businesses onto its territory under the guise of joint ventures, and then launched a process of ‘co-innovation’ or ‘re-innovation’.

This is how China purloined the technologies of Japanese and US super-magnet manufacturers. Having reaped the benefits of the invention of others, Beijing built an ecosystem of endogenous creation to ‘move from factory to laboratory’, starting with a variety of research programs that began in the early 1980s.

China has many weaknesses: relative to its population size, it has far fewer researchers than France or the UK; there remain colossal challenges to education; while rural China — a massive part of the country — is sidelined from this momentum.

Some of China’s characteristics do little to aid its cause. While an interventionist regime may have allowed a strategic state to flourish, it leaves no room for any deviation. How can an administration that employs two million government agents to restrict online freedom of expression encourage creativity? A government that stymies the freedom to criticize — and therefore to think differently — nurtures a potent culture of copying, and turns the lack of inventiveness into a building block.  ‘The Chinese have the technology, but they are stuck in an organizational and intellectual logic that dates back to 1929,’ concluded a former Western diplomat posted to Beijing.

No one could have imagined what happened next,’ admits a European journalist based in Beijing. China’s astounding progress in the electronics, aerospace, transport, biology, machine tools, and information technology sectors caught everyone off guard — including the upper realms of the Communist Party. In aerospace, China has already put a robot on the moon, and it plans to send an astronaut as well by 2036. In 2018 alone it launched some 37 space missions, dethroning Russia as the US’s main competitor in the new space race. Beijing wants to move beyond the demand side of new technologies by trading its status of being a skills consumer for that of a skills supplier. In 2018, China filed a staggering 1.4 million patents — more than any other country in the world.

It wants to explore the still-unknown properties of rare earths to develop the applications of the future. Some of its university research programs are advanced enough to both astonish and alarm a researcher at the US Department of Defense: ‘Losing our supply chain was tragic enough. But now China is busy getting a ten-year head start on us. We could easily find ourselves without the intellectual property rights of the applications of the future that matter the most.’

Beijing has already designed a stealth fighter jet more advanced than that of its Japanese rivals. From 2013 to 2018, the most powerful super computer on the planet came from China. This earned China the title of ‘the leading IT power globally’. It has also put into orbit the first quantum communications satellite with reputedly impregnable encryption technology.

Donald Trump succeeded in reaching the White House because he could count on the voters in the de-industrialized states of the Rust Belt. In these swing states, where votes can tip the result of a national election, the Republican candidate vigorously denounced the anti-competitive practices of the Chinese and offshoring, and emphasized the need to protect the US from the industrial war spearheaded by Beijing.

Around the twelfth century BC, in the south of modern-day Turkey, the Hittites melted an even lighter and more widely available metal — iron — to forge weapons that were more powerful and easier to wield. This, say some historians, led ultimately to the European conquest of the Americas. Then came steel, which in 1914 tipped Europe into an industrial war. The iron and carbon alloy was used to make shell casings, the first modern fragmentation grenades, hardier helmets for soldiers, and armored tanks — all of which contributed to the bloodbath that was the First World War.

Every time a people, civilization, or state masters a new metal, it leads to exponential technical and military progress — and deadlier conflicts. Now it is rare metals, and in particular rare earths, that are changing the face of modern warfare.

The premise of the Sixteen-Character Policy was pragmatic: given the difficulty in procuring war technologies due to the US arms embargo, China would buy foreign companies whose know-how in civil applications could be repurposed for more hostile ends. In the years that followed, this strategy would lead to an extraordinary proliferation of Chinese espionage against the US. According to a former US counterintelligence agent, ‘China’s intelligence services are among the most aggressive [in the world] at spying on the US.’ A European researcher explained that Beijing’s interest was in two technologies in particular: those used in network-centric warfare, allowing armies to use information systems to their advantage; and smart bombs, containing the very magnets produced by Magnequench.

Nicknamed the ‘aircraft carrier killer’ and operational since 2010, the DF-21D has been central to Beijing’s policy of prohibiting access to the South China Sea these past few years. Having control over this strip of ocean running from its coasts to the south of Vietnam would increase China’s strategic leverage, and give it access to prodigious quantities of offshore hydrocarbon resources, as well as an eye on the comings and goings of half the world’s oil. This scenario is unacceptable to Japan, South Korea, Vietnam, and the Philippines, but especially to the US, which several years ago planned to position 60% of its warships in the Pacific by 2020. Barely a week goes by without a naval incident of some sort, making the territory the powder keg that could ignite a Sino-American conflict.  Beijing’s capability in advanced ballistic technologies has already shifted the balance of power in the South China Sea.

Wouldn’t the US be vulnerable against an adversary that is also the source of its most critical defense components? And would China not take timely advantage of this dependence, either by playing the rare-earths card during trade negotiations, or by hampering America’s military efforts?

The US Department of the Interior has identified no less than 35 minerals considered critical to the country’s national security and economy.

Another broader question of national security that the US has asked itself time and again: how does it prevent the infiltration of Trojan horses in the microchips and other semi-finished goods containing rare metals sold by the Chinese around the world, including to Western armies? A 2005 report by the Pentagon even raised the possibility of electronic systems that are used extensively in US weapons being infected by malware that could disrupt combat equipment mid-operation.

Digital technologies, the knowledge economy, green energies, electricity logistics and storage, and the new industries of space and defense are diversifying and expanding our need for rare metals exponentially. Not a day goes by that we don’t discover a new miracle property of a rare metal, or unprecedented ways of applying it.

By 2050, keeping up with market growth will take ‘3,200 million tonnes of steel, 310 million tonnes of aluminium, and 40 million tons of copper’.

Indeed, wind turbines guzzle more raw materials than previous technologies: ‘For an equivalent installed capacity, solar and wind facilities require up to 15 times more concrete, 90 times more aluminum, and 50 times more iron, copper, and glass than fossil fuels or nuclear energy.’ According to the World Bank, which carried out its own study in 2017, the same applies to solar and hydrogen electricity systems, which ‘are in fact significantly more material intensive in their composition than current traditional fossil-fuel-based energy supply systems’.  

We will consume more minerals than in the last 70,000 years, or five hundred generations before us. Our 7.5 billion contemporaries will absorb more mineral resources than the 108 billion humans who have walked the Earth to date.

Just as we have a list of threatened animal and plant species, we may soon have a red list of metals nearing depletion. At the current rate of production, we run the risk of exhausting the viable reserves of 15 or so base and rare metals in under 50 years (antimony, tin, lead, gold, zinc, strontium, silver, nickel, tungsten, bismuth, copper, boron, fluorite, manganese, selenium); we can expect the same for five additional metals (including currently abundant iron, rhenium, cobalt, molybdenum, rutile) before the end of the century.   Surprising critical materials 2017 (in French probably)

In the short to medium term, we are also looking at potential shortages in vanadium, dysprosium, terbium, europium, and neodymium (2013. Critical metals in the path towards the decarbonization of the EU energy sector. Joint research centre of the European commission).

What if climate change drastically reduces the water reserves needed to extract and refine minerals?

China is ready to stockpile what it produces — for itself. It already consumes three-quarters of the rare earths it extracts — despite being the sole supplier — and, given its appetite, it may well use up all of its rare earths by 2025 to 2030. The output of any of China’s future rare metals mines inside or outside its borders will not go to the highest bidder, but will be taken off the market and channeled to Chinese clients only.

A lack of mining infrastructure. ‘It takes 15 to 25 years to get a mine up and running, from the moment we say “Let’s do it” to the time we start extracting minerals,’ explained an expert. But according to some projections, a new rare-earths mine will need to be opened every year from now until 2025 to accommodate growth needs. Any delay will cost us dearly in the next two decades. ‘We do not produce enough metals today to meet our future needs,’ stated an American specialist. ‘The numbers just don’t add up.

Lastly, the energy return on investment (EROI) — the ratio of the energy needed to produce metals to the energy generated using the same metals — is against us. Extracting one to five grams of gold requires crushing one tonne of rocks — up to 10,000 (times?) more rocks than the metal itself,

Rare metals require increasing amounts of energy to be unearthed and refined.  Producing these metals takes 7 to 8 per cent of global energy (UNEP 2013 Environmental risks and challenges of Anthropogenic metals flows and cycles: a report of the working group on the global metal flows)

Ugo Bardi (extracted) writes that, in Chile, ‘The energy required to mine copper rose by 50% from 2001 and 2010, but the total copper output increased just 13% … The US copper mining industry has also been energy hungry.  The limits to mineral extraction are not limits of quantity; they are limits of energy.

For the same amount of energy, mining companies today extract up to 10 times less uranium than they did 30 years ago — and this is true for just about all mining resources. 

Countries are therefore striking up new alliances for rare metals exploration: Tokyo and Delhi have concluded an export agreement for rare earths mined in India; Japan has deployed its rare-earth diplomacy offensive in Australia, Kazakhstan, and Vietnam; Chancellor Angela Merkel has made numerous trips to Mongolia to sign mining partnerships; South Korean geologists have made official their discussions with Pyongyang on the joint exploration of a deposit in North Korea; France is carrying out prospecting activities in Kazakhstan; Brussels has engaged in economic diplomacy to encourage mining investment with partner states; and in the US, Donald Trump has expressed his interest in buying Greenland — rich in iron, rare earths, and uranium (Cilizza. 2019.  5 questions about Donald Trump’s interest in buying Greenland, answered. CNN)

It is a new world that China wants to fashion to its liking, as corroborated by Vivian Wu: ‘Given the growth of our domestic demand, we will not be able to meet our own needs within the next five years.’ Beijing has therefore begun its own hunt for rare metals, starting in Canada, Australia, Kyrgyzstan, Peru, and Vietnam.

Many observers believe that Beijing was manipulating prices. ‘The Chinese do absolutely whatever they want on the rare-earths market,’ deplored Christopher Ecclestone. They can decide to stockpile just as they can decide to slash prices by flooding the market. It has become a headache for non-Chinese mining companies to design long-term economic models with a behemoth like China intentionally destabilizing the market. How can they escape bankruptcy when mineral prices are five to ten times lower than forecasted?

The vast majority of alternative projects that emerged after the embargo have been scuppered. The Californian mine Molycorp went bankrupt and reopened, but then had to export its minerals to China for processing due to a lack of adequate refinery facilities. The Lynas mine in Australia has long been running at a reduced speed, and is being kept afloat by Japan out of its refusal to eat from the hand of its sworn enemy. In Canada, entire battalions of mining companies have shut their doors. Mining licenses — once worth their weight in gold — now go for no more than a few hundred dollars.

When Beijing doesn’t manage to hamper operations, it deploys a strategy of acquiring competing mines. Despite the Chinalco group expressing interest in buying the Mountain Pass mine in California, it was acquired in 2017 by MP Mine Operations LLC — a consortium whose investors include a Chinese mining group, Shenge Resources Shareholding Co. Ltd. China also barges its way into the partial ownership of competing companies: in Greenland, the same group acquired a sizeable stake in the operations of the Kvanefjeld site, rich in rare earths and uranium. What better way to build up economic intelligence and possibly undermine the emergence of a serious rival? It’s as if Saudi Arabia, which holds the largest proven reserves of oil worldwide, took it upon itself to control the oil reserves of the now thirteen members of OPEC.

When China is not undermining the capitalistic foundations of alternative mines, it takes diplomatic action to torpedo them. Such is the case of Kyrgyzstan: the chairman of Stans Energy accused China of putting pressure on the Kyrgyz president to withdraw the Canadian mining house’s operating licence without any valid reason.

An environmental nonprofit organization in the US has listed a staggering 500,000 abandoned mines (NYT 2015 When a river runs orange). According to the Environmental Protection Agency, ‘Mining pollutes approximately 40% of the headwaters of Western watersheds and … cleaning up these mines may cost American taxpayers more than $50 billion.

They condemn the effects of the very world they wish for. They do not admit that the energy and digital transition also means trading oilfields for rare metals deposits, and that the role of mining in the fight against global warming is a reality we have to come to terms with.

As for the entire rare metals industry, the Government Accountability Office in the US believes it would take at least 15 years to rebuild the industry. (US GAO warns it may take 15 years to rebuild U.S. Rare Earths Supply Chain. Mineweb. 2010).  While Western countries wait …, their mining culture is wasting away. Training is insufficient, and young people are no longer drawn to careers in geology. As the last of the talents disappear, there is a real risk that the sector’s revival may be decades in the making.

Relocating our dirty industries has helped keep Western consumers in the dark about the true environmental cost of our lifestyles, while giving other nation-states free rein to extract and process minerals in even worse conditions than would have applied had they still been mined in the West, without the slightest regard for the environment.

The effects of returning mining operations to the West would be positive. We would instantly realize — to our horror — the true cost of our self-declared modern, connected, and green world. We can well imagine how having quarries ‘in our backyard’ would put an end to our indifference and denial, and drive our efforts to contain the resulting pollution. Because we would not want to live like the Chinese, we would pile pressure onto our governments to ban even the smallest release of cyanide, and to boycott companies operating without the full array of environmental accreditations.

We would protest en masse against the disgraceful practice of the planned obsolescence of products, which results in more rare metals having to be mined, and we would demand that billions be spent on research into making rare metals fully recyclable.

Perhaps we would also use our buying power more responsibly, and spend more on eco-friendlier mobile phones, for instance. In short, we would be so determined to contain pollution that we would make astounding environmental progress and wind back our rampant consumption. Nothing will change so long as we do not experience, in our own backyards, the full cost of attaining our standard of happiness.

Some countries have even resorted to subterfuge: China has gone as far as building artificial islands in the South China Sea so that it can claim exclusive use of the surrounding marine territory.

The exponential growth of our need for rare metals will increasingly commoditize the world’s backwaters, which have long been spared from humanity’s greed. But it will be decades before mining in the ocean becomes technically and ecologically possible.

References

Aguirre K, et al. 2012. Lifecycle analysis comparison of a battery electric vehicle and a conventional gasoline vehicle. UCLA institute of the Environment & Sustainability.

PEBI. 2016. World’s worst pollution problems. The toxins beneath our feet. Pure Earth Blacksmith Institute.

RealClearEnergy. 2017. Cost of Elon Musk’s dream much higher than he and others imagine.

FURTHER READING

‘The Asia-Pacific Maritime Security Strategy: achieving US national security objectives in a changing environment’, US Department of Defense, 2015

Grasso, Valerie Bailey. 2013. Rare earth elements in national defense: background, oversight issues, and options for congress. Congressional research service.

USGS. 2018. Interior releases 2018’s final list of 35 minerals deemed critical to U.S. national security and the economy.

Manchin, Capito. 2019. Reintroduce rare earth element advanced coal technologies act. U.S. Senate committee on Energy & natural resources.

UNEP. 2013. Environmental risks and challenges of anthropgenic metals flows and cycles. United Nations environment program.

IEA. 2014. World energy outlook 2014 factsheet: power and renewables.

Petersen. 2016. How large lithium-ion batteries slash EV benefits.

VIDEO: Guillaume, Pitron “Rare earths: the dirty war” 2012

                Miodownik, BBC 2017 “secrets of the super elements”

Rare Earth & Platinum-group metals are used in many products:

  1. Magnets (Neodymium, Praseodymium, Terbium, Dysprosium, Samarium): Motors, disc drives, MRI, power generation, microphones and speakers, magnetic refrigeration
  2. Metallurgical alloys (Lanthanum, Cerium, Praseodymium, Neodymium, Yttrium): NimH batteries, fuel cells, steel, lighter flints, super alloys, aluminum/magnesium
  3. Phosphors (Europium, Yttrium, Terbium, Neodymium, Erbium, Gadolinium, Cerium, Praseodymium): display phosphors CRT, LPD, LCD; fluorescent lighting, medical imaging, lasers, fiber optics
  4. Glass and Polishing (Cerium, Lanthanum, Praseodymium, Neodymium, Gadolinium, Erbium, Holmium, Baryte): polishing compounds, decolorizers, UV resistant glass, X-ray imaging
  5. Catalysts (Lanthanum, Cerium, Praseodymium, Neodymium, ruthenium, rhodium, palladium, osmium, iridium, platinum): petroleum refining, catalytic converter, diesel additives, chemical processing, industrial pollution scrubbing
  6. Other applications:
  • Aerospace: Beryllium
  • Aluminum production (fluorspar), alloys (Magnesium, Scandium)
  • Catalytic converters (Cerium)
  • Cathode-ray tubes (Gadolinium, Terbium, Yttrium)
  • Ceramics (Fluorspar)
  • Computer chips (Indium)
  • Defense (Neodymium, Praseodymium, Dysprosium, Terbium, Europium, Yttrium, Lanthanum, Lutetium, Scandium, Samarium)
  • Drilling oil and gas (Baryte)
  • Electric vehicles (Niobium) electric motors (Samarium)
  • Electronics and electricity (Tungsten)
  • Fertilizers
  • Fire retardants (Antimony)
  • Fiber optics (Germanium, Erbium)
  • Fuel cells (SOFC use lanthaneum, cerium, prasedymium)
  • Healthcare (Baryte, Erbium)
  • Hybrid engines (Dysprosium)
  • Integrated circuits (silicon metal)
  • Lasers (Europium, Holmium, Ytterbium)
  • LCD screens (Indium)
  • Lenses (Lanthanum)
  • Light-emitting diodes (LEDs) (Gallium)
  • Lighting (Lanthanum, Samarium, Europium, Scandium)
  • Luminescent compounds (Promethium)
  • Metallurgy and alloys (Baryte, Cerium)
  • Nuclear power (Europium, Gadolinium, Cerium, Yttrium, Sm, Erbium, Beryllium, Niobiumm /sanaruyn)
  • Oil refinery (Cerium)
  • Optics (fluorspar)
  • Phones, computers, hybrid vehicles, magnets (Cobalt)
  • Photovoltaic cells (Germanium, silicon metal)
  • Pigments
  • Satellites (Niobium)
  • Semi-conductors (gallium, Holmium)
  • Solar panels: copper, indium, gallium, selenide (CIGS) solar cells
  • Steel production (coking coal, fluorspar, vanadium, Ytterbium)
  • Superconductors (high-temperature) Bismuth, Thulium, Yttrium
  • Superconductive compounds (Lanthanum)
  • Telecommunications and electronics (Beryllium)
  • Thermoelectric auto generators (Bismuth)
  • Water Treatment
  • Wind turbines (7 of 10 most powerful: V164 by Vestas, AD-180 & ADS-135 by Adwen, SWT 8.0 Siemens, 6 MW Haliade General Electric, SCD 6.0 Ming Yang, & Dong Fang/Hyundai 5.5 MW)
Posted in Battery - Utility Scale, Mining, Peak Critical Elements, Peak Rare Earth Elements, Peak Resources, Photovoltaic Solar, Recycle, Recycling, Wind | Tagged , , , , | 1 Comment