Preface. Since this blog focuses on peak resources, I drastically rearranged my notes from this book in the order I found most interesting. I’m also interested in corruption, Putin, fake news, and more, as you’ll see below. Since the book is 405 pages, I’ve obviously left out quite a bit, so buy it if you want to know more and much better flow and continuity.
Although peak oil is often spoken of as a geological issue, it can also stop flowing from wars, financial crashes, and in Russia’s case, from corruption.
By the way, Russia isn’t communist any more. It is a mafia totalitarian state. The only 5 nations that are still “communist” are North Korea, China, Cuba, Vietnam, and Laos.
Alice Friedemann www.energyskeptic.com author of “When Trucks Stop Running: Energy and the Future of Transportation”, 2015, Springer, Barriers to Making Algal Biofuels, and “Crunch! Whole Grain Artisan Chips and Crackers”. Podcasts: Collapse Chronicles, Derrick Jensen, Practical Prepping, KunstlerCast 253, KunstlerCast278, Peak Prosperity , XX2 report
***
Russia Peak Oil &
Corruption
Putin had decided that Russia would be a
petro-state—choosing an economic future for his country that best served his
own needs. Oil and gas could be wielded as an international cudgel to force
other countries to respect and deal with Russia no matter anything else Russia
did. The industry also—bonus!—trailed enough easy cash to generate almost
instant, almost limitless corruption wherever needed. And when you have those
kinds of goals in mind for your one indispensable industry, and you run that
industry like a Mafia chop shop with less omertà, eventually the actual
business side of your dark little authoritarian scheme is going to suffer. Both
financially and in its basic technical competence. And indeed, by 2014, the
bright red star of Russian energy was dimming.
Putin used Russian natural gas and oil not only to
make money for the Russian state but also to keep neighboring countries corrupt
and dependent. It solved so many problems. It reduced expectations for
democratic governance and the rule of law in those countries. It created a
corruptly empowered political class invested in preserving the Russia-dependent
system that enriched its practitioners and their families. It also created
comfortable space for organized crime to flourish. The Russian government,
under Putin’s control, has steadily become more integrated with all kinds of
transnational organized crime in the former Soviet sphere. The beauty of Putin’s ever-deepening kinship
with the mob was that it gave him a whole other set of levers with which to
settle problems—and to make problematic people go away—whenever it might be
unseemly to wield the overt powers of the state.
There were substantial problems in 2012, and almost
all of them of Putin’s making. Gazprom, for instance, wasn’t really able to
keep up with all the new European demand, because its production capabilities sucked.
The company hadn’t invested in new technologies, because as a state-sanctioned
monopoly propped up by the Russian government and therefore free from
competition, it really hadn’t needed to. Dig deep enough in the company
accounting ledgers and you’d find that Gazprom lost about $40 billion a year to
corruption and waste. That’s a loss nearly equal to its annual profits.
Why was the state gas company buying TV stations?
Well, why not? Gazprom was better understood not as an energy company but as a
big battering ram President Putin used to get stuff he wanted. So yes,
inefficient, money-bleeding, crappy Gazprom owned a television station and a
bunch of other media properties, but only because Putin had arranged it in order
to silence one of the few remaining critical voices in the Russian press.
Vladimir used his security forces to arrest and to intimidate the critic who
owned the media company, and then he used Gazprom as the piggy bank to buy the
company at a steep jailhouse discount. Independent television journalism in
Russia was thus dealt another blow, and Putin would instead have another
reliable mouthpiece for the Kremlin’s party line.
For pure waste, though, little in the Gazprom history
measured up to the Nord Stream gambit. “We’re spending money like hell,” said
Managing Director Matthias Warnig, an old pal of Putin’s from their spy days.
Nord Stream was a pipeline project that was built from both sides at once—from
Russia and from Germany. Same pipeline, same materials, same building
standards. But the Russian side of the construction project (led by the
Rotenberg brothers of St. Petersburg, and remember them) cost three times as
much, per mile of pipeline, as the German side did. That money was not going
into the pension and health fund of the Russian pipe fitters’ union; it went
into the pockets of Putin and his pals. The founder of Grant’s Interest Rate
Observer, James Grant, sized up Gazprom and rated it, simply, “the worst
managed company on the planet.” Congratulations, citizens of Russia, that’s the
hash your government managed to make of the globe’s biggest supplies of natural
gas.
Putin had been gangstering up the Russian oil industry
for years. Eschewing competition that might encourage innovation and meritocratic
success, Putin instead just smashed and grabbed any homegrown enterprises that
proved resourceful or entrepreneurial or attractive to legitimate
investors—goodbye, Yukos. He harassed foreign interlopers, too. He invented a
dubious environmental violation bill of attainder, to force Shell Oil to hand
over controlling interest to Gazprom in a $20 billion project in the far east
of Russia.
Wheel of Fortune. Putin
and the Russians “have essentially been coasting on the assets inherited from
the Soviet Union,” Gustafson explained in talks promoting his book back in
2012. “Virtually all of Russian oil comes from fields that were already known
in Soviet times. There have been very few new discoveries that are producing
today. The drama of this situation is that the inheritance is now starting to
run down….
It might have been dawning on Putin, under that bright
red Lukoil canopy in New York in September 2003, that in allowing Russian
businessmen—even patriotic Russian businessmen—to do business with ExxonMobil
and BP and Chevron and Shell, he risked losing his iron grip on the industry that
provided the lifeblood of the Russian state.
There was still plenty of oil and gas underfoot in
Russia. But it was in the tight shale formations, or offshore in the Arctic
seas, and it was going to be both difficult and expensive to get. “Bottom
line is Russia is not running out of oil, but it’s running out of cheap oil,”
explained Gustafson. “That looks pretty bleak….
More Corruption
The country, meanwhile, has eroded into a stultifying
economic sinkhole for average Russians. “Despite receiving $1.6 trillion from
oil and gas exports from 2000 to 2011, Russia was not able to build a single
multi-lane highway during this time. There is still no interstate highway
linking Moscow to the Far East,” Karen Dawisha wrote in her richly detailed
2014 book, Putin’s Kleptocracy. “The inability of well-trained young graduates
to succeed as entrepreneurs and innovators in Russia has stimulated emigration
and plans to emigrate.” Dawisha went on to quote a pollster in Moscow on the
plight of young Russians: “They have nowhere to go, nothing to do, and nothing
to hope for.” “The lack of adequate medical care produces five times more
deaths from cardiovascular disease among women in Russia than in Europe,” the
professor wrote. “More Russian women die annually from domestic violence than
the number of soldiers the USSR lost in the entire Afghan war. For Russian men,
the situation is even grimmer. Poor workplace and road safety standards, plus
high rates of suicide and homicide combine with the negative health effects of
high alcohol consumption to make life especially precarious….According to the
World Health Organization, the life expectancy of a fifteen-year-old male is
three years lower in Russia than in Haiti.
Russia under Putin has become warped and stunted—a
gigantic multi-continental country of 150 million souls, living on an economy
considerably smaller than Italy’s.
When the Resource Curse takes hold in a country as big
and influential and aggressive as 21st century Russia, it turns out
to be the entire world’s problem. What has happened to Russia is like when a
faraway humanitarian concern morphs from a charity cause into an international
terrorism threat. Russia’s Resource Curse has become a malignant tumor
spreading through the rest of the world.
But as Putin’s Russian Federation revealed itself to be a
robustly corrupt, authoritarian regime happily committed to securing its own
survival by force, it repeatedly and increasingly put itself into rogue state
territory, and that ultimately screwed up its ability to play in the global
markets as if it were some kind of normal country. Putin’s best-known
exports list has lately comprised the most dreaded organized crime syndicates
on earth, money laundering on such a massive industrial scale that it can bring
down whole national cornerstone banks in any part of the globe, exotic
assassinations, rogue-state-friendly weapons systems, illegal out-of-uniform
military incursions, and the first seizure of another country’s territory in
Europe since World War II. That sort of activity can get in the way of a
country’s global business operations, on the odd chance that there’s anyone on
the face of the globe who sees it as their responsibility to punish and isolate
the kinds of international bad actors that invade their neighbors, shoot down
civilian airliners, and send intelligence officers armed with nerve agent to
assassinate their exiles in British cathedral towns.
If the problem is that Russia’s behavior is too outré to
be accepted in the global economy, then change the expectations for what counts
as outré. Be the leveler. Corrupt other countries. Gain control over the former
Soviet states in the near abroad by owning their politicians, by controlling
the range of possibilities their people are allowed to choose for themselves.
Ruin exemplars of governance and responsive democracy. Support separatism and
the dissolution of bonds and treaties and Western norms wherever they’re
vulnerable. Become internationally powerful through force (when you can muster
it) or sabotage. Cheating is now Russia’s most viable avenue in world affairs.
This is the vexing predicament facing the Kremlin:
Putin’s thug dream of resurgent Russian dominance—fueled by oil and gas—is one that
can’t come true without international help to make his one indispensable
industry capable of competing in the global market. And he can’t get that
international help as long as he’s recognized as a gangster and treated like
one.
So as of 2015, Putin faced a rapidly diminishing ability
to use oil and gas as a substitute for legitimate global power, and no way
forward without some kind of move—any move, no matter how nutty—to get those
sanctions lifted and to relieve Russia of the burden of U.S.-led opprobrium and
global Western leadership. It was worth trying almost anything.
As Special Counsel Mueller and reporters throughout
Europe and America have made clear, the Russian Federation ultimately embarked
on a deliberate and aggressive campaign to tear apart Western alliances, to rot
democracy, and to piss in the punch bowl of free elections all over the
civilized world. It continues to this day. And Putin isn’t doing this because
of Russia’s strength. Not according to people who have watched the action up
close. Russia “gives the impression that I am a lion who walks through the
world hitting France with one paw, with the other Britain and America,” says
Romanian security expert Dan Dungaciu. “But it is not a lion. It is rather in
the role of a hyena, which senses a crisis and goes there and plays on the
crisis.
Russian fake news and interference
in 2016 election
it’s clear that jobs at Internet Research were coveted.
Most of the hundreds of young people who worked at 55 Savushkina made around
$700 a month; under the table, in cash. No need to report it to the tax
authorities. This was very good money indeed for playing make-believe on your
computer, twelve hours a day (two days on, two days off). The salary was equal
to that of a full professor at a local university
Most all of the fun at Internet Research was in creating
personas that could comment and blog and post and tweet and network with people
anywhere in the world: a European fortune-teller who opined on dating, dieting,
crystals, and feng shui; a young professional woman who unleashed bons mots
about Kim Kardashian’s latest nekkid selfie; a specialist in vintage automobile
repair living on a sunny coast in Central America; a movie critic in Los
Angeles. “It was an opportunity for them to live a life they always dreamed
about and to pretend to be somebody else,
“They can be a gorgeous knockout. They can be
bodybuilders. They can live in any part of the globe. In America. They could
live the life they’ve always wanted to live—through the internet.
The Internet Research Agency was engaged in constant,
rapid-response-driven information warfare. Speaking to co-workers was frowned
upon. Talking about the work to anybody outside the building was forbidden. The
nondisclosure form was the first thing a new employee signed. Show up late and
you were docked pay. Fall short on the quota of work and you were docked pay.
The folks on the social media teams were expected to produce five political
posts, ten nonpolitical posts, and more than 150 comments every two days.
Without fail.
The topics and tenor of the political content were
decided at the top, every day. “We’d come in, turn on a proxy server to hide
our real location and then read the technical tasks we had been sent,” an
Internet Research Agency employee explained to The Guardian in March 2015. Most
of the technical tasks the previous year, as the agency was getting its sea
legs, centered on Ukraine—looking for ways to justify Putin’s invasion and
takeover of Crimea and his ongoing military effort to do the same in the
Donbas. Daily tasks called for savaging the new democratically elected, pro-EU,
pro-U.S., anti-Russian government in Kyiv. They were fascists, anti-Semites,
baby killers. Ukrainians fighting in their own country against out-of-uniform
Russian soldiers and artillery and tanks were invariably described as “terrorists.”
The more shocking the fake stories about heinous atrocities committed by the
Ukrainians against the Russian “freedom fighters” in the Donbas, the better.
In the first days of March 2015, immediately following
the assassination of the Putin critic Boris Nemtsov, technical task orders
spurred hundreds of posts and tweets pointing fingers at Ukraine for the
murder. It wasn’t Putin but the government in Kyiv that had killed Nemtsov! How
does that even remotely make sense? Oh, follow along, why don’t you. See, the
Ukrainians killed him as an exercise in reverse psychology. Shooting Nemtsov on
the night before his big antiwar march was designed to stir up anti-Putin
opposition in Russia! Killing an anti-Putin leader—that’s obviously a plot
against Putin. “The murder is pure provocation….The state is doing everything
to catch Nemtsov’s murderers….[Putin’s] best specialists have been sent to
fulfill this goal.” There was no evidence, no hint of corroboration, to back up
this nonsensical claim. Which means you just have to make it more loudly and
more frequently.
And it wasn’t just about shaping the response to real
events that people would normally be talking about. The Internet Research
Agency spread word of stories and ideas and characters that would otherwise not
get a second glance if it weren’t for the artificial hype its employees were
churning out on a twenty-four-hour no-rest double-shift schedule. The morning
after Foreign Minister Nathan Smith (Texas National Movement) gave his
interview across town in St. Petersburg, Internet Research trolls were tasked
to weigh in on the momentous secession crisis facing the Lone Star State.
Dozens of tweets and social media posts started popping up, ready to be shared
and retweeted, all across America. And in not particularly bad English.
Internet Research soon set up its own Facebook page
promoting secession—and it was a hit! “Heart of Texas” drew followers by the
tens of thousands, all of whom could be spoon-fed content devised by Russian
agents in St. Petersburg and in turn pass it on to who knows how many Facebook
friends and Twitter followers. “Heart of Texas” was one of scores of separate
IRA-controlled Facebook pages
They had to get up to speed on American culture and
politics, and specifically the most contentious and divisive issues of the
day—immigration, gun laws, race, the Confederate flag. They had to spend hours
screening one slightly cartoonish but very popular political series on Netflix.
“At first we were forced to watch the ‘House of Cards’ in English,” said one of
the trolls who worked at IRA in 2015. “It was necessary to know all the main
problems of the United States of America. Tax problems, the problem of gays,
sexual minorities, weapons. Our goal wasn’t to turn Americans toward Russia.
Our goal was to set Americans against their own government. To provoke unrest,
provoke dissatisfaction.
We also know that the Kremlin-run trolls at the
Internet Research Agency were actively spewing incendiary provocations and
content designed to promote Donald Trump leading up to, and all the way
through, the 2016 general election campaign, and then through the start of the
Trump administration. Content created by the Internet Research Agency and its
brethren is known to have reached well over a hundred million Americans in the
election season. The IRA greatest hits Facebook pages were “Stop A.I.”
(meaning “All Invaders,” complete with many graphics of scary-looking Muslims),
“Being Patriotic,” “Blacktivist,” and “Heart of Texas.” Each of those pages got
more than eleven million discrete engagements.
African American voters—the bread and butter of the
Democratic base vote—appear to have been targeted more aggressively than any
other demographic, to turn them against Clinton or to dissuade them from voting
altogether. “A particular hype and hatred for Trump is misleading the
people and forcing Blacks to vote Killary,” said the IRA-invented Woke Blacks.
“We cannot resort to the lesser of two devils. Then we’d surely be better off
without voting AT ALL.
The IRA-created United Muslims of America posted an ad
that read, “American Muslim voters refuse to vote for Hillary Clinton because
she wants to continue war on Muslims in the middle east and voted yes for
invading Iraq.” An official-sounding but fake “TEN_GOP” account—often
assumed to be registered to the Republicans’ state party in Tennessee—shouted
out a make-believe story about the election board in Broward County illegally
counting tens of thousands of fraudulent mail-in ballots marked for Hillary.
As the election neared, the Internet Research Agency pros
turned both rhetorical barrels on Hillary Clinton. If the Democratic nominee
won the presidency, a “Heart of Texas” Facebook ad screamed two weeks before
the election, there would be no choice but to secede. Because another Clinton
in the White House would mean “higher taxes to feed undocumented aliens. More
refugees, mosques, and terrorist attacks. Banned guns. Continuing economic
depression.
They found the most ragged faults and fissures in our
democracy: immigration, race, religion, economic injustice, mass shootings.
Then they poured infectious waste into them. They used traditional media,
social media, and disinformation to try to make citizens of differing
experiences and viewpoints hate and distrust each other as much as possible;
made public discourse and discussion as evil and mean-spirited and alienating
as possible; created miserable expectations for coarseness and cruelty and
blatant dishonesty in politics and civic life.
The Russian operation pushed American politicians and
political parties to more and more extreme positions; it celebrated all manner
of fringe, splinter, and radical politics and demonized centrists, moderates,
and anybody on any point of the ideological spectrum who actually believed the
levers of government could be harnessed for anything useful at all. And his
achievement came cheap. A thousand—ten thousand—highly trained Illegals
chatting up middle managers at conferences and dead dropping their expense
forms could never have pulled off something this high-impact. This new type of
operation was infinitely more effective, and bargain-basement affordable, and,
because it worked, the blowback has been minimal. At basically zero cost,
Putin succeeded in his biggest aim: he corrupted and polluted our most
treasured possession, our democracy.
Tillerson and Russia
Russia was dependent on foreign know-how in oil and
across the board for that matter, as can be seen in how few inventions were patented
there, Russia took home only 0.2 percent of the 1.3 million overseas patents
awarded since 2000 by the U.S. Patent and Trademark Office, lagging behind the
state of Alabama in total annual awards.
Rosneft sucks. It
wasn’t as if it got big and powerful by streamlining its supply chains and
inventing stuff. Rosneft sucks all the time, but especially lately,
when—because of sanctions against Russia for its terrible international
behavior—it no longer has access to all that nifty Western Arctic- and
shale-drilling technology it needs to reap that increasingly hard-to-get
Russian oil.
Russia’s economic future therefore depends on Putin making
deals with major international oil and gas companies who can be counted on to
understand his imperatives and to not care at all about ethics and governance
and geopolitical consequences of their cozying up to the Kremlin. Those kinds
of deals aren’t just beneficial to the Russian economy; they’re critical
necessities for Putin’s one-track plan for twenty-first-century Russia. And it
turns out that as long as Putin is honoring the “sanctity of contract” and
implementing friendly tax laws, industry leaders from the West have shown
little hesitation in making those deals. That’s the business part.
Here comes the hero. Here comes the handsome hero. Aside from being the possessor of impressive
(and very valuable) technological prowess—or so it was said—Tillerson had shown
himself a savvy strategist, both in business and in geopolitics. Why was Exxon
(under Tillerson) welcomed with a bear hug when Shell and BP and even Exxon
(before Tillerson) had all been roared at and given such a hard time? Well, for
one, Tillerson was not making boneheaded Lee Raymond–esque demands about
getting majority control of Rosneft; Rex made clear—in word and in deed—that he
was fine with Putin staying in charge; he just wanted to be a good minority
partner. He also seemed dialed in to the foreign policy game afoot in Russia.
In the ExxonMobil-Rosneft megadeal, ExxonMobil was giving
as well as it was getting. Rosneft received 30% stakes in a handful of
ExxonMobil’s projects in North America, from Alberta, Canada, to the Gulf of
Mexico. In exchange, ExxonMobil was getting a crack at unlocking all that
hard-to-get oil and gas in the tight formations in Siberia, in the Black Sea,
and, most important and most difficult, in the Arctic waters of the Kara Sea.
The up-front costs would be enormous. The project could be on line for more
than twenty years. Total spending might well run into the hundreds of billions.
The arctic in 2008, “accounts for about 22% of the
undiscovered, technically recoverable resources in the world. The Arctic
accounts for about 13% of the world’s undiscovered oil, 30% of the undiscovered
natural gas, and 20% of the undiscovered natural gas liquids.” A lot of that
potential hydrocarbon haul—maybe most of it—resided in Russian territory. But
it wasn’t going to be easy to get,
What the Russians brought to the oil and gas game north
of the Arctic Circle in 2012 was sheer brute force. Which was much needed.
Almost any maritime operation in the Arctic promised a punishing battle against
the harshest nature can offer. The Northern Sea Route from Murmansk, Russia (up
near the northern coast of Finland), through the Barents Sea, the Kara Sea, the
East Siberian Sea, the Chukchi Sea, and out through the Bering Strait was
navigable only a few months a year because of ice.
Americans like to think the dueling-superpower thing
ended conclusively with the Cold War, with the United States now the undisputed
winner in every conceivable matchup between the two countries. But in ice
water? Turns out Russia still ruled. In 2011, a tanker chartered by Russia, the
STI Heritage, made the quickest Northern Sea Route run of that year—just eight
days—with two nuclear-powered, fresh-vegetable-producing icebreakers clearing
the way. Russian-escorted tankers filled with tens of thousands of tons of
iron, jet fuel, and gas condensate had made the Arctic transit more than thirty
times that year. The Russian Federation was already writing big checks to
manufacture four even larger and more powerful icebreakers to lead the fleet.
Three of them double-reactor nuclear. Which meant the Russians would be able to
plow out to offshore Arctic drilling sites and to deliver crude oil and liquid
natural gas from that icy domain to almost any country in the world, for years
to come.
But here was the problem: despite its unrivaled
ice-busting prowess, Russia didn’t bring much to the actual offshore drilling
operations in the frozen north. Russian companies, for instance, offered little
in the way of useful drilling rigs or equipment of any kind—not even basics
like subsea wellheads. In 2012, having made Russia’s economy and its power in
the world almost entirely dependent on oil and gas, Putin faced a serious
conundrum: his ability to maintain Russia’s place as an “energy superpower”
depended almost entirely on availing himself of the expertise and technology of
major Western oil companies. Russia had oil companies, sure, but they were
gangster economy creations, and not one of them was technically or even
financially competent.
They all wanted in, of course. The potential profits were
ginormous. But success in the Russian Arctic would require overcoming two very
difficult challenges. First, some Western oil major would have to figure out
the proper care and feeding of Vladimir Putin, given the desperately high
stakes of oil and gas for his presidency. Look at the ashes of Yukos; look at
the chewed-up remains that Putin and Sechin spit out from what used to be BP’s
“joint venture” in the country. This was going to be a delicate thing. What
Western company would be willing to put itself in service to the Russian
government, in service to Putin? Whose shareholders, whose home country, would
stand for it? Which executives could stomach making that kind of arrangement? And then there was the second difficult
prospect for this potential partnership. No one much liked to talk about it.
But, um, were the Western oil majors actually capable of drilling up in the
Arctic? They said they were, but could they really do it?
Exxon had in fact sunk a ton of money into this
potentially globally transformational project. It could change Exxon’s future,
and Russia’s, and the world’s. One immediate problem it faced, though, was the
weather in the Arctic. The Exxon-Rosneft team had a window of about 70 days
before the ice floes closed in on the drilling platform.
Tillerson’s efforts on behalf of President Putin to lift
sanctions after his invasion of Ukraine were not merely secondhand, or sotto
voce. At a public forum that spring, Rex insisted rather churlishly that
sanctions were rarely effective—because they were, as a rule, poorly
implemented. Tillerson was apparently not at all concerned that he might be
undermining a critical and very delicate U.S. foreign policy strategy, that
threats of economic isolation from the U.S. government would not be quite so
worrisome to Putin if the head of the biggest U.S. oil company was
simultaneously jumping into his lap. He just kept jumping. Tillerson assured
his shareholders at ExxonMobil’s annual meeting that the upcoming drilling
campaign in the Russian Arctic was still a go.
Introduction
Thank God for Russia. Thank God for the honeypot of known
oil reserves in western Siberia, not to mention the vast untapped reserves off
Russia’s Arctic shelf. Lukoil had five Arctic-ready, icebreaking oil tankers on
order at that very moment
There was already a plan afoot, worked out among the
energy pooh-bahs of the Bush and Putin administrations. U.S. companies would
help finance a new pipeline from the oil fields in western Siberia to the
Russian port city of Murmansk, as well as new storage tanks there and improved
deep-water facilities commodious enough for big tankers to maneuver in and out.
Putin thought that Russia could be supplying 10% of U.S.
oil imports before George W. Bush finished his second term in office. Maybe
more. “It’s not just oil,” Bush’s deputy secretary
of energy had said on a reconnaissance visit to Murmansk. “Natural gas is also
going to be an important factor in our energy relations.
The future U.S. ambassador to Moscow Michael McFaul—was
just beginning to take the measure of the new Russian president and had already
warned of the risk that Putin would evolve into an autocrat who monopolized
control of government and the economy behind the window dressing of democratic
institutions.
Hopes for a world-changing American-Russian
partnership—the canopy to protect us all from the vagaries of the international
and political weather—have long since crumbled. As has the idea of Vladimir
Putin as a force for global stability.
His efforts to restore Russia as a world-stage
superpower no longer depend on capacity and know-how. They depend on cheating.
Putin and his minions cheat at the financial markets. They cheat at the
Olympics. They cheat at their own fake democracy. They cheat other people out
of their democracies.
I do not propose to discount or minimize the powerful and
positive effects the producers of our hydrocarbons have had on our own country
and on the world at large. I like driving a pickup and heating my house as much
as the next person, and the through line between energy and economic growth and
development is as clear to me as an electric streetlight piercing the black
night.
I also want to be clear: the oil and gas industry is essentially
a big casino that can produce both power and triumphant great gobs of cash,
often with little regard for merit. That equation invites gangsterism,
extortion, thuggery, and the sorts of folks who enjoy these hobbies.
Russia’s one essential industry today has to keep up even
with the West, even with the democracies. Putin knows Russia can’t do it alone,
but it also won’t do it together—not if it has to be on the West’s terms. And
so the West’s terms must be changed. Behold the new world disorder. Behold the
foreign trolls in your Facebook feed.
How Putin rose to power
Yeltsin did manage to install his own replacement on
his way out of office: a little-known pol who appeared both willing and able to
shield the Yeltsin family from criminal prosecution—forty-seven-year-old Vladimir
Putin. A trained Soviet KGB operative then heading its successor outfit, the
FSB, Putin had done the sitting Russian president the memorable favor of
successfully derailing the criminal investigation into the Yeltsin clan. He did
so by blackmailing Russia’s prosecutor general with a fake sex tape. Putin made
sure the grainy tape of an actor playing the prosecutor general and two
prostitutes (playing themselves) was broadcast on Russian television. The poor
quality of the video rendered it unconvincing, but Putin made an appearance at
the TV studio that night to personally vouch for the tape’s authenticity. His
word sufficed.
The prosecutor resigned, and the case against Yeltsin
was abruptly closed. Yeltsin had rewarded the FSB boss’s intrepidity by nominating
him to be the next prime minister. So when Yeltsin stepped aside on the final
day of the twentieth century, Vladimir Putin was the next man up for the
Russian presidency
Putin and his security-minded retinue had learned a few
tricks for exercising power after branching off from spying into politics to
run Russia’s second city, St. Petersburg, in the early 1990s. Like the
Yeltsin-made oligarchs, they found that democracy and capitalism, harnessed
just so, could still deliver personal benefits just like the old communist
regime did. Putin’s team installed and managed a vigorous kleptocracy from
their offices at city hall. The citizens of St. Petersburg might suffer
from want of food and electricity and decent wages, but Deputy Mayor Putin and
his key aides made out splendidly.
Putin’s St. Petersburg clan relied on graft, financial
manipulation, and violence as needed. There was no government or civil
institution powerful enough to check them. The courts and the legal system were
not instruments of justice in siloviki hands but instruments of power, or
vlast. “For my friends, everything; for my enemies, the law,” the saying went.
Putin and his siloviki carried these tools from St. Petersburg to Moscow in
1996 (at Yeltsin’s invitation)
The Russian people got a less soothing picture of exactly
what Putin meant to accomplish in the days leading up to his inauguration, when
a leading liberal newspaper in Moscow published the secret siloviki manifesto
Reform of the Administration of the President of the Russian Federation. The
document was tidy, easy to understand, and uncommonly forthright. Control
over the economy and politics would once again devolve to a central authority,
that is, the president’s office. The legislature of the Russian Federation, the
Duma, would be rendered impotent, as would local governors, administrators, and
politicians—no matter how seemingly friendly. Key media outlets would be bought
and controlled by the Russian government, to help provide “active agitation and
propaganda” in support of Putin, and to actively discredit and undermine any
opposition to the same. Who would be in charge of the state’s new modern
adventure in securing permanent, unitary, unchallenged power? The institution
Putin most trusted: the FSB. “All of the special and secret activities of the
Directorate relating to counteracting the forces of opposition to the
President,” read the manifesto, “will be entirely in the hands and under the
control of the special services.
The toughest nut for Putin to crack when he first took
office was the question of the oligarchs Yeltsin left behind (and their
powerful gangster counterparts). A few months into his new regime, President
Putin called them all, including Khodorkovsky, to a meeting at Stalin’s old
dacha just outside Moscow, still outfitted with the desk and daybed from which
Stalin dreamed up his Great Purge of enemies and elites. With that unsubtle
setting as an ambient cue, Putin laid down the new law, or more precisely, the
new balance of vlast. They could hold on to their ill-gotten gains, Putin told
them, and operate as they had for the last decade, as long as they offered no
opposition to the new regime in the Kremlin.
All this might have been forgiven, considering the
extraordinary tax revenue Yukos was adding to the Russian government till (as
much as 5% of the annual government take, according to Gessen), but Putin
believed by then that Khodorkovsky was also in the middle of entering into a
pact that was something near treason. It wasn’t just the noise about promoting
anti-Putin political parties; it was worse: Putin learned he was negotiating
the deal with Lee Raymond and Raymond’s number two, Rex Tillerson, that would
give ExxonMobil 30% of Yukos—a deal that might one day permit the American
company to gain controlling ownership of the most able and impressive company
in the single crucial industry in Russia. Russia might not have been a
superpower anymore, it might not have had a first-world military or economy or
anything else anymore, but by God Russia had oil. And now Russia was supposed
to willingly give that up, too? The thought, to Vladimir Putin, must have been
somewhere between nauseating and enraging. Khodorkovsky’s great meritocratic
free-market ride came to a screeching halt.
J. P. Morgan joined Morgan Stanley as one of the four
joint global coordinators and book runners while Goldman Sachs signed on as a
senior co–lead manager. To put it bluntly, Rosneft’s IPO campaign ended up
making the world complicit in Putin’s theft of Yukos and spread the shame of it
around the globe. The markets knew the Russian government had ripped off that
company and framed its leader, flat out stealing billions from Yukos
shareholders. But Morgan Stanley and the markets and the investors in those
markets chose to look the other way because the potential payoff was too
enticing.
Putin could imagine the world lining up to pay
respects at his doorstep, according to The New York Times, in spite of his
gangster behavior and in spite of the fact that the Russian oil and gas industry
he controlled was known for its “tumbledown” machinery and technological
deficiencies. “President Vladimir V. Putin has elevated energy to a central
position in Russia’s foreign policy,” the newspaper wrote in 2006, “giving
Moscow influence and respect in world affairs not seen since the demise of the
Soviet Union, as consuming nations court the Kremlin for access to ever scarcer
energy.
Oil Corrupts
The basic problem is that oil doesn’t happily coexist
with other industries upon which you might build a reasonably stable national
economy. That’s true in the third world, the first world, and even in the world
in between, e.g. Russia. It creates such large, up-front, sweat-free gains for
connected elites that no one wants to do anything else but chase the oil
jackpot. And as oil crowds out other industries, the profits don’t ever seem to
end up redounding to the nation at large. Extracting oil takes a lot of
up-front capital investment, but that expensive initial, physical investment
doesn’t create anything utile for any other purpose.
Oil extraction is much more capital-intensive than it is
labor-intensive—which means it doesn’t produce a lot of lasting jobs.
Even with less rapacious political elites, there’s still
the baseline problem that oil is a tradable commodity subject to wild
international winds; with big swings in the price of oil, any effort at
long-term, sane budgeting and investment for the population’s basic needs is
impossible in a country newly dependent on oil revenues for its cash.
Russia’s power and wealth
comes from oil and gas
While the median household in the oil exporter Norway
enjoyed an income of more than $50,000, and Saudi Arabia about $25,000, the
median household income in Russia was less than $12,000. Oil exporters such as
Algeria, Venezuela, Qatar, Kuwait, and of course Saudi Arabia held back enough
crude that their citizens at least got fuel at rock-bottom prices. Russians
received no such break. And even if a Russian could afford an entire tank of
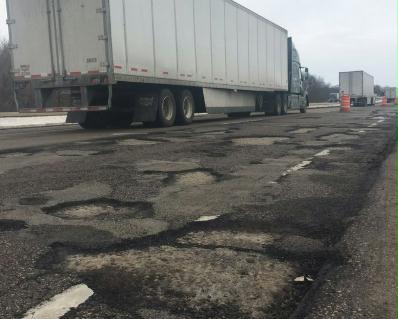
full-price petrol, the state of the roads made driving dicey. A trip on any of
the major thoroughfares connecting Moscow’s international airport to downtown
was an obstacle course of potholes.
At a state visit in Berlin in September 2005, Putin
persuaded the German chancellor, Gerhard Schröder, to sign on to a partnership
to build a new 750-mile pipeline under the Baltic Sea to carry Gazprom gas into
Germany. Gazprom would then take large ownership stakes in the new Nord Stream
pipeline and new storage facilities across Europe. The European Commission
nodded in approval of Nord Stream, especially after proposals to extend the
pipeline into the Netherlands, Britain, Sweden, and Finland. News of the deal
came as a relief to Western Europe, where natural gas reserves were dwindling
so fast there was fear they’d be entirely depleted in five years. Europeans
desperately wanted and needed that plentiful Russian gas to heat their homes
and run their factories.
On New Year’s Day 2006, Putin offered Europe a little
demonstration of just how vital was his proposed new pipeline and just how
desperate things could get if it went unbuilt. That day, as the frigid
season was setting in across Europe, Gazprom made sudden drastic cuts in its
supply of gas into Ukraine, which at that time held the only extant pipelines
from Russia into the rest of Europe. Ukraine predictably siphoned off the gas
it needed from the supply transiting through its landscape into other European
countries. Gas deliveries into Austria dropped by a third the next day; gas
deliveries to Hungary fell by 40% on the day following. Slovakia, also down 40%,
declared a national emergency. Industrial output in Bulgaria and Romania ground
to a stop. While these and other European nations shivered in panic, the
Russians pointed the finger at Ukraine for stealing the natural gas bound for
them, and insisted Gazprom customers could not rely on Ukraine to play fair
with EU-bound gas. By the time the Russians made peace with Ukraine and turned
the spigot back on, the new Nord Stream (which bypassed the allegedly pilfering
Ukrainians entirely) was the talk of Europe.
By the time the Nord Stream project broke ground in 2010,
Team Putin had proposed a second and longer pipeline, South Stream, which would
carry gas from Russia across the Black Sea and then as far as Austria and
Italy. Nord Stream had been on line for almost six months in March 2012, when
Putin won a third presidential term. Russia was supplying the European Union
40% of its natural gas imports while cutting Ukraine out of the deal.
Gazprom supplied every single cubic meter of imported natural gas up the line
to EU members Bulgaria, Slovenia, Slovakia, Latvia, Estonia, and Finland. It
supplied about a third of Germany’s natural gas imports (as well as a third of
its oil imports). Add to that, Russia had completed a new pipeline for pumping
oil into China, the country with the fastest-growing economy and the
fastest-growing energy needs
To discerning eyes in 2012, a map of the two pipelines
transiting much of the continent appeared like a pair of giant pincers with
which Russia would squeeze Europe.
More Russian corruption
Putin’s record $12 billion Winter Games budget had
ballooned to $50 billion, according to the report. This made the final price
tag for Sochi the biggest ever for an Olympic Games, winter or summer. Almost
ten times the cost of the immediately previous 2010 Vancouver Games. More than
the cost of the previous 21 Winter Olympics combined. Nemtsov generously
pointed out that major budgetary overruns are the rule in these projects.
Vancouver’s final bill, for instance, was a little more than double the
original estimate. But that was nothing like what happened in Sochi. The cost
of constructing the new thirty-mile highway and rail line leading from the
Black Sea into the snowy mountains had run to more than three times the cost of
the recent American space program to send a rover to the planet Mars (which is 34
million miles away). A new natural gas pipeline, built by the same
Kremlin-favored Russian company that had built the inexplicably expensive
Russian side of the Nord Stream pipeline, came in at five times the average
cost of a European pipeline. Labor costs did not account for any markups. Pay
was lousy and spotty on every project. Workers who complained aloud were
silenced with firings or even beatings.
Kremlin contractors simply imported foreigners who
were willing to work 80-hour weeks and didn’t whine when their lousy,
$2-an-hour wages were delayed or never paid. Putin’s builders had pocketed
somewhere between $25 billion and $30 billion in “embezzlement and kickbacks. More than 90 percent of the money spent on
the Games came right out of the Russian Federation’s government accounts. “The
money stolen,” read the report, “could have paid for 3,000 high-quality roads,
housing for 800,000 people or thousands of ice palaces and soccer fields all
over Russia.
The flow of goods and cash into Sochi set off a full-on
organized crime war that left a trail of dead gangsters.
Putin was the proud owner of a new compound as well,
this one in the mountains outside Sochi. “It is called Lunnaya Polyana, or Moon
Field, a reference to the barren landscape upon which it sits,” wrote Forrest.
“It is protected by some of the 30,000 Spetsnaz special-forces troops that
Russian military has dispersed into the mountains, there to live in tents until
the Olympics are over. Putin has built himself two massive chalets, two
helipads, a power station, and two ski lifts, servicing surrounding peaks.”
Smack in the middle of what was supposed to be a protected national park, “the
Russian state built a private dacha on a UNESCO site under the guise of
conducting meteorological research.
Russia vs Ukraine
In the aftermath of his forcible annexation of Crimea,
Putin was enjoying an enormous surge in popularity inside Russia. This first
step in the advent of what he called Novorossiya (New Russia)—restoring the
lost territory and the old glory of a faded empire—had caused Putin’s personal
approval ratings to jump into the mid-80s by the summer of 2014. The approval
numbers among his long-standing base constituency of poor, rural, less-educated
Russians had ticked up to around 90%. The approval numbers among the urban intelligentsia,
meanwhile, soared from below 50 to 75%. Russians had suddenly decided—after ten
years of saying otherwise—that they would rather be struggling citizens of a
superpower nation with swagger than struggling citizens of a beat country.
The international community was alarmed, if not outright
horrified, that the Russian putsch hadn’t stopped there. Putin’s military had
also massed soldiers, tanks, and artillery on the Ukrainian border as a sign of
encouragement to separatists in the Donetsk and Luhansk oblasts, a region known
as the Donbas. Somewhere between a quarter and a third of the population in
those two oblasts had voiced support for annexation to Russia. Putin’s
commanders explained they had moved military assets to the border in case they
were called to sweep in and protect the Russian-speaking population in these
oblasts from the depredations of Ukrainian leaders who had taken charge of the
federal government in Kyiv.
The area nearby also accounted
for something near 90 percent of Ukraine’s oil and gas production, and fracking
technology promised to open new fields.
Ukraine had been a founding member of the Union of Soviet
Socialist Republics in the early twentieth century, but a conflicted one. The
citizenry’s sense of itself as a separate and sovereign nation was never
extinguished, and when it finally got the chance in 1991, the industrialized
nation of fifty million chose independence, with an exclamation point. Nine in
ten Ukrainians voted “yes” in the world-changing Act of Independence referendum
that year. Even in Ukraine’s largely Russian-speaking oblasts on the Russian
border like Luhansk, Donetsk, and Crimea, voters overwhelmingly picked independence.
Three years later, the new Ukrainian government traded in its nuclear
arsenal—the third largest in the world behind the United States and Russia at
the time—for “security assurances.” The United States, the United Kingdom, and
Russia signed on to the Budapest Memorandum in December 1994. Ukraine handed
over its 176 long-range missiles and its nearly 2,000 nuclear warheads, and in
return the other major nuclear powers agreed to respect Ukraine’s existing
borders and its sovereignty.
The West chipped in with a large aid package. Cash-poor
Russia promised what it could, and what it could promise was a robust and
ongoing supply of cheap energy.
Ukraine had a mammoth appetite for gas—for Russian
gas. The country consumed more fuel as a percentage of its GDP than any nation
in the world, and its fuel of choice was natural gas. The country bought
three-quarters of its supply through Russia’s state-controlled monopoly,
Gazprom; it also made money transiting Russian gas through pipelines to Gazprom
customers in Europe. So even after the Orange Revolution and the election of
Yushchenko, Russia still managed to keep a hold on the reins of Ukraine’s
economy, and its politics—which was perfect, as far as Putin was concerned. The
infinitely corruptible energy business allowed Putin to pick and choose who
would be rich and who would be powerful in Ukraine. He had learned this system
well in St. Petersburg and then in Moscow, and it fast became Putin’s strategy
for projecting Russian power beyond its borders. The biggest threat he had to
keep at bay was the prospect of strong, rich, stable, Western-oriented
democracies in Russia’s near abroad. That sort of thing could not only
challenge or constrain Russia’s regional power; it could conceivably—the
horror—inspire the Russian people themselves, leading them to demand a
democratic say in their own government as well.
There was fantastical corruption at the very heart of the
Ukrainian state, and so would the prospect of all the richest and most powerful
and influential people in Ukraine being dependent on Russia’s every whim. It
cost Gazprom a pretty penny—straight out of Russian government coffers—but it
was worth it. Firtash (as well as some of Putin’s other Ukrainian oligarchs)
would have plenty of cash to spread around to shape their country in ways that
Putin would appreciate. Some of that cash went back to Moscow as tribute. Even
more of it went to prop up Yanukovych’s Party of Regions, which meant a whole
bunch of it passed through or ended up in the offshore bank accounts of the
mercenary American political operative Paul Manafort, who was always available
to help his friend Yanukovych, for a price. The price ended up being about $75
million over the course of a decade.
Manafort was clearly quite taken with Dmitry Firtash, the
source of much of that cash. He went so far as to set up a handful of business
entities designed to help folks like Dmitry, and most particularly Dmitry, get
money out of Eastern Europe and Central Asia and into U.S. or international
real estate holdings. “The advantages of a single investor,” wrote Manafort,
“include less exposure, more flexibility, less reporting requirements and the
ability to organize off-shore to maximize the return of the investor.
Tymoshenko was a particular threat to Moscow’s
influence in Ukraine. She had made herself the front-runner in the 2010
presidential election by seizing on Firtash’s sweetheart gas deal and promising
to end it. She made a good case: Why on earth should RosUkrEnergo be allowed to
siphon off $800 million in a single year by playing a middleman nobody needed?
One of Yanukovych’s first acts as president was to sic
a rabid state prosecutor on Yulia Tymoshenko. Lock her up! Yanukovych’s
prosecutor charged Tymoshenko with the crime of abusing her official powers by
“illegally” arranging the new Firtash-free gas deal with Russia without the
required bureaucratic sign-offs. Tymoshenko had a lot of sympathy in the United
States and Europe, so Manafort got right to work on the public relations front.
According to reporting by Luke Harding in The Guardian—later corroborated in
legal filings by Robert Mueller’s special prosecution team—Manafort engaged a
sleazy PR firm run by American expats to draw up an energetic media operation
to smear Tymoshenko.
Despite FBC’s best efforts, Tymoshenko’s conviction in
October 2011—she was sentenced to seven years in prison, ordered to pay $194
million in restitution, and barred from running in the next presidential
election—was seen in government offices across the West for what it was: a hit
job by Yanukovych on his most able political opponent. So Manafort’s dirty
trickster public relations team kept at it. They got excellent help from
emerging alt-right media sites like Breitbart News, which tossed a
guilt-by-association anti-Semitism spray grenade.
Corruption-wise, things were going along pretty
swimmingly in Ukraine. With Tymoshenko stashed in prison, trashed by American
PR firms and law firms and anything else Manafort could cook up, Russia’s man
in Ukraine—Dmitry Firtash—got back into the gas deal, which was better than
ever. His company’s operating profit for the years 2012 and 2013 added up to
nearly $4 billion. With that kind of money available for corrupting any actual
governance in the interests of the people in Ukraine, Putin’s natural gas
supplier monopoly hovered over the heads of the Ukrainian people like a sword.
Ukrainian companies were
ratcheting up their own production in the country’s oil and gas fields, signing
production deals with the major Western oil companies. They could frack, too!
Ukraine had almost 400 million barrels of proven oil reserves, and God only
knew how much natural gas once the serious fracking got going. Ukrainian
officials were already talking about being able to produce every cubic meter of
natural gas the country needed, inside the country. And to be able to export
gas to Europe at a profit. This was revolting to Putin, whose lifeblood income
came from Russia’s natural gas sales in Europe and whose gravitational pull
over countries in his orbit was the control, corruption, and cash that energy
supplies afforded him.
Putin was done trying to make nice. He had had it with
the United States meddling on his turf. He figured the United States had put
$5 billion into moving Ukraine into the Western win column. Vice
President Joseph R. Biden had been in and out of Kyiv for years, insisting the
Obama administration would protect Ukraine from Russian aggression. “We do not
recognize—and I want to reiterate it—any sphere of influence,” Biden reminded.
Privately, American officials were even tougher on
Russia’s decline—pointing to the increasing death rates among the country’s
younger set, its rampant alcoholism, its military’s decline into second-tier
status, and its rampant corruption. Hey, just saying, it can’t be easy being a
former superpower
In less than three weeks, Putin ripped Crimea from Ukraine
and took it for Russia. The “exit of Crimea from Ukraine,” the Kremlin claimed,
was the result of “complex international processes.” It was the first time
since World War II that one country had rewritten another’s borders by force
and seized an entire landmass and its people for itself. Putin had blatantly
violated Russia’s vow to respect Ukrainian sovereignty, and he didn’t seem
content to stop at Crimea. He was already moving his forces toward other
oblasts in the east of Ukraine, which also happened to be the oblasts with
promising fields of oil and gas.
The move left Western leaders in a pickle; they were
clearly shaken and uncertain of the proper response. The wrong move could
easily tip into regional or even global disaster. Europe was hugely dependent
on Gazprom’s natural gas. “There is no sensible alternative to Russian gas to
meet Europe’s energy needs,” Germany’s economy minister, Sigmar Gabriel, said
at the time. “Many people acted as if there [were] plenty of other sources from
which Europe could draw its gas, but this is not the case.
The United States and the European Union drew up a list
of Russian oligarchs and Kremlin officials, froze their assets in the West, and
declared them off-limits for American and European businesses. The people on
the list had one thing in common: they were Putin’s most trusted consiglieri.
Among them were Arkady and Boris Rotenberg, Russian Railways’ president,
Vladimir Yakunin. And Igor Sechin.
the newly inaugurated Poroshenko got to work on behalf of
Ukrainians. One of his first acts as president was to sign the official
Association Agreement with the European Union that his Russian-tool predecessor
had tried to back out of. “This is a really historic date for Ukraine,”
Poroshenko said at the signing ceremony. He then further exasperated Putin by
expressing his hopes that Ukraine would one day be a full member of the EU.
Poroshenko also defied Putin in an even more aggressive way; he mounted a
serious military counteroffensive in the Donbas, using the national army to
reinforce the pro-Ukrainian militia groups who had formed in the long weeks of
absence of help from Kyiv.
June and July turned out to be very, very bad months for
President Putin. There was a surge in the number of dead Russian soldiers
being shipped back home from the Donbas. The corpses arrived in Russia under
the cover of secrecy, cryptically marked “Cargo 200.” The Putin critic and
political opponent Boris Nemtsov saw it happen and immediately began a campaign
to catalog a name-by-name record of the casualties for public release. Nemtsov
understood there was a limit to how many husbands, wives, sons, daughters,
brothers, and sisters Russians were willing to sacrifice for another chunk of
Ukraine. Officials in the Kremlin and the Russian military understood that
too. Survivors of the dead received terse and pointed messages that suggested
they keep their grief concerning these “volunteer” soldiers confined to the
family circle.
On July 16, 2014, with Putin showing no signs of backing
down in the face of Ukraine’s assertion of its sovereignty and the defense of
its borders, the United States announced another round of sanctions. This
new set, for the first time, included Rosneft. American companies were given
license to go ahead with existing projects, but in the future there could be no
new deals with Russia’s oil giant. European Union leaders were wary about
supporting the United States on the new sanctions, because they were scared of
backing the volatile Putin into a corner. Not only did EU countries do ten
times more trade with Russia than did the United States, but they were
dependent on Russia for much of their energy.
The spotters in the Russian brigade likely mistook the
jet for a Ukrainian military plane. (The Russians had been shooting Ukrainian
jets and helicopters out of the sky, with abandon, for well over a month by
then.) There were almost 300 people on the flight, and more than 200 citizens
of the EU.
The Kremlin denied responsibility, to little effect.
Western Europe finally swung into Ukraine’s corner. Within two weeks, the EU
had joined with the United States to take an even bigger bite out of Putin’s
hide, and from the part he actually cared about. The new sanctions would
specifically bar the sale or transfer of advanced engineering systems that
Russia needed to drill new oil fields. “In the energy sector, new
precision-guided restrictions will make it difficult for Russia to access the
technology and equipment needed to produce oil from deep water, Arctic or shale
deposits,” explained Jason Bordoff, who had just left his job as staff director
in charge of energy and climate change at the National Security Council, and
Elizabeth Rosenberg, a former senior sanctions adviser at the Treasury
Department.
“These are precisely the complex, challenging projects
that Russia will have difficulty achieving without the technology of Western energy
firms. The measures are designed to make it more difficult and costly for
Russian energy companies to invest in replacing declining conventional oil
output and meeting future production goals.
He was also incensed by news from the international arbitration
court in The Hague, which had chosen this particular moment to issue its
verdict on Rosneft’s disputed grab of Yukos a dozen years earlier. The court
ordered that Russia owed $50 billion in recompense and damages to Yukos
shareholders and named Putin himself as a bad actor in the scheme. “Each step
against Russia he [Putin] now believed to be a cynical, calculated attack
against him,” Myers writes in The New Tsar. “He simply no longer cared how the
West would respond. The change in Putin’s demeanor became acute after the
downing of Flight 17, according to his old friend Sergei Roldugin. ‘I noticed
that the more he is being teased the tougher he becomes….
Putin’s indifference and unwillingness to compromise
turned pretty damn aggressive, pretty damn fast. Staging areas on Russia’s
western border filled with more than 40,000 Russian soldiers and weapons
(including land mines, mortars, rocket launchers, surface-to-air missiles,
152-millimeter howitzers, anti-tank guided missiles, and actual battle tanks).
Russian soldiers were ordered to scrub all insignia and identifying markings
from their uniforms and equipment and vehicles, hand over their cell phones,
and head west into eastern Ukraine.
Most of the Russian soldiers who crossed the border were
not rabid partisans for Putin’s fight, according to reporters on the ground
from The Guardian. Typical among them was a recent recruit who signed up
because there were no other paying jobs
The Ukrainian regular army and militia units were no real
match for even poorly motivated Russian artillery and tank units. The former
president Yanukovych had pretty well hollowed out the Ukrainian military while
in office. The Russians killed more than a thousand Ukrainian fighters in the
early stages of their new offensive and began winning back substantial chunks
of the Donbas.
The Russian military, he insisted, had nothing to do with
it. As did Lavrov, his foreign minister, who had made a habit of hurt and angry
denial, even when presented with the half a dozen regular Russian soldiers
captured in Ukraine, or with satellite images of Russian troops and weapons on
the march in the Donbas. These were, he lied, “just images from computer games.
The United States, meanwhile, unleashed a very specific
new sanction it had been threatening for months. The wiggle room allowed for
dealing with Rosneft and the rest of the Russian oil industry was officially
closed. Prior deal or no, the Obama administration declared that all
American companies had to cease operations in Russia.
It didn’t take an oracle to see where this was headed.
Yevtushenkov’s arrest was widely reported. It didn’t even matter that
Yevtushenkov, unlike Yukos’s boss, Mikhail Khodorkovsky, had never uttered a
syllable of challenge to Putin’s political authority. This time around, it was
simply about business or, more precisely, power. Here was a jewel of the
Russian oil industry, and its principal owner, its Russian principal owner,
seemed to be forgetting his company’s first duty was to the Russian state and
Vladimir Putin (and Igor Sechin). Especially now, when the future of the
Russian Federation was in the balance. Bashneft, like Yukos and Lukoil and
every other oil-producing company in Russia, was first and foremost a
“strategic asset” of the state;
On September 27, 2014, Rosneft announced that the West
Alpha rig had struck oil 7,000 feet beneath the floor of the Kara Sea. Imagine
the luck! It happened right inside the window that the U.S. government had
afforded ExxonMobil to pack up its things, close off the well. Turns out,
ExxonMobil had used the time to just kept drilling. The hydrocarbon trap Exxon
drillers had tapped was believed to hold about a billion barrels of oil and oil
equivalent. This represented one of the largest single finds in years, anywhere
in the world.
While Yevtushenkov was in stir, remember, a judge in
Moscow “nationalized” the billionaire’s shares in Bashneft, which meant that
his shares in his own company were handed over to the Russian state. In three
months, Yevtushenkov had been robbed by Vladimir Putin and Igor Sechin to the
tune of about $8 billion, the vast majority of his net worth. Not to mention,
of course, control of the best-run and most remunerative oil company in one of
the biggest oil-producing countries on earth.
Igor Sechin’s Kremlin-assisted “purchase” of a majority
stake of Bashneft was concluded on remarkably favorable terms—he got the
company for a pittance. Then, for a little icing on the cake, he found a
court in Russia that would force Yevtushenkov to pay Rosneft $1.7 billion, for
supposedly stripping Bashneft of its assets. So Putin and Sechin took his
company, and then they made him pay them for the trouble of taking it.
Gangster-style.
One unexpected piece of collateral damage in Sechin’s new
crocodile act was the serious injury to the standing of the economic
development minister at the Kremlin, Alexei Ulyukayev. Minister Ulyukayev had
had the temerity to voice his opinion that Bashneft should go to the highest
bidder on the open market. And Rosneft should stay out of it. For my
enemies…Sechin invited Ulyukayev to his home and, truly gangster-style,
presented him with a gift basket of his famous homemade sausages, some fine
wine, and, unbeknownst to his guest, $2 million worth of rubles, in cash, stuffed
into the bottom of the parcel. Sechin then had the minister arrested on the
spot (the FSB gendarmes were conveniently there, at the ready) for soliciting
and receiving a bribe. Ulyukayev was sentenced to eight years in prison and
ordered to pay a $2.2 million fine. That takes care of him.
When the people of Ukraine stand up and make a rational
decision for themselves, and toss out the fantastically corrupt Viktor
Yanukovych and Putin’s other henchman in Kyiv, the natural gas middleman Dmitry
Firtash, all Putin knows to do is turn to a different type of corruption. He
attacks with lies and disinformation, because those are the only cards he has
to play to prevent the Ukrainian people from making rational decisions in their
own national interest.
In truth, a critical subtext of the Moscow Trump Tower
project—which Mueller assessed could have been worth hundreds of millions of
dollars to Trump—was dropping U.S. sanctions on Russia. No deal could have happened through them as
long as sanctions remained in place. All
of the potential financing entities described in conjunction with the Trump
Tower Moscow deal were under sanctions. With sanctions in place, such a deal
could never happen.
With an economy completely dependent on oil and gas, and
an oil and gas industry completely dependent on someone else’s expertise, the
sanctions that preclude Russia from getting that expertise were like a
tourniquet around the neck. Sanctions were the entire ballgame for the
Russians, and they had made that abundantly clear to Team Trump by the time it
entered the White House.
Investigative journalist Michael Isikoff was the
reporter who first ferreted out that Trump hit the ground running with a
day-one concerted effort to try to unilaterally get rid of the sanctions.
“Unknown to the public at the time, top Trump administration officials, almost
as soon as they took office, tasked State Department staffers with developing
proposals for the lifting of economic sanctions, the return of diplomatic compounds,
and other steps to relieve tensions with Moscow,” reported Isikoff for
Yahoo News. State Department veteran Dan Fried told him that in the first few
weeks after Trump was inaugurated, he received “panicky” calls from officials
who told him they had been “directed to develop a sanctions-lifting package and
imploring him, ‘Please, my God, can’t you stop this?’
He could, actually. Fried and Tom Malinowski and other
State Department old hands broke the emergency glass and sounded the alarm on
both sides of the aisle in Congress that the Russia sanctions needed to be made
statutorily binding—stat. Incredibly, it worked. With Democrat Cardin and
Republican John McCain in the lead in the Senate, Congress moved with
uncharacteristic agility and swiftness to pass legislation to codify the
sanctions and make it harder for Trump to undo them on his own say-so. The
national legislature did it at lightning speed, even after Tillerson begged
members to soft-peddle the new law. “I would urge allowing the president the flexibility
to adjust sanctions to meet the need in what is always an evolving diplomatic
situation,” the secretary of state said as the bill was hurtling toward
passage. Trump squeaked like an unoiled hinge over how much he hated the
legislation and didn’t want to sign it. It was only when his hand was
effectively forced by a veto-proof majority (98–2 in the Senate, 419–3 in the
House) that he finally relented.
Nemtsov challenges
Putin
Nemtsov became one of the president’s most vocal and most
popular opponents, and a relentless burr under Putin’s saddle. He co-authored a
no-holds-barred study of the Kremlin’s venality and mismanagement in its
running of Gazprom in 2008. And in 2012, he publicly praised the Magnitsky Act,
which permitted the U.S. Congress to mete out real economic punishment on
specific individuals in Russia who committed gross human rights violations.
Unlike Carter Page, who decried the Magnitsky Act as latter-day McCarthyism,
Nemtsov hailed it as the way to finally nick the “crooks and abusers” among
Russian businessmen and officials.
In 2015, while the battle for eastern Ukraine rumbled on,
Boris Nemtsov, who had become the most fearless critic of Putin’s illegal
annexation of Crimea and his illegal war in the Donbas, sat for a long
interview with the Polish edition of Newsweek. He was due to lead a massive
antiwar demonstration in Moscow two days later. Nemtsov understood it was
likely to take decades to chip away at Putin and authoritarian rule in Russia,
but he wasn’t giving up, and he was driven by a sense of urgency. “I have no
doubt that the struggle for the revival of Russians will be tough,” he told the
Newsweek interviewer. Putin “implanted them with a virus of inferiority complex
towards the West, the belief that the only thing we can do to amaze the world
is use force, violence and aggression….[Putin and his siloviki] operate in
accordance with the simple principles of Joseph Goebbels: Play on the emotions;
the bigger the lie, the better; lies should be repeated many
times….Unfortunately, it works. The hysteria reached unprecedented levels,
hence the high level of support for Putin. We need to work as quickly as
possible to show the Russians that there is an alternative.
Later the next evening, walking home after a dinner out
with his girlfriend, Nemtsov was gunned down on a suddenly and strangely
traffic-less side of a bridge across the Moscow River, steps from the Kremlin
grounds. The assassination appeared to have been meticulously planned and
executed by a team of two or even three dozen people. The Kremlin fingered a
group of Chechen terrorists and continues to block independent investigations
into Boris Nemtsov’s murder.
And where was ExxonMobil’s chieftain, Rex Tillerson, in
all this? He was standing by, waiting for the unfortunate geopolitical cloud to
disperse.
Russian spying – the Illegals
(TV show “The Americans” based on this)
The Illegals had gleaned, well, pretty much nothing they
couldn’t have gotten reading their local newspapers. Putin’s best spies in
America seem to have never really had their heart in the mission. The New
Yorker’s Keith Gessen, a Russian-born American journalist and novelist who came
to the United States when he was six years old, found the entire episode “sad
and touching….Sad because, according to the F.B.I. affidavit, the information
requested by the Russian government (‘Moscow Center,’ as it’s called) is so
mundane, and some of it merely trade secrets, unbefitting a mighty state and
redolent too of the central planning that once turned the U.S.S.R. into an
economic basket case. Touching because the other information they are said to
have sought—American plans for fighting terrorism; American plans for Iran;
Obama’s hopes for last summer’s summit in Moscow—seems to dance around the real
issue. Like a kid in the presence of his new crush, asking, ‘Do you like
movies?,’ ‘What’s your favorite color?,’ Russia really wanted to ask America:
What do you think of me?
Despite the public boasts
about their heroic victory in Moscow, the Illegals were demonstrably bumbling,
even slipshod. The group was under close and constant surveillance for nearly
ten years, with footage and photographs and audio recordings to prove it. Their
countersurveillance efforts had bordered on gross negligence. Their homes were
searched and their cars tagged with GPS trackers, and the Illegals never knew.
The best of the spies, Heathfield/Bezrukov, was for years kept under the
watchful and unseen eye of the U.S. lead agent Peter Strzok—the G-man later
torched by the Trump administration and congressional Republicans for his role
in investigating the Russia scandal surrounding the U.S. 2016 presidential
election. The Illegals had repeated contact with FBI agents posing as fellow
Russians. “Are you ready for this [next] step?” one undercover agent asked Anna
Chapman. “Shit,” she replied, “of course.
Then she unwittingly handed
over her laptop to the American undercover agent, and then she bought a burner
phone and a Tracfone calling card, and then she dumped the receipt into a
public trash can where it was fished out by the FBI.
Richard Murphy was barely
even trying. “He had a thick Russian accent and an incredibly unhappy Russian
personality,” she said. “I knew he wasn’t American. I knew it was very odd.” Or
as one of Richard Murphy’s Marquette Road neighbors told a reporter a few days
after the arrest, as the tumblers were beginning to fall into place, “It was
suspicious that he had a Russian accent and an Irish last name. Who does
that?…He must have been the worst spy ever.