Preface. No surprises here. With peak oil close at hand, I can’t see universal healthcare and other safety nets enacted, just more and more taken away. It is so shameful the U.S. doesn’t take care of its people, it is the richest nation that ever existed on earth or ever will. Check out all the countries that do provide health care to their citizens at wiki here, including many poor nations you wouldn’t expect such as Algeria, Botswana, Burkina Faso, Egypt, Ghana, Rwanda, South Africa, Tunisia, Argentina, Brazil, and too many more to list.
Plus with evangelicals voting corrupt Republican autocrats into office, definitely not. They’re half of those who vote for him, and 82% would vote for him in 2020 and 99% of them are against impeachment. Here’s why: “58 percent of white evangelicals believe that Jesus definitely or probably will return to Earth by 2050.” This is why they don’t care if Trump is evil, destroys the environment, denies health care, and helps the rich get richer. It doesn’t matter if the end times are near (Morris 2019, Krasny 2019).
So eat, drink, and be merry as the apocalypse or more likely Peak Everything approaches!
Greater levels of income and wealth leads to greater longevity. The expanding gap between rich and poor is not only widening the gulf in incomes and wealth in America. It is helping the rich lead longer lives, while cutting short the lives of those who are struggling, according to a study released this week by the Government Accountability Office. About 75% of rich Americans who were in their 50s and 60s in 1992 were still alive in 2014, but just 50% of poor Americans made it to 2014.
It’s not only that rich people are living longer but some people’s life expectancy is actually shrinking compared to their parents, for some groups of people.
Some estimates suggest from 8 to 14% of global wealth is kept in tax havens
The provocative revelations coming out of the so-called Panama Papers are just a glimpse into the murky global network that’s keeping “absolutely astonishing” amounts of money out of public coffers.
The 11.5 million files taken from Panama-based law firm Mossack Fonseca show how the financial elite exploit a secretive system to manoeuvre wealth anonymously and ensure the taxman doesn’t take his cut.
The firm is “the world’s fourth biggest provider of offshore services,” according to the Guardian, with about $42 million in yearly revenue. The documents contain information about more than 214,000 shell companies, trusts and foundations — usually used to hold or transfer financial assets while obfuscating the identity of their real owner — that were registered with the firm.
“That gives a sense of the tremendous scope of this in terms of the flows of money into these largely mysterious companies, and this is only one firm,” says Nicholas Shaxson, an investigative journalist and author of Treasure Islands: Tax Havens and the Men who Stole the World.
It’s difficult to delineate what constitutes a tax haven but it’s generally agreed that, depending on the criteria, there are between 70 and 92 of them worldwide. And there’s an estimated two million shell companies registered with offshore firms in these states.
“For a long time, people thought of tax havens as an exotic sideshow of the world economy. Now it’s clear they are absolutely central to it. We’re talking about absolutely astonishing, mind-boggling amounts of money,” Shaxson says.
Estimates of how much wealth is currently stashed offshore vary considerably, a reflection of the opacity of an industry that some economists contend has grown exponentially in recent decades.
Gabriel Zucman, author of The Hidden Wealth of Nations and a professor at the University of California at Berkeley, puts the figure at least $7.6 trillion.
But the Tax Justice Network, an international research and advocacy organization, says the number is far greater. The group estimates that as of 2010, there was between $21 and $32 trillion kept in offshore holdings. That would represent between eight and 13 per cent of total global wealth.
Resource drain
Perhaps most troubling, according to one economist, is that somewhere in the ballpark of $1 trillion is illegally funneled out of developing nations each year into mysterious shell companies.
It’s a system that bolsters kleptocracy and corruption, says Matt Salomon, chief economist with Global Financial Integrity.
“It’s a real resource drain in countries where the money is needed most. At the same time, wealthier nations are standing by as this is happening, insisting that they support development in these places,” he says.
“It’s possible that the $1-trillion figure only represents a drop in the bucket since the data is so murky.”
Many of the dealings facilitated by offshore firms are entirely legal and are encouraged by major financial institutions the world over. Canada’s biggest lender, RBC, was named in the Panama Papers, having used Mossack Fonseca to set up at least 370 shell companies for clients.
There’s a searing public anger over a system that so blatantly favours the wealthy and operates with near impunity, says Shaxson. It’s putting pressure on governments to finally crack down on tax dodgers that cost countries billions each year.
Canada alone loses between $6 and $7.8 billion annually to offshore tax havens, according to a report in the Toronto Star. In response, the federal government dedicated $440 million over four years in the 2016 budget to probe tax evasion and what the Canada Revenue Agency called “aggressive tax avoidance.”
Even before the Panama Papers prompted public outrage though, more than 100 countries since 2014 had committed to increasing transparency around the financial holdings of foreign customers.
The U.S. is among the countries resisting these changes. States like Delaware, Nevada and South Dakota allow for levels of anonymity and secrecy that “rival any of the countries we usually think of as tax havens,” says James Henry, former chief economist at the consulting firm McKinsey.
‘The level of anger is higher than ever’
“It’s insufficient to just say ‘offshore tax havens’ because the industry has expanded so aggressively to countries around the globe,” adds Henry, now a fellow at Columbia and Yale.
Despite big promises from governments, real reform will not come easily. Tax havens and all the perks that come with them “are the projects of some of the world’s wealthiest people,” says Shaxson.
There’s a lot of money to be made by interests with considerable political clout, Henry notes, and the very nature of the business makes it difficult for so-called crackdowns to be effective. Financial institutions rarely face any significant consequences, and past investigations have ended up completely toothless.
“Look, for decades, governments have known about this, law enforcement have known about this and the response has been pretty pathetic. I think the reasons for that are pretty clear at this point,” Henry says.
“But the level of anger is higher than ever, and it will probably only intensify as more stories come out of the leak.”
Preface. Obviously endless growth on a finite planet is impossible. Clearly the main “benefit” of debt is being able to rape and pillage the planet immediately. The accumulating debt can never be paid off, because energy is required to grow GDP (they’re locked in a death embrace) and death begins when oil declines, so will GDP, and most debts won’t be repayable. All of this debt allows us to extract resources NOW at the expense of future generations.
Here’s a recent article about debt, though not as good as it could be, since as usual, it’s energy and resource blind, but it’s probably clear to most people who read it that this can’t end well: December 2019 The Way Out for a World Economy Hooked On Debt? Yet More Debt (Bloomberg).
Beneath the surface of the global financial system lurks a multi-trillion-dollar problem that could sap the strength of large economies for years to come.
The problem is the giant, stagnant pool of loans that companies and people around the world are struggling to pay back. Bad debts have been a drag on economic activity ever since the financial crisis of 2008, but in recent months, the threat posed by an overhang of bad loans appears to be rising.
China is the biggest source of worry. Some analysts estimate that China’s troubled credit could exceed $5 trillion, a staggering number that is equivalent to half the size of the country’s annual economic output.
Official figures show that Chinese banks pulled back on their lending in December. If such trends persist, China’s economy, the second-largest in the world behind the United States’, may then slow even more than it has, further harming the many countries that have for years relied on China for their growth.
But it’s not just China. Wherever governments and central banks unleashed aggressive stimulus policies in recent years, a toxic debt hangover has followed. In the United States, it took many months for mortgage defaults to fall after the most recent housing bust — and energy companies are struggling to pay off the cheap money that they borrowed to pile into the shale boom.
In Europe, analysts say bad loans total more than $1 trillion. Many large European banks are still burdened with defaulted loans, complicating policy makers’ efforts to revive the Continent’s economy. Italy, for instance, announced a plan last week to clean out bad loans from its plodding banking industry.
Elsewhere, bad loans are on the rise at Brazil’s biggest banks, as the country grapples with the effects of an enormous credit binge.
“If you have a boom and then a bust, you create economic losses,” said Alberto Gallo, head of global macro credit research at the Royal Bank of Scotland in London. “You can hope the losses one day turn into profits, but if they don’t, they are a drag on the economy.”
In good times, companies and people take on new loans, often at low interest rates, to buy goods and services. When economies slow, these debts become difficult to pay for many borrowers. And the bigger the boom, the more soured debt that is left behind for bankers and policy makers to deal with.
In theory, it makes sense for banks to swiftly recognize the losses embedded in bad loans — and then make up for those losses by raising fresh capital. The cleaned-up banks are more likely to start lending again — and thus play their part in fueling the recovery.
But in reality, this approach can be difficult to carry out. Recognizing losses on bad loans can mean pushing corporate borrowers into bankruptcy and households into foreclosure. Such disruption can send a chill through the economy, require unpopular taxpayer bailouts and have painful social consequences. And in some cases, the banks might find it extremely difficult to raise fresh capital in the markets.
Even so, the drawback of delaying the cleanup is that the banks remain wounded and reluctant to lend, damping any recovery that takes place. Japan, economists say, waited far too long after its credit boom of the 1980s to force its banks to recognize huge losses — and the economy suffered for years after as a result.
Now many banking experts are beginning to worry about China’s bad loans.
Fears that the country’s economy is slowing have weighed heavily on global markets in recent months because a weak China can drag down growth globally.
Many of these concerns focus on China’s banking industry. In recent years, banks and other financial companies in China issued a tidal wave of new loans and other credit products, many of which will not be paid back in full.
China’s financial sector will have loans and other financial assets of $30 trillion at the end of this year, up from $9 trillion seven years ago, said Charlene Chu, an analyst in Hong Kong for Autonomous Research.
“The world has never seen credit growth of this magnitude over a such short time,” she said in an email. “We believe it has directly or indirectly impacted nearly every asset price in the world, which is why the market is so jittery about the idea that credit problems in China could unravel.
Headline figures for bad loans in China most likely do not capture the size of the problem, analysts say. In her analysis, Ms. Chu estimates that at the end of 2016, as much as 22 percent of the Chinese financial system’s loans and assets will be “nonperforming,” a banking industry term used to describe when a borrower has fallen behind on payments or is stressed in ways that make full repayment unlikely. In dollar terms, that works out to $6.6 trillion of troubled loans and assets.
“This estimate really isn’t that unreasonable,” Ms. Chu said in the email. “We’ve seen similar ratios in other countries. What’s different is the scale, which reflects the massive size of China’s credit boom.” She estimates that the bad loans could lead to $4.4 trillion of actual losses.
Although there is not enough official data to come up with a precise figure for bad loans, other analysts have come up with estimates of around $5 trillion.
Given the murkiness of the Chinese financial industry, other analysts arrive at estimates for a “baseline” figure for bad loans. Christopher Balding, an associate professor at the HSBC School of Business at Peking University, said that an analysis of corporations’ interest payments to Chinese banks suggested that 8 percent of loans to companies might be troubled. But Mr. Balding said it was possible that the bad loan number for China’s overall financial system could be higher.
The looming question for the global economy, however, is how China might deal with a vast pool of bad debts. After a previous credit boom in the 1990s, the Chinese government provided financial support to help clean up the country’s banks. But the cost of similar interventions today could be dauntingly high given the size of the latest credit boom. And more immediately, rising bad debts could crimp lending to strong companies, undermining economic growth in the process.
“My sense is that the Chinese policy makers seem like a deer in the headlights,” Mr. Balding said. “They really don’t know what to do.
In Europe, for instance, some countries have taken years to come to grips with their banks’ bad loans.
In some cases, the delay arose from a reluctance, at least in part, to force people out of their homes. Even though Ireland’s biggest banks suffered huge losses after the financial crisis, they held back from forcing many borrowers who had defaulted out of their homes. In recent years, the Irish government has pursued a widespread plan that aims to reduce the debt load of financially stressed homeowners. Such forbearance appears not to have weakened the Irish economy, which has recovered at a faster rate than those of other European countries.
Still, the perils of waiting too long are evident in Italy, which in January announced a proposal to help banks sell their bad loans. Some critics of the plan say it resembles a government bailout of the banks, while other skeptics say the banks might not use it because it appears to be too expensive.
“The big problem in the Italian system is that they acted very late,” said Silvia Merler, an affiliate fellow at Bruegel, a European research firm that focuses on economic issues. “They could have done something smarter — and they could have done it earlier.”
Posted inDebt|Taggedchina, debt|Comments Off on Toxic Loans Around the World Weigh on Global Growth
The critical feature of sustainability isn’t how many people can be
supported by the planet at any given moment in time. Rather, it is the
number of humans that could live here without irreparably damaging the
biosphere we depend on for survival.
A sustainable species never damages the biosphere irreparably. That’s a pretty tall order.
Humans damage the biosphere in many ways.
One
is by shifting resources in space. We usurp the habitat and resources
needed by other species, and sequester them for human use. Resources
obtained in regions that are unimportant to humans are moved to wherever
humans need them, at the expense of indigenous species in the original
location.
We also shift resources in time, by stealing resources
from the past and the future and using them in the present. An example
of this is using fossil fuel energy to pump water out of aquifers for
agriculture, thereby using historical fossil fuel resources to diminish
future water resources, in favour of growing crops today.
We
usurp habitat from other species simply by moving humans to that
location, and in the process making it inhospitable to indigenous life
(the affected indigenous life doesn’t even need to be non-human…) The
sequestering of habitat and resources for human use often go hand in
hand.
The unsustainability of our species at any time can be
roughly gauged by the degree to which we have concentrated the the
spatial and temporal distribution of resources into the here and now,
and the extent to which humans have displaced wild life of all sorts.
In contrast, being a fully sustainable presence would require us to do no damage to the planet that could not be repaired by natural biophysical processes in real time.
Given
such constrained behaviour, the human species could survive for a very
long time indeed (perhaps tens of millions of years) alongside all other
sustainable species. Of course, any damage that can’t be repaired invokes the concept of overshoot, which will shorten our species’ period of survivability by some (unknown, perhaps unknowable) amount.
It should be obvious to everyone here that our species’ current way of life is “quite unsustainable” by these criteria.
Is
it possible to return our species to sustainability? To answer that
question it helps to have a benchmark. When was the last time Homo
sapiens might have qualified as a sustainable species using these
criteria?
In my opinion, the timestamp has to be placed at least
prior to the invention of agriculture, since it was agricultural
technology that kicked off the population and cultural growth that got
us here.
Before the development of agriculture (as distinct from
the horticulture practiced by many hunter forager societies), the global
human population is estimated to have been about 6 million people, with
an annual growth rate around 0.02%
Such a population of 6 million hunter foragers could perhaps be considered sustainable, except for a couple of caveats.
One
caveat is population growth. With a climbing net birth rate it didn’t
take long for a population of 6 million to turn into 6 billion. We
managed it in just over 12,000 years, at an average growth rate of a
measly 0.06%. Our current growth rate is over 1%, 50 times higher than
the 0.02% of “Homo sustainabilensis”.
The other caveat is
per-capita consumption growth, as well as the growth in technology that
is required to sustain both growing population and consumption levels.
Per-capita
consumption can be loosely approximated by energy consumption, since
all material goods require energy to produce. A hunter-forager consumed
about 150 watts in food and fuel. A modern human uses more than twenty times that amount. This energy use amplifies the damage done to the biosphere by the growing number of humans.
So,
6 million humans all living as hunter-foragers might be considered
sustainable. But only if they were to maintain a permanently static
population capped at 6 million, and a static level of per-capita
consumption capped at the equivalent of 150 watts of energy use.
By
this estimate, compared to our nominally sustainable forebears we are
already in overshoot by a factor of about 25,000. And it’s climbing with
every new mouth and every increase in energy consumption.
(Sarcasm generator on)
Humanity could of course move back toward sustainability. Easy-peasy. All we’d have to do is: reduce our population by almost
7.5 billion; stop population growth completely; reduce our energy
consumption and the activity that it drives – say by 90%); and eliminate
all technological development that results in greater energy
consumption (I’m looking at you, William Stanley Jevons.)
(Sarcasm off)
What? We can’t/won’t do that? I know that. This isn’t an exercise in goal-setting. It’s an exercise in measuring the width of the Atlantic Ocean in case we’re ever inclined to try swimming across it.
A new study, published in Fisheries Research, reveals that the sheer amount of tuna being taken from our seas, including some species considered “vulnerable,” has increased by an astonishing 1,000% in the last 60 years — a rate that some scientists are saying is unsustainable.
Not only are we taking more tuna from the oceans than ever before, but we’re also harvesting them farther from shore. Industrial tuna fishing now covers somewhere between 55% and 90% of the global oceans, fueled in part by extensive government subsidies.
Everywhere tuna swim, they’re being pursued by industrial fisheries.
The report also draws attention to the amount of bycatch taken in the pursuit of tuna. The study estimates that just under 6 million metric tons of shark were discarded as bycatch between 1950 and 2016 in the Pacific Ocean alone. Much of that was made up of blue sharks, which take many years to mature and produce few offspring.
“There’s been an incredible push to end dolphin bycatch in tuna fisheries because they’re cute,” says Coulter. “But sharks are apex predators. They hold all these food chains together. If we’re removing these sharks [from the ecosystem], they really can’t catch up and will decline more and more.”
Milius, S. 27 Feb 2012. Sardine fishery may be in peril. Conditions in northeast Pacific echo those related to collapse last century. Science News.
The Sardine fishery was once the largest of any species in the Western hemisphere. It’s still very important to whales, seabirds, and predatory fish. It collapsed in the 1940s from overfishing the bigger and older fish, and an oceanic cycle called the PDO (Pacific Decadal Oscillation), and now it looks like history is about to repeat itself for the same reasons.
Preface. Below are several articles about hydrogen. Today in 2019 it is still far from commercial. A massive amount of infrastructure needs to be in place before people will consider buying hydrogen fuel cell cars, and because of explosions in South Korea, Norway, and California, building this infrastructure is going slowly.
Several automakers are planning on a hydrogen-car revolution, but the global scarcity of platinum could prove difficult to overcome. Material scientists are worried about the world not having enough platinum since hydrogen fuel cells require significantly more catalytic material than gas or diesel vehicles, because platinum catalysts kick-start the energy-producing hydrogen reaction itself.
SEOUL — Aiming to cash in on a major push by South Korea to promote fuel cell vehicles, Sung Won-young opened a hydrogen refueling station in the city of Ulsan last September. Just one year on, he’s thinking about closing it down. Sung’s new hydrogen station is one of five in Ulsan.
The government paid the 3 billion won ($2.5 million) cost – six times more than fast charging equipment for battery electric cars – and the two pumps, located next to Sung’s gasoline stand, see a steady flow of Hyundai Nexo SUVs daily.
EvSung hasn’t been able to turn a profit, hamstrung as the equipment can only refuel a limited number of cars each day. Refueling takes about 5-7 minutes, but the next driver must wait another 20 minutes before sufficient pressure builds in the storage tank to supply the hydrogen or the car’s tank will not be full.
That means only about 100 fuel cell cars can be fueled a day, compared to up to 1,000 at his gasoline stand. Many drivers can also not be bothered to wait 20 minutes and leave without a full tank.
If those impediments to commercial viability were not enough, a fatal hydrogen storage tank explosion this year has spurred protests against the government and Hyundai’s ambitious campaign to promote the zero-emissions fuel. In May, a hydrogen storage tank at a government research project in the rural city of Gangneung exploded. It destroyed a complex about half the size of a soccer field, killing two and injuring six. A preliminary investigation found the blast was caused by a spark after oxygen found its way into the tank.
One month later, there was an explosion at a hydrogen refueling station in Norway. This week, a hydrogen gas leak and subsequent fire at a South Korean chemical plant caused three workers to suffer burns.
Potential station operators have gotten cold feet since the explosions.
An explosion at a hydrogen fuel production facility shows the industry has a long way to go before fuel cell-powered vehicles can truly be considered a reliable alternative to the internal-combustion engine.
Green Car Reports reported Thursday that hundreds of fuel-cell vehicle owners had no choice but to park their cars due to a hydrogen fuel shortage. The explosion, which happened in Santa Clara, California, this past June, effectively choked the supply of hydrogen to fueling stations in the San Francisco Bay Area. The stations have been dry ever since.
2005. A Committee on the Present Danger Policy Paper: OIL & SECURITY by George P. Shultz, former secretary of state, and R. James Woolsey, former CIA director
To have an impact on our vulnerabilities within the next decade or two, any competitor of oil-derived fuels will need to be compatible with the existing energy infrastructure and require only modest additions or amendments to it.
Although there are imaginative proposals for transitioning to other fuels, such as hydrogen to power automotive fuel cells, this would require major infrastructure investment and restructuring. If privately-owned fuel cell vehicles were to be capable of being readily refueled, this would require reformers (equipment capable of reforming, say, natural gas into hydrogen) to be located at filling stations, and for natural gas to be available there as a hydrogen feed-stock. So, not only would fuel cell development and technology for storing hydrogen on vehicles need to be further developed, but the automobile industry’s development and production of fuel cells also would need to be coordinated with the energy industry’s deployment of reformers and the fuel for them.
Moving toward automotive fuel cells thus requires us to face a huge question of pace and coordination of large-scale changes by both the automotive and energy industries. This poses a sort of industrial Alphonse and Gaston dilemma: who goes through the door first? (If, instead, it were decided that existing fuels such as gasoline were to be reformed into hydrogen on board vehicles instead of at filling stations, this would require on-board reformers to be developed and added to the fuel cell vehicles themselves — a very substantial undertaking.)
It is because of such complications that the National Commission on Energy Policy concluded in its December, 2004, report “Ending The Energy Stalemate” (“ETES”) that “hydrogen offers little to no potential to improve oil security and reduce climate change risks in the next twenty years.” (p. 72)
Senate 109–385. November 16, 2005. High costs of crude: the new currency of foreign policy. U.S. Senate Hearing. 39 pages.
[ Much of the above, and in addition: ]
R. James Woolsey:
We should forget about 95 percent of our effort on hydrogen fuel cells for transportation.
Hydrogen fuel cells have real utility in niche markets for stationary uses. But the combination of trying to get the cost of these one-to-two-million-dollar vehicles that run on hydrogen down, at the same time one coordinates a complete restructuring of the energy industry so one has hydrogen at filling stations, and does a complete restructuring of the automotive industry so one has hydrogen fuel cells, is a many decades-long undertaking.
Nuclear power is losing ground to renewables in terms of both cost and capacity as its reactors are increasingly seen as less economical and slower to reverse carbon emissions, an industry report said.
“Stabilizing the climate is urgent, nuclear power is slow,” said Mycle Schneider, lead author of the report. “It meets no technical or operational need that low-carbon competitors cannot meet better, cheaper and faster.”
The report estimates that since 2009 the average construction time for reactors worldwide was just under 10 years, well above the estimate given by industry body the World Nuclear Association (WNA) of between 5 and 8.5 years.
In May, the International Energy Agency warned reut.rs/2mqcG8j that a steep decline in nuclear capacity will threaten climate goals, as advanced economies could lose 25% of their nuclear capacity by 2025 and as much as two-thirds by 2040 (Clercq 2019 IEA rings alarm bell on phasing out nuclear energy. Reuters).
Germany, Europe’s champion for renewable energy, seems to be having second thoughts about its ambitious push to ramp up its use of renewable fuels for power generation. Hoping to slow the burst of new renewable energy on its grid, the country eliminated an open-ended subsidy for solar and wind power and put a ceiling on additional renewable capacity.
Germany may also drop a timetable to end coal-fired generation, which still accounts for over 40% of its electricity, according to a report leaked from the country’s environment ministry. Instead, the government will pay billions to keep coal generators in reserve, to provide emergency power at times when the wind doesn’t blow or the sun doesn’t shine.
Renewables have hit a snag beyond Germany, too. Renewable sources are producing temporary power gluts from Australia to California, driving out other energy sources that are still necessary to maintain a stable supply of power.
In Southern Australia, where wind supplies more than a quarter of the region’s power, the spiking prices of electricity when the wind wasn’t blowing full-bore pushed the state government to ask the power company Engie to switch back on a gas-fired plant that had been shut down.
But in what may be the most worrisome development in the combat against climate change, renewables are helping to push nuclear power, the main source of zero-carbon electricity in the United States, into bankruptcy.
The United States, and indeed the world, would do well to reconsider the promise and the limitations of its infatuation with renewable energy.
“The issue is, how do we decarbonize the electricity sector, while keeping the lights on, keeping costs low and avoiding unintended consequences that could make emissions increase?” said Jan Mazurek, who runs the clean power campaign at the environmental advocacy group ClimateWorks.
Addressing those challenges will require a more subtle approach than just attaching more renewables to the grid.
An analysis by Bloomberg New Energy Finance, narrowly distributed two weeks ago, estimated that nuclear reactors that produce 56% of the country’s nuclear power would be unprofitable over the next three years. If those were to go under and be replaced with gas-fired generators, an additional 200 million tons of carbon dioxide would be spewed into the atmosphere every year.
The economics of nuclear energy are mostly to blame. It just cannot compete with cheap natural gas. Most reactors in the country are losing between $5 and $15 per megawatt-hour, according to the analysis.
Nuclear energy’s fate is not being dictated solely by markets, though. Policy makers focused on pushing renewable sources of energy above all else — heavily subsidizing solar and wind projects, and setting legal targets for power generation from renewables — are contributing actively to shut the industry down. Facing intense popular aversion, nuclear energy is being left to wither.
As Will Boisvert wrote in an analysis for Environmental Progress, an environmental organization that advocates nuclear energy, the industry’s woes “could be remedied by subsidies substantially smaller than those routinely given to renewables.” The federal production tax credit for wind farms, for instance, is worth $23 per megawatt-hour, which is more than the amount that nuclear generators would need to break even.
Nuclear generators’ troubles highlight the unintended consequences of brute force policies to push more and more renewable energy onto the grid. These policies do more than endanger the nuclear industry. They could set back the entire effort against climate change.
California, where generators are expected to get half of their electricity from renewables by 2030, offers a pretty good illustration of the problem. It’s called the “duck curve.” It shows what adding renewables to the electric grid does to the demand for other sources of power, and it does look like a duck.
As more and more solar capacity is fed onto the grid, it will displace alternatives. An extra watt from the sun costs nothing. But the sun doesn’t shine equally at all times. Around noon, when it is blazing, there will be little need for energy from nuclear reactors, or even from gas or coal. At 7 p.m., when people get home from work and turn on their appliances, the sun will no longer be so hot. Ramping up alternative sources then will be indispensable.
The problem is that nuclear reactors, and even gas- and coal-fired generators, can’t switch themselves on and off on a dime. So what happens is that around the middle of the day those generators have to pay the grid to take their power. Unsurprisingly, this erodes nukes’ profitability. It might even nudge them out of the system altogether.
How does a renewables strategy play out in the future? Getting more power from renewables at 7 p.m. will mean building excess capacity at noon. Indeed, getting all power from renewables will require building capacity equal to several times the demand during the middle of the day and keeping it turned off much of the time.
Daily fluctuations are not the end of it. Wind power and sunlight change with the seasons, too. What’s more, climate change will probably change their power and seasonality in unforeseen ways. Considering how expensive wind and sun farms can be, it might make sense to reconsider a strategy that dashes a zero-carbon energy source that could stay on all the time.
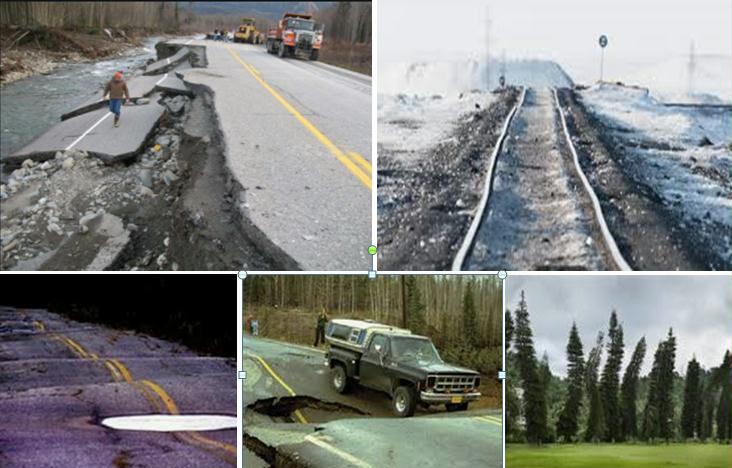
Preface. Only one exploratory well can be drilled in the short arctic summers, and many more need to be drilled to even find and then explore the size of a potential oil field to see if it is worth extracting. Drilling in the ocean can’t be done because icebergs will mow offshore rigs down (it wouldn’t surprise me if oil companies weren’t working on a dunk and dive oil rig). On land, permafrost tosses pipelines, roads, rail lines and homes areound as it expands and contracts seasonally, costing billions of dollars to fix. In fact, it costs so much to build roads and other oil infrastructure on permafrost that this is one reason not much drilling has taken place in interior Alaska, and as oil declines, becomes even less likely. The EROI of arctic oil and gas is likely to be so very low that the likely ecological damage not worth the risk.
Below are several articles about the difficulty of arctic drilling. Though Herz (2020) points out several new ways that oil and gas companies are coping.
Herz N (2020) Big oil’s answer to melting Arctic: cooling the ground so it can keep drilling. The Guardian.
It wanted to pump 160,000 more barrels of oil each day from a new project on Alaska’s North Slope. But the fossil fuels it and others produce are leading to global heating, and the Arctic is melting. The firm’s drilling infrastructure could be at risk atop thawing and unstable permafrost. A recent environmental review of the project describes the company’s solution: cooling devices that will chill the ground beneath its structures, insulating them from the effects of the climate crisis.
One Alaska company, BeadedStream, sells equipment that measures and transmits tundra temperature data, so that the oil industry can know as soon as it is frozen solid enough to transport equipment. Another firm, Arctic Foundations, is doing increasingly brisk business selling thermosiphons – the tubes that pull heat out of the ground to keep permafrost from thawing underneath oil infrastructure.
ConocoPhillips plans to make use of these devices at its massive Willow project in the National Petroleum Reserve, and it’s also building taller bridges and wider culverts to accommodate larger spring floods. The backers of another new project, meanwhile, see opportunity in the thaw. The melting of Arctic sea ice removes an obstacle from shipping liquefied natural gas off Alaska’s North Slope
Arctic National Wildlife Refuge drilling rights aren’t selling because “funding for Arctic drilling is becoming harder and harder to find. Both oil companies and banks have decided they can no longer tolerate the risk of drilling in one of the fastest-warming places on the globe. Buying the leases—which could go for as little as $5 an acre—is the cheap part of the oil exploration process. Every other step—from enlisting consultants to conduct required environmental studies to mounting industrial operations in a remote wilderness without existing infrastructure—is hugely expensive. The break-even price for the oil that companies would extract could be as high as $80 per barrel, according to Rystad Energy, a level the market hasn’t seen since October 2018. Most of today’s likely bidders would need outside financing to actually get anything out of their Arctic leases. But banks are increasingly worried about damage to their public image from backing drilling in the reserve, which 70% of American voters oppose.
The administration’s ability to mount a sale at all—much less formally issue the leases—before Trump leaves office is also in considerable doubt. Because of various requirements and mandatory waiting periods, the earliest auction date is likely Jan. 19, the day before Biden will be inaugurated. That would leave the Interior Department just one day to vet the high bidders and issue the leases, a process that typically takes two months.
Given the current economic environment, the regulatory uncertainty, and the steep public opposition to Arctic drilling, it’s not clear which oil companies would even show up for an auction. Those once viewed as potential bidders for Arctic acreage have slashed spending this year as the coronavirus pandemic eroded crude demand and prices. Even a year ago major companies would have jumped at the chance. Today, not so much.
July 2020: Funding for drilling projects in the arctic (and oilsands) is getting harder to find. The latest bank to stop lending money for these projects is Deutsche Bank, becoming the latest major bank to reconsider lending money to fossil fuel projects in sensitive areas in addition to 129 other banks representing a third of the world’s banks, with US$47 trillion in assets, to align with the Paris Climate Agreement. In the U.S. Goldman Sachs said in December 2019 that it would decline to finance new Arctic oil exploration and production and new thermal coal mine development or strip mining. Wells Fargo and JPMorgan have also said they would stop financing new oil and gas projects in the Arctic (Paraskova T. 2020. Deutsche Bank Immediately Ends Funding For Oil Sands And Arctic Oil Projects. Oilprice.com).
October 2019 (Bloomberg): Rising temperatures are a particular worry for mining, oil and gas companies. The permafrost area accounts for 15% of Russia’s oil and 80% of its gas operations. It is also home to miners including MMC Norilsk Nickel PJSC, the biggest refined nickel and palladium producer.
Russia has long built structures on piles to improve stability in the permafrost. But as the ground warms it becomes softer, and there are signs problems are increasing. Multiple new craters have also been found in the gas-rich Yamal region, which is a risk to pipelines, and some houses have had to be pulled down in Norilsk, the industrial town where Nornickel operates.
The issue may get much worse. By 2050, warming may affect about a fifth of structures and infrastructure across the permafrost area, costing some $84 billion, according to research published in February by scientists including Dmitry Streletskiy, a professor at George Washington University. That would be equal to about 7.5% of Russia’s gross domestic product. More than half of residential real estate, worth about $53 billion, might be also damaged.
May 2016: After plunking down more than $2.5 billion for drilling rights in U.S. Arctic waters, Royal Dutch Shell, ConocoPhillips and other companies have quietly relinquished claims they once hoped would net the next big oil discovery. The U.S. Arctic is estimated to hold 27 billion barrels of oil [ less than 1 year of global oil consumption] and 132 trillion cubic feet of natural gas, but energy companies have struggled to tap resources buried below icy waters at the top of the globe (Bloomberg).
November 2015: Statoil has abandoned plans to drill in the Arctic Ocean off the northwest coast of Alaska, and is giving up 16 of its leases in the Chukchi Sea as well as abandoning its stake in 50 Chukchi leases operated by ConocoPhillips.
September 2015: After spending $7 billion, Shell announced that after spending $7 billion, it was ending its Arctic effort without ever producing a single drop of oil. Shell cited disappointing results from an exploratory well drilled during the 2015 open water season 80 miles off the Alaska coast.
Offshore Arctic drilling is strongly supported by Alaska elected officials who hope to find an alternative source of oil for the trans-Alaska pipeline. The pipeline provides about 15% of U.S. oil but is operating at only 25% capacity because of declining oil production. The pipeline could turn into a giant Popsicle when the oil flowing through it drops below about 350 thousand barrels a day (it is around 500,000 now, at it’s peak around 2 million barrels a day).
NPC. MARCH 27, 2015. Draft Report Arctic Potential: Realizing the Promise of U.S. Arctic Oil and Gas Resources. National Petroleum Council.
The arctic has about 25% of all the remaining undiscovered resources globally. About 71% of it is expected to be natural gas and 29% liquids.
The majority of the U.S. Arctic potential is undiscovered and offshore.
Resource potential (not RESERVES)
Offshore: 74%, 389 Billion Barrels of Oil Equivalent( BBOE)
Onshore: 26%, 135 BBOE.
Reserve estimate: 191 BBOE of reserves (about 6 years of global oil production).
Nation
Oil
Gas
United States
34
60
Canada
15
19
Russia
36
251
Greenland
16
23
Norway
5
20
Figure ES-4. Global Arctic Conventional Oil and Gas RESOURCE in BBOE Potential by Country.
The United States is currently benefiting from resurgence in oil production fueled largely by the development of tight oil opportunities in the U.S. Lower 48. Production profiles for these oil opportunities will eventually decline by one million barrels per day by 2040 compared to 2014. If development starts now, the long lead times necessary to bring on new crude oil production from Alaska would coincide with a long-term expected decline of U.S. Lower 48 production. Alaskan opportunities can play an important role in extending U.S. energy security in the decades of the 2030s and 2040s.
The longer time frame required for U.S. Arctic projects is the result of remoteness, long supply chains, short exploration seasons due to ice, regulatory complexity, and potential for litigation.
The time frame for developing any significant offshore opportunity would likely be between 10 to 30+ years.
Myers, S.L., et al. September 8, 2015. Frozen dreams of energy in a warming arctic. New York Times.
“From an economic point of view, I’m not sure going offshore Arctic is very rational,” said Patrick Pouyanné, chief executive and president of Total, the French oil company, which once also planned to drill off Alaska’s northern coast.
“The entire cost structure up there is three to five times more expensive than onshore lower 48,” said Scott D. Sheffield, chief executive of Pioneer Natural Resources, a Texas-based oil company. Two years ago, his company gave up on a field projected to contain 100 million barrels of oil in the Beaufort Sea — drilled from a man-made island and connected by an eight-mile pipeline to Prudhoe Bay, Alaska — in order to invest more in Texas shale fields. “One-hundred-million-barrel-type discoveries will not be economical in a $100-a-barrel oil environment, and they certainly won’t be economical today,” Mr. Sheffield said.
Even optimistic projections suggest the Arctic might not prove to be as transformative as once imagined. According to Rystad Energy, a global consultancy based in Norway, production from offshore fields in or near the Arctic could double between 2015 and 2025 to 1.4 million barrels a day, which would still be less than 2 percent of current global production. “When people say the Arctic is the next frontier and there is great resource potential, of course there is the risk that it is hype,” said Jon Marsh Duesund, a Rystad senior project manager.
The extent of exploration in the Arctic will be greater and the total time required will be longer than in other areas such as the U.S. Gulf of Mexico. This is because Arctic resources are expected to be larger, but less dense and spread over broader areas than in the Gulf of Mexico, and hence require more exploratory wells to gain sufficient definition of the resource to proceed to development. Also, the resource uncertainty in frontier areas such as the Alaska OCS means that subsurface knowledge gained from each well has a great impact on future drilling decisions, compelling serial rather than concurrent exploration drilling, as the results from each well affect decisions on where and how the next should be drilled. Given the severe limitations on the length of the useful annual exploration season, the greater time required for Arctic exploration programs, and the extremely high costs of drilling in remote, icy Arctic conditions, the current 10-year lease term is inadequate to support developing Alaska’s OCS potential.
The key characteristic that distinguishes the Arctic from other oil and gas production areas is the presence of ice. The ice environment varies substantially throughout the Arctic depending on the season and the location.
There are three key physical characteristics of offshore Arctic environments that play a large role in determining the technologies that are required and the degree of complexity of operations. The dominant physical characteristic is ice type and abundance, but water depth and length of open water season also play key roles in differentiating one Arctic location from another in terms of the technology needed and the economic prospects for development.
Although summer ice coverage has decreased, winter ice coverage remains robust. Hence, ice interactions will continue to be the dominant consideration for design of offshore Arctic oil and gas facilities. Challenges include:
Landfast ice, which can extend from the shoreline out to a depth of about 15 to 20 meters. Landfast ice freezes fast to the shoreline and is relatively stable throughout the winter until the summer break-up occurs. With thicknesses approaching 2 meters, it can provide a stable platform for drilling exploration wells, transporting materials and equipment, or supporting equipment to lay pipelines to shore for shallow water developments.
Beyond the edge of the landfast ice zone is floating pack ice of varying concentrations, which, depending on the season, might range from sparse coverage near the edge to complete coverage further into the pack.
Mobile pack ice mass consists of sea ice of varying age and thickness. Depending on location, there may also be inclusions of icebergs or drifting fragments of thick, multi-year shelf ice known as ice islands. The new ice that forms over the open water each winter is called first-year ice. It typically reaches a thickness of 1.5 to 2 meters over the winter season. Wind forces compress and break the ice sheet, forming thickened ridges and rubble fields. When these thickened areas refreeze, they can become the dominant features that impede icebreaker transit and exert large forces on stationary platforms. Second-year ice is thickened ice that results from refreezing of surviving first-year ice from the previous season. Similarly, multi-year ice is built up from multiple freeze cycles of previous years of second-, third-, etc.-year ice. Multi-year ice can range in thickness from approximately 3 meters to more than 6 meters.
Icebergs are large pieces of freshwater ice that break off from glaciers and drift with sea currents. Icebergs are nearly nonexistent in the U.S. Arctic due to the lack of large glaciers terminating in the nearby ocean. While relatively rare, the U.S. Arctic does contain ice island features, which are thick tabular masses of ice that break off from Canadian ice shelves and drift with the pack.
Open Water Season
In addition to ice conditions and water depth, the length of the open water season—the time without ice coverage—has a significant impact on the types of technologies that can be used for exploration and development. The length of the open water season can vary considerably from year to year. Over most of the U.S. Chukchi Sea lease area, the average open water season is about 3 to 4 months long, but has been as short as 1 to 2 months. Mid-season incursions of pack ice from the north can occur, potentially interrupting operations. In the correspondingly shallow shelf areas of the U.S. Beaufort Sea, the open water season is typically 1 to 1.5 months shorter than in the Chukchi, and can also be interrupted by pack ice intrusions. Access into the Beaufort Sea at the start of the open water season may be impeded by high ice concentrations at Point Barrow, restricting the usable operating window in some years.
If the open water season is 3 months or more, it may be possible to complete the drilling of an exploration well in a single season using conventional technology that would be used in any open water setting. Shorter open-water seasons or deeper reservoirs may require multiple seasons to complete a single well, resulting in much higher costs for exploratory drilling. Likewise, development technology requirements become more challenging and costs increase with decreasing open water season. For example, 3 months may provide sufficient time for installation of platforms and pipelines, while shorter open water periods may necessitate special measures for platform installation and pipeline construction.
On either side of the open water season, there are periods of summer breakup/melting and fall-early winter freeze-up where some ice may be present at a drilling location. These periods are often referred to as the “shoulder” seasons, because ice coverage is reduced and the ice is either receding or newly forming. Past Arctic exploration drilling programs have successfully extended operations into the shoulder seasons by using ice management to break or guide away approaching ice that might otherwise interfere with the rig’s ability to stay in place over the well (“station-keeping”).
Operating in the shoulder season depends on the capability of the drilling rig and ice management vessels to safely contend with ice. In previous Canadian Beaufort Sea drilling programs using the Kulluk, the summer shoulder season could begin as early as late June or early July, and the winter shoulder season could extend into November or even early December. Beyond about mid-December, the ice cover becomes essentially continuous and thickness exceeds 0.7 meter. Extending the drilling season beyond mid-December would require robust station-keeping and ice management capability.
The Arctic is home to distinct indigenous peoples and provides habitat for large numbers of birds, mammals, and fishes. While some areas of the Arctic, such as the central North Slope of Alaska around Prudhoe Bay, have seen decades of economic activity, much of the region remains largely unaffected by human presence. Today, there is increasing interest in the Arctic for tourist potential, and reductions in summer ice provide an increasing opportunity for marine traffic. At the same time, there is concern about the future of the culture of the Arctic peoples and the environment in the face of changing climate and increased human activity.
The Arctic can be defined as areas north of the Arctic Circle. The United States, Canada, Russia, Kingdom of Denmark (Greenland), and Norway all have coastlines within this region, and these countries possess the majority of the resource potential.
Russia is moving forward with increased Arctic economic development during this time of change. Russia is drilling new exploration wells in the Kara and Pechora Seas and is expanding its naval and transportation fleet.
China does not have Arctic territory, but is investing millions of dollars in Arctic research, infrastructure, and natural resource development.
The United States has large offshore oil potential, similar to Russia and larger than Canada and Norway. Facilitating exploration in the U.S. Arctic would enhance national, economic, and energy security.
The cycle of leasing, exploration, appraisal, development, and production takes longer in the Arctic than in other offshore regions. For instance, Northstar, the only U.S. offshore OCS Arctic project, took 22 years from lease sale to start of production, while recent Gulf of Mexico deepwater projects such as Mars and Atlantis took 11 and 12 years respectively.
With a sustained level of leasing and exploration drilling activity over the next 15 years, offshore Alaska could yield material new production by the mid-2030s and sustain this level of production through mid-century and beyond.
Driven by onshore tight oil production, total U.S. crude oil production increased from 5 million barrels per day in 2008 to 8.5 million barrels per day in 2014, and is projected to increase to a maximum of 9.6 million barrels per day in 2019.8 Crude oil imports are expected to decline from 9.8 million barrels per day in 2008 to a minimum of 5.8 million barrels per day in 2019.
But after 2019, U.S. crude oil production is expected to decline to about 7.5 million barrels per day and imports rise to 7.7 million barrels per day by 2040. U.S. domestic crude oil production is 57% of domestic demand in 2014, but declines to 49% in 2040, reversing the improvements in the economy and energy security from the recent production increase.
The EIA includes only minimal future Alaska OCS activity and assumes decline of Alaskan fields from about 0.5 million barrels per day in 2014 to under 0.3 million barrels per day in 2040. Such a decline would mean that the operational viability of the Trans-Alaska Pipeline System (TAPS) could be challenged, potentially resulting in the loss of an additional 0.3 million barrels per day of oil production.
Water depth within the world’s prospective Arctic oil and gas basins varies from zero to more than a thousand meters. As mentioned previously, most of the U.S. Arctic offshore oil and gas potential lies in water depths of less than 100 meters. The Russian Arctic shelf is broad and shallow, with a large fraction of the area lying in water depths less than 100 meters. Water depths offshore Arctic Canada and Greenland, on the other hand, fall off to more than 100 meters closer to shore. Water depth predominantly impacts the type of drilling and production platforms that can be used and whether offshore wellheads and pipelines require burial to protect them from being damaged by moving ice keels that extend to the seafloor. Developments in ice-prone water depths less than about 100 meters are amenable to well-established technology of structures resting on the seafloor (“bottom-founded”). Beyond about 100 meters, a technology transition from bottom-founded to floating platforms may be required because the overturning forces of the floating ice become too large for practically sized bottom-founded structures. Unlike for temperate waters, where floating drilling facilities are routinely used in thousands of meters of water, suitable technology to allow year-round floating drilling in Arctic pack ice will require additional research and development before commercial use.
Although south of the Arctic Circle, Russia’s Sakhalin Island located north of Japan has been home to several developments in Arctic-like ice conditions over the past 20 years. The Sakhalin developments use a combination of offshore drilling platforms and extended-reach wells from onshore drill pads to reach the offshore reserves. The offshore platforms are among the largest ice-resistant concrete platforms ever constructed. Extended-reach wells drilled from shore out to a distance of 13 kilometers have set multiple world records for horizontal reach. The Sakhalin offshore platforms operate continuously through the winter ice conditions where they must resist forces from ice ridge features more than 30 meters in thickness. The produced oil flows back to onshore processing facilities before being carried via pipeline to export terminals. In the case of Sakhalin 1, tankers are loaded year-round at the Dekastri Terminal and are escorted by icebreakers when ice is present.
Exploration can be carried out in waters with a short ice-free season using floating drilling rigs in waters deeper than about 20 meters, but development and production generally requires year-round operation to be economic, which means using facilities that rest on the seafloor and are resistant to ice forces in ice-prone areas.
Technical feasibility is not the only consideration for successful development of oil and gas resources. Ultimately, an opportunity must be both technically and economically feasible to warrant pursuit. For development to progress, a resource opportunity of sufficient size and quality of producible oil and gas must be found. Thus, the ability to explore is the first critical step in a successful development process. Arctic exploration and development is more costly than in other areas due to remoteness, lack of infrastructure, challenging climate, and short operating seasons. Finding large, high-quality resources will be key to economically viable Arctic development.
Enabling Infrastructure
Availability of existing infrastructure to enable development and production increases the attractiveness of an opportunity. Lack of existing infrastructure increases cost and thus the economic burden on a potential development
The Arctic is characterized by its climate, remoteness, sparse population, and long distance between population centers. This has resulted in limited infrastructure development including ports, airfields, roads, rail, communication networks, and fuel and electricity delivery systems compared with other regions. To promote prudent development, additional capacity is needed. There are many synergies between the types of infrastructure that would facilitate Arctic oil and gas exploration and development and the infrastructure needs of local communities, the state of Alaska, and elements of the U.S. Armed Forces such as the Coast Guard and Navy. Investments by any party in new or upgraded airfields, ports, roads, navigational aids, satellites, radars, and communication facilities could confer wider benefits. The Coast Guard and Navy, which play key roles in the areas of safety, search and rescue, and national defense, are subject to many of the same resupply and support requirements in the Arctic as the oil and gas industry.
Local, state, and federal government agencies should coordinate infrastructure planning by carrying out, where possible, joint scenario planning to identify the intersection of mutual needs such as airfields, ports, roads, and communications to identify opportunities for investment synergies. Planning needs and considerations should include those from the oil and gas industry, Navy, Coast Guard, and local stakeholders, and include options to extend the life of the TAPS pipeline.
Undiscovered potential volumes are based on USGS 2008, Circum-Arctic Resource Appraisal. Discovered potential, reserves, and production values are provided by IHS and are approximate as of the end of 2013. 2 “Liquids” refers to crude oil and natural gas liquids. 3 IHS, International E&P Database, September 3, 2014, http://www.ihs.com/products/oil-gas/epdata/sets/international.aspx. 4 Ibid.
Billion barrels of oil, or oil equivalent for gas; 6,000 cubic feet of gas is equivalent to 1 barrel of oil. 6 “Conventional oil” refers to oil found in liquid form flowing naturally or capable of being pumped without further processing or dilution.
[Another note:But once oil shortages strike the gloves will come off, and arctic exploitation will be the least of things to worry about as America is likely to go to war with any nation that refuses to sell us oil, such as Venezuela, Ecuador, Colombia, the Middle East, and so on (Friedrichs).
Posted inArctic|Taggedarctic oil, drilling, ice|Comments Off on Getting Arctic oil and natural gas will take decades or more
Preface. This study from MIT explains why price parity of electric and gasoline vehicles is likely to take a lot longer than 5 years, and perhaps never if cars continue to depend on lithium-ion batteries. Deeper cost declines beyond 2030 are likely to require shifts from the dominant lithium-ion chemistry today to entirely different technologies, like lithium-metal, solid-state and lithium-sulfur batteries. Each of these are still in much earlier development stages, so it’s questionable whether any will be able to displace lithium-ion by 2030.
In addition, electric vehicles are more expensive. From “When Trucks Stop Running” (and yes, these figures are out of date): Cost is not a minor impediment. The average income of an electric car owner is $148,158, and of a new gasoline car $83,166, far above the median household of $51,929 (NRC 2015a). At current rates of transition from gasoline to all-electric cars and trucks, with 123,000 electric vehicles sold in 2014 (InsideEVs 2015), it would take over 2000 years to replace the nation’s fleet of 253 million vehicles), and require 980 TWh of electricity (25 % of 2008 generation) taking about 15 years to build (Smil 2010).” In 2021 the average cost of an all electric car was $56,437, gasoline $42,258.
There are other costs to consider. Forberg (2021) in “So many people are buying Teslas — but are they ready for the costly insurance?” writes that insurances costs are higher because EV cost more and are more expensive to repair. So if your premium for a gas-powered car is $1,000 a year, you’ll probably pay $1,180 to $1,320 with an electric car, according to ValuePenguin. As a luxury car, Teslas are pricier still. Motortrend found these were the average rates for a 40-year-old man with a good credit and driving record: Tesla Model 3: $2,114-$2,351, Tesla Model S: $3,673-$4,143, Tesla Model Y: $2,118-$2,227 & Tesla Model X: $3,355-$4,025. It’s also harder to find mechanics that can repair them and parts are more expensive and difficult to locate.
Don’t expect electric cars and trucks to get as cheap as their gas-powered rivals anytime soon. A new report from the MIT Energy Initiative warns that EVs may never reach the same sticker price so long as they rely on lithium-ion batteries, the energy storage technology that powers most of today’s consumer electronics. In fact, it’s likely to take another decade just to eliminate the difference in the lifetime costs between the vehicle categories, which factors in the higher fuel and maintenance expenses of standard cars and trucks.
The findings sharply contradict those of other research groups, which have concluded that electric vehicles could achieve price parity with gas-powered ones in the next five years. The lingering price difference predicted by the MIT report could stunt the transition to lower-emission vehicles, requiring governments to extend subsides or enact stricter mandates to achieve the same adoption of EVs and cuts in climate pollution.
The problem is that the steady decline in the cost of lithium-ion batteries, which power electric vehicles and account for about a third of their total cost, is likely to slow in the next few years as they approach limits set by the cost of raw materials.
“If you follow some of these other projections, you basically end up with the cost of batteries being less than the ingredients required to make it,” says Randall Field, executive director of the Mobility of the Future group at MIT. “We see that as a flaw.”
The numbers
Current lithium-ion battery packs are estimated to cost from around $175 to $300 per kilowatt-hour. (A typical midrange EV has a 60/kWh battery pack.)
A number of commercial and academic researchers have projected that the costs of such batteries will reach $100/kWh by 2025 or before, which many proclaim is the “magic number” where EVs and gas-fueled vehicles reach retail price parity without subsidies. And they would continue to fall from there.
But reaching the $100 threshold by 2030 would require material costs to remain flat for the next decade, during a period when global demand for lithium-ion batteries is expected to rise sharply, MIT’s “Insights into Future Mobility” study notes. It projects that costs will likely fall only to $124 per kilowatt-hour by then. At that point, the “total cost of ownership” between the categories would be about the same, given the additional fuel and maintenance costs of gas-fueled vehicles. (Where these lines cross precisely depends heavily on local fuel costs and vehicle type, among other factors.)
But the sticker price of an EV with 200 miles of range would still run thousands of dollars more than a comparable gas-fueled vehicle in many areas. While closing the gap on total cost of ownership would be a solid step for electric vehicles, the average consumer is very sensitive to the upfront price tag—and what it equates to in monthly payments.
Costs are likely to continue to improve as, among other things, companies reduce the level of pricey cobalt in battery components and achieve manufacturing improvements as production volumes rise. But metals mining is already a mature process, so further declines there are likely to slow rapidly after 2025 as the cost of materials makes up a larger and larger portion of the total cost, the report finds.
Deeper cost declines beyond 2030 are likely to require shifts from the dominant lithium-ion chemistry today to entirely different technologies, like lithium-metal, solid-state and lithium-sulfur batteries. Each of these are still in much earlier development stages, so it’s questionable whether any will be able to displace lithium-ion by 2030, Field says.
Gene Berdichevsky, chief executive of anode materials maker Sila Nanotechnologies, agrees it will be hard for the industry to consistently break through the $100/kWh floor with current technology.
But he also thinks the paper discounts some of the nearer-term improvements we’ll see in lithium-ion batteries without full-fledged shifts to different chemistries. By 2030, Berdichevsky expects, battery packs will be able to store significantly more energy and last many more miles on the road, which can cut costs, improve performance, and otherwise boost the relative appeal of EVs.
Driving forward
The good news is a growing number of manufacturers around the world are moving into EVs, rolling out different models at different price points.
On Sunday, Ford unveiled an electric SUV set to hit showrooms next year, dubbed the Mustang Mach E. Audi, Jaguar, Mercedes-Benz, and Tesla have all introduced battery-powered SUVs as well, catering to consumers’ tastes for larger vehicles.
But the MIT study notes that achieving deep reductions in transportation emissions will require a parallel overhaul of the electricity systems used to charge EVs. Currently, US carbon emissions per mile for a battery electric vehicle are on average only about 45% less than those from a gas-fueled vehicle of comparable size. That’s because fossil fuels still generate the dominant share of electricity in most markets, and the manufacturing process for EVs generates considerably higher emissions, mainly related to the battery production.
EVs in some US regions, notably including coal states like West Virginia, could generate nearly the same level of emissions as standard vehicles over their lives. In parts of India and China with particularly dirty electricity systems, EVs may even generate more emissions than gas-fueled vehicles, says Emre Gencer, a research scientist who worked on the study.
If EVs can’t compete directly on price in the marketplace, public policy will need to play a larger role in driving EV adoption and cutting transportation emissions.
The MIT study projects that the share of electric vehicles and plug-in hybrids will rise in any scenario, reaching 33% of the global vehicle fleet by 2050 as prices slowly decline, even with no additional climate polices. But a strong set of additional regulations, including a global carbon tax set high enough to prevent 2 ˚C of warming, would push that figure to 50% by mid-century.
That would add up to hundreds of millions of additional low-emission vehicles on the roads, and prevent 1.5 billion metric tons of carbon dioxide from reaching the atmosphere.
Preface. Politicians claim credit for a good economy, but what makes an economy prosperous? Cheap oil. During Trump’s reign “relatively cheap oil and gas are keeping the U.S. economy strong. But this cheap oil and gas is being partially subsidized by investors who are either losing money or receiving a poor return on investment. In this respect, President Trump has these financial “losers” to thank for a large part of the current health of the U.S. economy. “
Hall illustrates the relation of oil prices to the popularity of a president:
“Presidents Gerald Ford and Jimmy Carter were in office during the economically disastrous increase in the price of oil from less than $4 a barrel in 1972 to more than $35 in 1979. Both lost in their reelection bids.
In 1980 and 1984, Ronald Reagan ran on a platform of “Let’s make America Great again” and “It’s morning again in America,” which coincided with the decline in oil prices during the 1980s. In the U.K., Margaret Thatcher was floundering in popularity in 1980, but then received most of the credit for the remarkable recovery of the U.K. economy. Was it her conservative management style, or the development of the North Sea oil, which occurred on her watch? Now that the North Sea oil boom is over, the U.K. economy is struggling again.”
The media and the general public tend to give political leaders the credit, or blame, for the state of the economy. This is clearly the case with President Trump, much of whose popularity, such as it is, is based on the good health of the U.S. economy. But is the economy doing well because of Trump’s economic policies, such as the reduction of tax rates, or something else entirely that economists have missed?
There are many complex
factors that determine the state of the economy, but only one absolute
prerequisite — available and affordable energy to manufacture and move
things to market, and to transport, feed, comfort and amuse people.
In
the U.S. and the rest of the industrialized world this means
principally liquid and gaseous petroleum. For many natural scientists,
this is clearly extremely important, perhaps even dominant, in the success or failure of economies.
Despite improvements in wind and photovoltaic devices, and a decline in their manufacturing costs, our use of oil and gas continues to increase, although at a slower rate. Oil and natural gas in the U.S. are roughly half as expensive today as in Europe or Asia, or in the U.S. during the Obama years. Today, as in 1972, it is often as cheap to make things in America as elsewhere, even though our labor is more expensive. Trump’s timing from this perspective was excellent.
U.S. oil production originally peaked in 1970, and gas in 1973,
but declined through 2007, when production was revitalized by the
process of lateral drilling and “fracking.” This technological miracle
allowed us to exploit deposits formerly considered low-grade.
Now the United States produces more oil than it ever has, and is, with Saudi Arabia and Russia, one of the top three oil producers
in the world. Fracking has also reversed the long decline of U.S.
natural gas production, allowing the substitution of gas for coal and a
proliferation of cheap plastics.
But, curiously, this renaissance of petroleum in the United States has not led to a resurgence of profits in the oil and gas industry. Quite the opposite, because almost none
of the companies that have invested in fracking are turning a profit.
Investors in this industry are losing a lot of money, some $83 billion
since 2008, according to oil analyst Arthur Berman.
This situation means that relatively cheap oil and gas are keeping the U.S. economy strong. But this cheap oil and gas is being partially subsidized by investors who are either losing money or receiving a poor return on investment. In this respect, President Trump has these financial “losers” to thank for a large part of the current health of the U.S. economy.
This relation among oil supplies, prices and the political winds is not new and works both ways. Presidents Gerald Ford and Jimmy Carter were in office during the economically disastrous increase in the price of oil from less than $4 a barrel in 1972 to more than $35 in 1979. Both lost in their reelection bids.
In 1980 and 1984, Ronald Reagan
ran on a platform of “Let’s make America Great again” and “It’s morning
again in America,” which coincided with the decline in oil prices
during the 1980s. In the U.K., Margaret Thatcher was floundering in popularity in 1980, but then received most of the credit for the remarkable recovery
of the U.K. economy. Was it her conservative management style, or the
development of the North Sea oil, which occurred on her watch? Now that
the North Sea oil boom is over, the U.K. economy is struggling again.
So again the U.S. economy is booming, continuing to grow since the large economic contraction of 2008, which in turn followed the brief but dramatic oil price spike to $140 a barrel that had occurred earlier in that year. There is a significant correlation
between energy prices and presidential popularity. While oil price is
not the only predictor, it is too often ignored in our personality- and
social media-driven world (which, of course, is underwritten by fossil
fuels).
Ironically, President Trump’s prospects there are tied
in part to American investors being willing to continue to lose money
seeking shale oil.
Charles Hall is professor emeritus at SUNY
College of Environmental Sciences and Forestry in Syracuse, N.Y., and
author of 14 books and 300 scientific articles related to energy,
environment and economics.
Preface. Long before Russia bombarded the U.S. with fake news in the 2016 election campaign, Ukraine was the target, where Russia honed its propaganda skills. The parallels with their fake news assault on the U.S. are striking, perhaps if more people were aware of how Russia attacked Ukraine with propaganda (and their own citizens) they might be better able to spot lies in Facebook and other social media here. The tactics are similar.
Ukrainians now have a news show “StopFake” that’s as popular as 60 minutes is in the U.S., exposing Russian fake news and conspiracy theories using evidence. This helps to build the critical thinking skills of its citizens and protect them from fake news by recognizing it when they see it.
Check out StopFake here, this is a really good show. We have nothing like it, our TV news is too entertainment oriented and full of short pieces to cope with our short attention span. https://www.stopfake.org/en/main/
If only the U.S. had a show dedicated to fake news that explains why it’s false.
Below are excerpts from two articles about Russian propaganda in the Ukraine.
In 2013 at least 100,000 protestors demonstrated against Kremlin-backed president Viktor Yanukovych distancing the nation from the EU. A three month struggle to pull Ukraine from Russia’s grip began. Kremlin-backed bloggers and trolls launched a torrent of fake news to discredit the protests. “I would go online and I would see tons of stories that never happened circulating,” Kruk told me. Social media accounts called her stupid, advocated for her arrest, and said she should be raped.
Eventually, Yanukovych was overthrown. But soon after, Russian troops swarmed eastern Ukraine and Crimea. The faculty at the Mohyla School of Journalism believed that Russia was using TV stations and news outlets like weapons. “When we started to work we noticed that it was very systematic. It’s not just misinformation,” Fedchenko said. “It’s disinformation.”
Ukraine is often a laboratory for the Kremlin to experiment with propaganda and cyber-attacks that they later aim at the west. Before Russian intelligence agents hacked Hillary Clinton’s emails during the 2016 presidential elections, the Kremlin perfected the tactics in Ukraine, targeting government websites and individuals. Before the web of Russian-backed social media bots and trolls targeted American politics, they infested Ukrainian politics.
“Russia wants to portray Ukraine’s elections as illegitimate and portray it as a failed state,” Kateryna Kruk, the host of StopFake’s TV show (started in 2014), in which she airs and dissects the last week’s propaganda, told me in early March. “Instead of promoting pro-Russian candidates they are promoting mistrust of the entire system.
StopFake has expanded to publish articles in 11 languages and monitors Russian propaganda in France, Spain, and Germany.
During the 2019 election there were too many manipulations for the staff to keep track of.
About 74 percent of Ukrainians say that TV is their primary source of news. (By comparison, a recent Pew poll said that 44 percent of Americans prefer TV, which is still the most popular medium.) Most of the largest TV stations are owned by oligarchs. Their airwaves are filled with opinion-laden punditry that serves two purposes—propelling the owners’ political interests and keeping costs down.
At the center of the Russian web are Kremlin-owned and -allied TV stations like NTV, Russia 1, and RT. These channels feature Putin-aligned guests and are followed by the country’s media elite. For instance, Russian political scientist Dmitry Kulikov spoke on a state-owned TV channel about the ongoing Ukrainian elections. “It does not matter who will win, because this victory will have nothing to do with the will of the people,” Kulikov said.
The TV stations and websites in both Russia and Ukraine then parrot those messages, he said. For example, the Russian-based website Ukraine.ru cited a poll it said showed the overwhelming majority of Ukrainians didn’t believe in the integrity of the elections. Dmytro Dmitruk, who was part of the team that conducted the poll, said that it had, in fact, said the opposite—that many Ukrainians were so concerned to eliminate fraud that protests were possible.
Social media makes Russia’s task easier. On Facebook, Russian influence was ubiquitous in the run-up to the first round of elections. Facebook and Instagram pages that were set up by Russian individuals portrayed Ukrainian schools as unhealthy, spread false news about protests and disinformation about NATO. Many targeted Poroshenko, the president.
Some of the pages were uncovered and eventually shut down by Facebook after it received a tip from American law enforcement officials. Facebook, which pledged in January 2019 to get tough on foreign political advertising and introduce other transparency measures, implemented them just 13 days before the first round of voting. And just days before the final vote, nearly 2,000 additional Russian-pages were found, many of which targeted Ukrainian politics.
Commentators and networks backed by Russia receive financial contributions or special access to public projects, Fedchenko says. In the effort to combat Russian-propaganda, Ukraine has banned at least 77 out of 82 Russian TV stations from the country. In 2017, Ukraine banned the Kremlin-connected social networking site VKontakte—similar to Facebook. Fedchenko believes that other governments should do the same. “Russian disinformation is basically masquerading as the real media which invokes the freedom of speech clause,” Fedchenko says. “Definitely the First Amendment should not be used for them.”
Yuhas, A. 2019. Russian propaganda over Crimea and the Ukraine: how does it work? The Guardian.
By shutting down independent press, Russia controls more of the story; by spreading half-truths and rumors, the Kremlin not only confuses opponents but also sows unwitting support for its cause; finally, by pushing the boundaries with its version of events, Moscow’s leadership can force other countries to play by its own very pliable rules.
Win the “information war”, as one Russian MP calls it, and you can gain the upper hand without ever firing a shot.
ladimir Putin’s Kremlin has been silencing independent voices one at a time for months, effectively dismantling the press. In December, Putin ordered the “restructure” of the state-owned but historically independent RIA Novosti – liquidating most of the outlet, merging its remains with Russia Today and installing as editor in chief Dmitry Kiselyov, a TV presenter notorious for saying gay people’s hearts should be incinerated and playing up how Russia can turn the US into “radioactive ash”.
RIA was just the first. Dozhd, the country’s last independent TV channel, was “pushed off a cliff”right before the Winter Olympics. Then the radio station Ekho Moskvy had its director replaced by its owner, the state-controlled energy company Gazprom. Most recently, the editor-in-chief of Lenta.ru, a highly respected, independent news site, was suddenly replaced with a pro-Kremlin editor, a move apparently made through back channels with the site’s conglomerate owner.
The Kremlin’s tighter grip on the media has coincided with the rise of Russia Today, which unapologetically skews news in Putin’s favor.
Putin, for whom recent events in Kiev have been not only unfavorable but a threat, wants to rebrand history in such a way that it protects him. To that end, a constant theme spouting from Russian sources has been the Ukrainian revolution’s alliance with “fascists” – a vague word that’s become a catchall for anti-Semites, terrorists, insurgents, anarchists and thugs.
Though there were nationalists and far-right nationalists among Kiev’s protesters, and there are some in the new interim government, there decidedly weren’t and aren’t many – if any – bona fide fascists. This line has been both taken up and debunked (thoroughly), but any discussion of fascists at all is a Kremlin win. If you’re busy trying to decide how anti-Semitic Ukraine’s right wing is, then you’re not busy watching Russian soldiers slip across the border. (Ukraine’s chief rabbi is stalwartly pro-Kiev, by the by, and has taken up propaganda-busting, pointing out that the diverse anti-Yanukovych coalition is now anti-Putin.)
Fear of fascists goes a long way in Ukraine, which suffered in the second world war. By definition, fear (“Fascists are coming for your family!”) and confusion (“Fascists? Are there fascists? What’s a fascist?”) matters much more in propaganda than truth (not so many fascists). It doesn’t have to make sense – in fact it’s better if it doesn’t. Incoherent theories of a gay, Jewish, Muslim fascist conspiracy in Kiev don’t matter so long as they’re riling someone up.
Skewed facts, half-truths, misinformation and rumors all work in the propagandist’s favor. By reminding everyone of a real military agreement, you can profess innocence while having military “exercises” overstepping their bounds. By removing insignias from Russian uniforms, you can pretend as long as you like that soldiers with Russian guns and vehicles, speaking Russian and occasionally admitting they’re Russian, are merely local “self-defense” bands.
By spreading talk of fascists, of gangs of unknown armed men, of coups and self-determination and persecution – while sending armed men into Ukraine, egging on real and staged protests, bribing politicians and blocking the media – the Kremlin is enacting and realizing its propaganda on the ground. The Ukrainian government and military has shown remarkable restraint in not falling for the ploy, but Putin appears prepared to increase the pressure,