Failing states, collapsing systems: biophysical triggers of political violence

Preface. In this post I summarize the sections of Nafeez’s book about the biophysical factors that bring nations down (i.e. climate change drought & water scarcity, declining revenues after peak oil, etc.) The Media tend to focus exclusively on economic and political factors.

My book review is divided into 3 parts:

  • Why states collapse for reasons other than economic and political
  • How BioPhysical factors contribute to systemic collapse in Syria, Yemen, Iraq, Saudi Arabia Egypt, Nigeria
  • Predictions of when collapse will begin in Middle East, India, China, Europe, Russia, North America

In my opinion, war is inevitable in the Middle East where over half of oil reserves exist.  Oil is life itself.  If war happens,  collapse of the Middle East, India, and China could happen well before 2030.  If nuclear weapons are used, most nations collapse from the nuclear winter and ozone depletion that would follow.   Indonesia blew up their oil refineries to keep Japan from getting oil in WWII. If Middle Eastern governments or terrorists do the same after they’re attacked, that brings on the energy crisis sooner.  Although this would leave some high EROI oil in the ground, the energy to rebuild refineries, pipelines, oil rigs, roads, and other infrastructure would lower the EROI considerably.

Related Posts:

Alice Friedemann  www.energyskeptic.com  Author of Life After Fossil Fuels: A Reality Check on Alternative Energy; When Trucks Stop Running: Energy and the Future of Transportation”, Barriers to Making Algal Biofuels, & “Crunch! Whole Grain Artisan Chips and Crackers”.  Women in ecology  Podcasts: WGBH, Jore, Planet: Critical, Crazy Town, Collapse Chronicles, Derrick Jensen, Practical Prepping, Kunstler 253 &278, Peak Prosperity,  Index of best energyskeptic posts

***

Ahmed, Nafeez. 2017. Failing States, Collapsing Systems BioPhysical Triggers of Political Violence. Springer.

1) Why states collapse for reasons other than economic and political

Since the 2008 financial crash, there’s been an unprecedented outbreak of social protest: Occupy in the US and Western Europe, the Arab Spring, and civil unrest from Greece to Ukraine, China to Thailand, Brazil to Turkey, and elsewhere. Sometimes civil unrest has resulted in government collapse or even wars, as in Iraq-Syria and Ukraine- Crimea. The media and experts blame it on poor government, usually ignoring the real reasons because all they know is politics and economics.

In the Middle East, experts should also talk about geology.  Oil-producing nations like Syria, Yemen, Egypt, Nigeria, and Iraq have all reached peak oil and declining government revenues after that force rulers to raise the prices of food and oil.  This region was already short on water, and now climate change (from fossil fuels) is making matters much worse with drought and heat waves causing even greater water scarcity, which in turn lowers agricultural production.  Many of these nations have some of the highest rates of population growth on earth at a time when resources essential to life itself are declining.

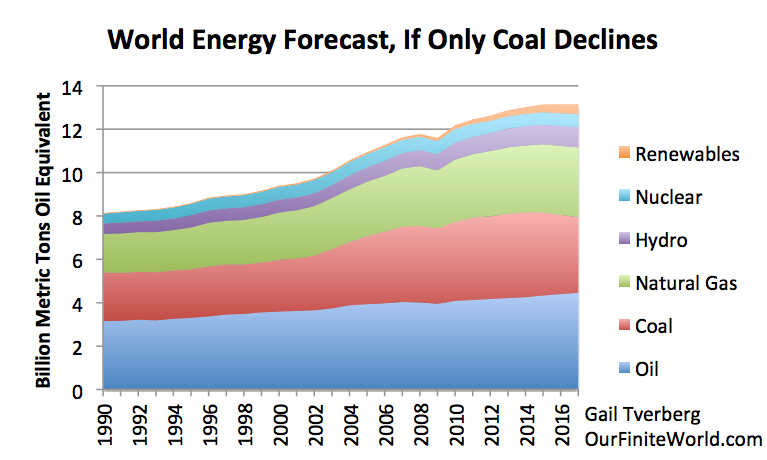
The few nations still producing much of the oil – Russia, Saudi Arabia, and the U.S. are about to join the club and stop exporting oil so they can provide for their domestic population.

Ahmed points out that “because these and other factors are so nested and interconnected, even small perturbations and random occurrences in one can amplify effects on other parts of the system, sometimes in a feedback process that continues.  If thresholds are reached, these tipping points can re-order the whole system”.  These ecological and geological factors result in social disorder, which makes it even harder for government to do anything, such as putting more money into water and food production infrastructure, which accelerates climate change and energy decline impacts, which leads to even more violence at an accelerating rate until state failure.

2) How BioPhysical factors contribute to systemic collapse in Syria, Yemen, Iraq, Saudi Arabia Egypt, Nigeria


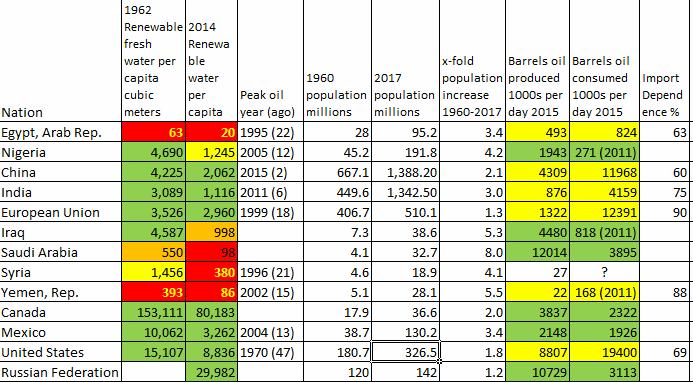
Table 1. Overview of biophysical factors (water scarcity, peak oil, population) for nations Ahmed discusses in this book. Sources: Renewable internal freshwater resources per capita (cubic meters). Worldbank. Year of Peak oil: The Oil Production Story: Pre- and Post-Peak Nations peak-oil.org, Table 11.5  World Crude Oil Production, 1960-2006 from EIA-DOE 1960-2006, Total Petroleum and Other Liquids Production 2016 (slide the year bar from 2014 to 2016), Total petroleum and other liquids by country, download

The UN defines a region as having now water scarcity above 1700 cubic meters per capita (green).  Water stressed nations have 1000 to 1700 cubic meters per capita (yellow).  Water scarcity is 500-1000 per capita (orange) and absolute water scarcity 0-500 (red).  Countries already experiencing water stress or far worse include Egypt, Jordan, Turkey, Iraq, Israel, Syria, Yemen, India, China, and parts of the United States. Many, though not all, of these countries are experiencing protracted conflicts or civil unrest (Patrick 2015).

SYRIA

The media portray warfare in Syria as due to the extreme repression of President Bashar al-Assad and the support he receives from Russia.  Although there has been awareness that climate change drought played a role in causing conflict, there is no recognition that peak oil was one of the main factors.

Here’s a quick summary of how peak oil and consequent declining revenues from oil production, rising energy and food prices, drought, water scarcity, and population growth led to social unrest, violence, terrorism and war.

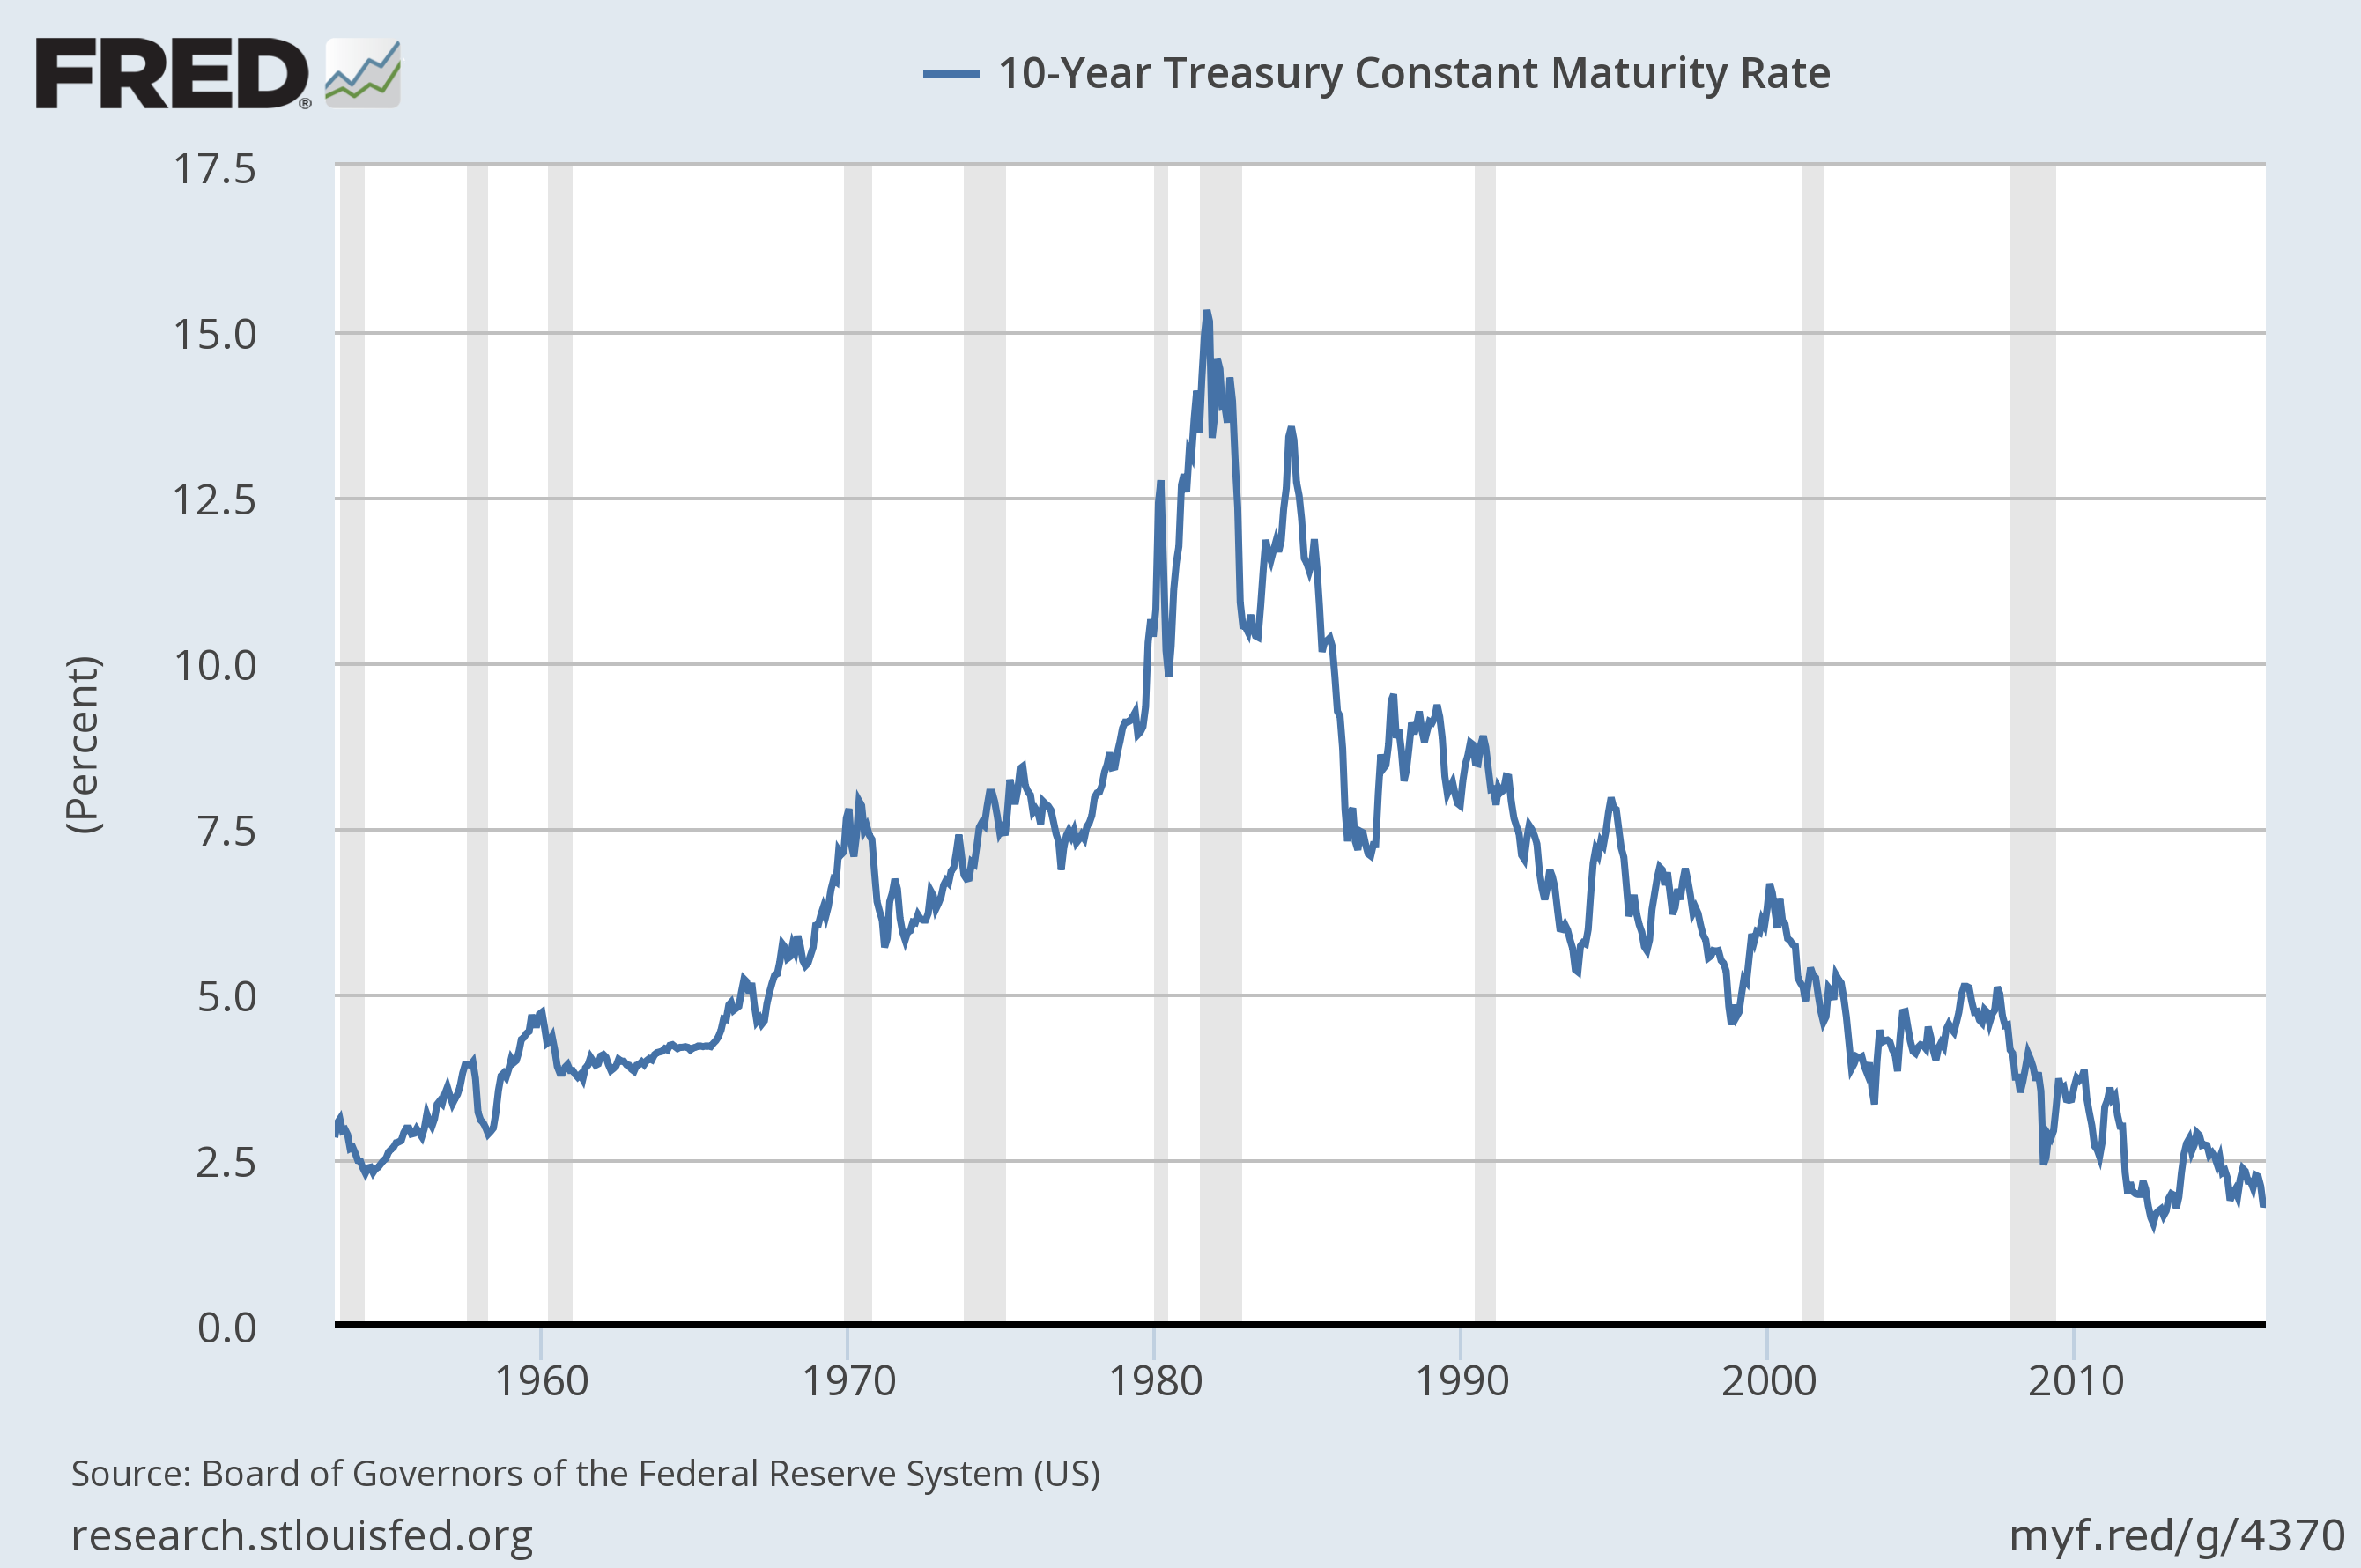
It shouldn’t be surprising that peak oil in 1996 triggered the tragic events we see today.  After all, the main source of Syrian revenue came from their production of 610,000 barrels per day (bpd).  By 2010 oil production had declined by half. Falling revenues caused Syria to seek help from the IMF by 2001, and the onerous market reform policies required resulted in higher unemployment and poverty, especially in rural Sunni regions, while at the same time enriching and corrupting ruling minority Alawite private and military elites.

In 2008 the government had to triple oil prices resulting in higher food prices. In 2010 food prices rose even more due to the global price of wheat doubling in 2010-2011. On top of that, the 2007-2010 drought was the worst on record, causing widespread crop failures. This forced mass migrations of farming families to cities (Agrimoney 2012; Kelley et al. 2015). The drought wouldn’t have been so bad if half the water hadn’t been wasted and overused previously from 2002 to 2008 (Worth 2010). All of these violence-creating events were worsened by one of the highest birth rates on earth, 2.4%.  Most of the additional 80,000 people added in 2011 were born in the hardest-hit drought areas (Sands 2011).

Rinse and repeat.  Social unrest and violence led to war, oil production dropped further, so there is even less money to end unrest with subsidized food and energy or more employment, aid farmers, and build desalination plants.

Syria, once able to feed its people, now depends on 4 million tonnes of grain imports at a time when revenues continue to drop.  Syrian oil production didn’t really take off until 1968 when there were 6.4 million people.  Since oil revenues allowed their population to explode, another 13.6 million have been born.

IRAQ

Like Syria, Iraq’s agricultural production has been reduced by heat, drought, heavy rain, water scarcity, rapid population growth, and the inability of government to import food and provide goods and services as oil revenues decline.  ISIS has worsened matters and filled in the gaps of state-level failure.  Peak oil is likely by 2025.  Or sooner given the ongoing war, lack of investment to keep existing production flowing, and low oil prices (Dipaola 2016).

YEMEN 

Like Syria, Iraq, and Iran, Yemen has long faced serious water scarcity issues. The country is consuming water far faster than it is being replenished, an issue that has been identified by numerous experts as playing a key background role in driving local inter-tribal and sectarian conflicts (Patrick 2015).

Yemen is one of the most water-scarce countries in the world. In 2012, the average Yemeni had access to just 140 cubic meters of water a year for all uses and just three years later a catastrophic 86 m3, far below the 1000 m3 level minimum requirement standards.    Cities often only have sporadic access to running water— every other week or so.  Sanaa could become the first capital in the world to run out of water (IRIN 2012).

Yemen reached peak oil production in 2001, declining from 450,000 barrels per day (bbd) to 100,000 bpd in 2014, and will be zero by 2017 (Boucek 2009).   This has led to a drastic decline in Yemen’s oil exports, which has eaten into government revenues, 75% of which had depended on oil exports. Oil revenues also account for 90% of the government’s foreign exchange reserves. The decline in post-peak Yemen state revenues has reduced the government’s capacity to sustain even basic social investments. When the oil runs out … the capacity to sustain a viable state-structure will completely collapse.

Yemen has 25 million people and an exorbitantly high growth rate and expected to double by 2050. In 2014 experts warned that within the next decade, these demographic trends would demolish the government’s ability to meet the population’s basic needs in education, health and other essential public services. This is already happening to over 15 million people (Qaed 2014).  Over half the Yemeni population lives below the poverty line, and unemployment is at 40% (60% of young people).

To cope, too many people have turned to growing qat (a mild narcotic) on 40% of Yemen’s irrigated land, increasing water use to 3.9 billion cubic meters (bcm), but the renewable water supply is just 2.5 bcm. The 1.4 bcm shortfall is made up by pumping water from underground water reserves that are starting to run dry.

Energy, overpopulation, drought, water scarcity, poverty, and a government unable to do much of anything without oil revenue is in a downward loop of social tensions, local conflicts and even mass displacements.  This in turn adds to the dynamics of the wider sectarian and political conflicts between the government, the Houthis, southern separatists and al-Qaeda affiliated militants.

Violence undermines food security, feeding back into the downward spiraling loop.  Making matters worse is that rain-fed agriculture has dropped by about 30% since 1970, making Yemen ever more food import dependent at a time when revenues are shrinking. The country now imports over 85% of its food, including 90% of its wheat and all of its rice (World Bank 2014). Most Yemenis are hungry because they can’t afford to buy food, which also rises in price when global prices rise.  The rate of chronic malnutrition as high as 58%, second only to Afghanistan (Arashi 2013).

Epidemic levels of government corruption, mismanagement and incompetence, have meant that what little revenue the government receives ends up in Swiss bank accounts.  With revenues plummeting in the wake of the collapse of its oil industry, the government has been forced to slash subsidies while cranking up fuel and diesel prices. This has, in turn, cranked up prices of water, meat, fruits, vegetables and spices, leading to fuel and food riots (Mawry 2015).

Is Saudi Arabia Next?

Summary: Within the next decade, Saudi Arabia will become especially vulnerable to the downward feedback loop of peak oil.  The most likely date for peak oil is 2028 (Ebrahimi 2015). But because the Saudi exports have been going down since 2005 at 1.4% a year as their own population rises and consumes more and more, world exports could end as soon as 2031 (Brown and Foucher 2008).

Saudi revenues will decline to zero, so the Saudis will be less able to buy their way out of food shortages.  Their own food production will drop as well from drought and water scarcity — the kingdom is one of the most water scarce in the world, at 98 m per inhabitant per year.

Most water comes from groundwater, 57% of which is non-renewable, and 88% of it goes to agriculture. Desalination plants produce 70% of the kingdom’s domestic water supplies. But desalination is very energy intensive, accounting for more than half of domestic oil consumption. As oil exports run down, along with state revenues, while domestic consumption increases, the kingdom’s ability to use desalination to meet its water needs will decrease (Patrick 2015; Odhiambo 2016).

According to the Export Land Model (ELM) created by Texas petroleum geologist Jeffrey J Brown and Dr. Sam Foucher, the key issue is the timing of when there will be no more exports because the domestic population of oil producing nations is using it all for domestic consumption.   Brown and Foucher showed that the tipping point to watch out for is when an oil producer can no longer increase the quantity of oil sales abroad because of the need to meet rising domestic energy demand.

Saudi Arabia is the region’s largest energy consumer. Domestic demand has increased 7.5% over the last 5 years, mainly due to population growth. Saudi population may grow from 29 million people now to 37 million by 2030, using ever more oil and therefore less available for export.

Declining Saudi peak oil exports will affect every nation on earth that imports Saudi oil, especially top customers China, Japan, the United States, South Korea, and India.  As Saudi oil declines, there will be few other places oil for importing nations to turn to, since other exporting nations will also be using their oil domestically.

A report by Citigroup predicted net exports would plummet to zero in the next 15 years. This means that 80% of money from oil sales the Saudi state depends on are trending downward, eventually terminally (Daya 2016). In this case, the peak oil production date could happen far before 2028, as well as violent social unrest, since so far, Saudi Arabia’s oil wealth, and its unique ability to maintain generous subsidies for oil, housing, food and other consumer items, has kept civil unrest at bay. Energy subsidies alone make up about a fifth of Saudi’s gross domestic product. But as revenues are increasingly strained by decreasing exports after peak oil, the kingdom will need to slash subsidies (Peel 2013).  Even now a quarter of the Saudi’s live in poverty, and unemployment is 12%, especially young people who have a 30% unemployment level.

Saudi Arabia is experiencing climate change as temperatures rise in the interior and far less rainfall occurs in the north.  By 2040, local average temperatures are expected to increase by as much as 4 °C at the same time rain levels are falling, resulting in more extreme weather events like the 2010 Jeddah flooding when a year of rain fell in 4 hours.  The combination could dramatically impact agricultural productivity, which is already facing challenges from overgrazing and unsustainable industrial agricultural practices leading to accelerated desertification (Chowdhury 2013).

80% of Saudi Arabia’s food requirements are purchased through heavily subsidized imports.  Without the protection of oil revenue subsidies, and potential rises in the global prices of food (Taha 2014), the Saudi population would be heavily impacted. But with net oil revenues declining to zero—potentially within just 15 years—Saudi Arabia’s capacity to finance continued food imports will be in question.

Egypt

Like Syria, Egypt has had increasing problems paying for food, goods, and services after peak oil in 1993 while at the same time population keeps growing.   Worse yet, there are no oil revenues at all, because since 2010 the population has been using more oil than what is produced and has had to import oil, with no oil revenues to pay for food, goods, and services.  Two-thirds of Egypt’s oil reserves have likely been depleted and oil produced now is declining at 3.4% a year.

Nor are there revenues coming from natural gas sales made up for the loss of oil revenues.  Over the past decade domestic use nearly doubled to consumption of nearly all the production (Kirkpatrick 2013a).

The Egyptian population since 2000 has grown 21% to 80 million $$$ more than that! people and isn’t slowing down, with 20 million more expected over the next 10 years.  A quarter are children half of them living in poverty and unemployed  (EI 2012) at the same time the elites have grown wealthier from IMF and World Bank policies.

In the 1960s there were 2800 cubic meters of water per capita, now just 660 – well below international the standard of water poverty of 1000 per person (Sarant 2013).   Water scarcity and population growth lave led to tens of thousands of hectares of farmland to be abandoned.  There is some water that can be obtained, but most farmers can’t afford the price of diesel fuel to power pumps  (Kirkpatrick 2013b)

Egypt was self-sufficient in food production in the 1960s but now imports 70% of its food (Saleh 2013). One of the many reasons Mubarak fell was the doubling of wheat prices in 2011 since half of Egypt’s people depend on food rations.  But the democratically-elected Muslim Brotherhood party and their leader Morsi couldn’t alleviate declining government revenues due to the biophysical realities of food, water, and energy shortages either.  Morsi desperately tried to get a $4.8 billion IMF loan by slashing energy subsidies and raising sales taxes, but the economic crisis made it hard to make the payments and wheat imports dropped to a third of what was imported a year ago.

This led to Morsi being ousted by army chief Abdul Fateh el-Sisi in a coup.  Like his predecessors, El-Sisi has also been unable to meet IMF demands for increased hydrocarbon production and has resorted to unprecedented levels of brutal force to crush protests. He has also rationed electricity, which led to key industries cutting production, leading to further economic losses, declining exports and foreign reserves.  Without more money, energy companies can’t be paid, so energy production continues to drop, and debt goes up, reducing the value of Egyptian currency and higher costs for imports and shortages of energy for industrial production. Egypt’s energy and economy find themselves caught in an amplifying feedback loop (Barron 2016).

How Boko Haram arose in Nigeria

Nigeria’s climate change has led to water and land shortages from desertification, which in turn has led to illness, hunger, and unemployment followed by conflict (Sayne 2011).

Perhaps the Boko Haram wouldn’t have arisen, if the Maitatsine sect in northern Nigeria hadn’t been hit so hard by ecological disasters.  To survive they fanned out to search for food, water, shelter, and work (Sanders 2013).  Niger and Chad refugees from drought and floods also became Boko Haram foot soldiers, some 200,000 displaced farmers and herdsmen.

In northern Nigeria, where Boko Haram is from, about 70% of the population subsists on less than a dollar a day. As noted by David Francis, one of the first western reporters to cover Boko Haram: “Most of the foot soldiers of Boko Haram aren’t Muslim fanatics; they’re poor kids who were turned against their corrupt country by a charismatic leader” (Francis 2014)

The Nigerian military sees a correlation between regional climatic events, and an upsurge in extremist violence: “It has become a pattern; we saw it happen in 2006; it happened again in 2008 and in 2010. President Obasanjo had to deploy the military in 2006 to Yobe State, Borno State and Katsina State. These are some of the states bordering Niger Republic and today they are the hotbeds of the Boko Haram” (Mayah 201).

Drought caused desertification is decreasing food production, in turn leading to “economic decline; population displacement and disruption of legitimized authoritative institutions and social relations.” The net effect was an acceleration of the attractiveness of groups like “Boko Haram and other forms of Jihadi ideology,” resulting in escalating “herder-farmer clashes emanating from the north since 1980s” (Onyia 2015).

The rapid spread of Boko Haram also coincided with the Lake Chad’s shrinking from 25,000 square km in 1963 to less than 2500 square km today, mainly due to climate change. At this rate, Lake Chad is will dry up in 20 years, and has already caused millions of people to lose their livelihoods.

The government has exacerbated problems by cutting fuel subsidies, which led to fuel shortages, angering the public who engaged in civil unrest  (Omisore 2014).

A senior Shell official said that crude oil production decline rates are as high as 15–20%.  But Nigeria doesn’t have the money to explore to find more oil to offset this high decline rate. Nigeria’s petroleum resources department said that Nigeria had reached a plateau of production in the Niger Delta and were already going down (Ahmed 2014).

About $15 billion of investment is required just to maintain current production levels and compensate for a natural decline in production of about 250,000 b/d each year. A 2011 study by two Nigerian scholars concluded that “there is an imminent decline in Nigeria’s oil reserve since peaking could have occurred or just about to occur (Akuru and Okoro 2011). A 2013 report backs this up, finding that Nigeria’s crude oil production has decreased since its peak in 2005, largely due to the impact of internal conflicts, leading to the withdrawal of oil companies and lack of investments. Since then production has fluctuated along a plateau. The UK Department for International Development report noted that new offshore fields might bring additional oil on-stream, surpassing the 2005 peak—but also noted that rising domestic demand “at some point in the future may cut into the amount of oil available for export” (Hall et al. 2014).

POPULATION. With Nigeria’s population expected to rise from 160 to 250 million by 2025 and oil accounting for some 96% of export revenue as well as 75% of government revenue, the state has resorted to harsh austerity measures. Sharp reductions in public spending, power cuts, fuel shortages and conditional new loans will probably widen economic inequalities and further stoke the grievances that feed groups like Boko Haram in the North. With domestic oil production decline undermining Nigeria’s oil export revenues and consequent fuel subsidy cuts, the public grows poorer and increases the number of young men more likely to join Islamist terrorist groups.

3) Predictions of when collapse will begin in Middle East, India, China, Europe, Russia, North America

When will  Middle-East oil producing nations fail?

Ahmed says that so far after peak oil production, Middle-Eastern economies have declined as revenues declined, leading to systemic state-failure in roughly 15 years, more or less, depending on how hard hit a nation was by additional (climate-change) factors such as drought, water scarcity, food prices, and overpopulation.

Saudi Arabia, and much of the rest of Arabian Gulf peninsula, may experience state-failure well within 10 to 20 years. If forecasts of Saudi oil depletion are remotely accurate, then by 2030 the country will simply not exist as we know it. Coupled with the accelerating impacts of climate-induced water scarcity, the Kingdom is bound to begin experiencing systemic state-failure at most within 20 years, and probably much earlier.

Marin Katusa, chief energy strategist at Casey Research, reports that “many Middle Eastern countries may stop exporting oil and gas altogether within the next few years, while some already have” (Katusa 2016). Oil analysts at Lux Research estimate that OPEC oil reserves may have been overstated by as much as 70%. True OPEC reserves could be as low as 429 billion barrels, which could mean a global net export crunch as early as 2020 (Lazenby 2016).

The period from 2020 to 2030 will see Middle East oil exporters experiencing a systemic convergence of energy and food crises.

When will India & China collapse?

India and China are widely assumed to be the next superpowers, but at this stage of energy and resource depletion, can’t possibly mimic the exponential growth of the Western world.

India, South Asia, and China face enormous ecological challenges Irregularities in the pattern of monsoon rains and drought are likely to lower food production and increase water scarcity, while higher temperatures will increase the range of vector-borne diseases such as malaria and become prevalent year-round (DCDC 2013). As sea levels rise, millions of people will be displaced permanently.

These impacts will unravel regional political and economic order well within 20 years and manifest at first as civil unrest.  Depending on how the Indian and Chinese states respond, it is likely that these outbreaks of domestic disorder will become more organized, and will eventually undermine state territorial integrity before 2030.  Near-term growth will further undermine environmental health and deplete resources, making these nations even more vulnerable to climate and food crises.

European and Russian collapse timeframe

Within Europe, resource depletion has meant that the European Union as a whole has become increasingly dependent on energy imports from Russia, the Middle East, Central Asia and Africa. Yet exports from these regions will become tighter as major oil producers approach production limits.

The geopolitical turmoil that has unfolded in Ukraine provides a compelling indication that such processes are rapidly moving from the periphery of the global system into the core. For the most part, the Euro-Atlantic core—traditionally representing the most powerful sections of the world system—has insulated itself from global crisis convergence impacts by diversifying energy supply sources. However, there is only so much that diversification can achieve when the total energetic and economic quality of global hydrocarbon resource production is declining.

Post-2030–2045

Faced with these converging crises, the Euro-Atlantic core will continue to see the creation of cheap debt-money through quantitative easing as an immediate solution to generate emergency funds to stabilize the financial system and shore-up ailing industries. This will likely play out in one of these business-as-usual scenarios:

  1. The lower resource quality (EROI) of the global energy system may act as a fundamental geophysical ceiling on the capacity of the economy to grow. It may act as an invisible brake on growth in demand, so fossil fuel prices would remain at chronically low levels, endangering the profitability of the fossil fuel industries. This would lead to an acceleration of the demise of the fossil fuel industries, which could lead to debt-defaults across industries in the financial system. Declining hydrocarbon energy production would cause a self-reinforcing recessionary economic process. This would escalate vulnerability to water, food and energy crises and hugely strain the capacity of European and American states to deliver goods and services to even their own populations, and other nations dependent as much on importing food as they are oil.
  2. Scarcity of net exports on the world market may raise oil prices and provide some sectors of ailing fossil fuel industries to be profitable again. But previous slashing of investments and cutbacks in exploration will mean that only the most powerful sections of the industry would be able to capitalize on this, which means production is unlikely to return to former high levels. Price spikes would trigger economic recession, causing a drop in demand, while lower production levels would exacerbate the economy’s inability to grow substantially, if at all. In effect, the global economy would likely still experience a self-reinforcing recessionary economic process.

In both scenarios, escalating economic crises are likely to invite the Euro-Atlantic core to respond by using debt-money to shore-up as much of the existing core financial and energy industries as possible. Prices spikes and shortages in water, food and energy would be experienced by general populations as a dramatic lowering of purchasing power, leading to an overall decrease in quality of life, an increase in poverty, and a heightening of inequality. This would undermine their internal cohesion, giving rise to new divisive, nationalist and xenophobic movements, and lead states into a tightening spiral of militarization to police domestic order. As instability in the Middle East and elsewhere intensifies, manifesting in further unrest, political violence and terrorist activity, states will also be drawn increasingly into short- sighted military solutions. In particular, scarcity of net oil exports on the world market will heighten geopolitical and military competition to control and/or access the world’s remaining hydrocarbon energy resources. With the Middle East still holding the vast bulk of the world’s reserves, the region will remain a central flashpoint for such competition, even as major producers such as Saudi Arabia approach systemic state-failure due to reaching inevitable production declines.

It is difficult to avoid the conclusion that as we near 2045, the European and American projects will face escalating internal challenges to their internal territorial integrity, increasing the risk of systemic state-failure. Likewise, after 2030, Europe, India, China (and other Asian nations) will begin to experience symptoms of systemic state-failure.

References

Adel, Mohamed. 2016. Eni to Increase Zohr Field Gas Production to 2bn Cubic Feet Per Day by End of 2019. Daily News Egypt, May 9. http://www.dailynewsegypt.com/2016/05/09/ eni-increase-zohr-field-gas-production-2bn-cubic-feet-per-day-end-2019/ .

Agrimoney. 2012. Unrest, Bad Weather Lift Syrian Grain Import Needs. Agrimoney.com, March 14. http://www.agrimoney.com/news/unrest-bad-weather-lift-syrian-grain-import-needs–4278.html

Ahmed, Nafeez Mosaddeq. 2009. The Globalization of Insecurity: How the International Economic Order Undermines Human and National Security on a World Scale. Historia Actual Online 0(5): 113–126.

Ahmed, Nafeez. 2010. A User’s Guide to the Crisis of Civilisation: And How to Save It. London: Pluto Press.

———. 2011. The International Relations of Crisis and the Crisis of International Relations: From the Securitisation of Scarcity to the Militarisation of Society. Global Change, Peace & Security 23(3): 335–355. doi: 10.1080/14781158.2011.601854 .

———. 2013a. Peak Oil, Climate Change and Pipeline Geopolitics Driving Syria Conflict. The Guardian, May 13, sec. Environment. https://www.theguardian.com/environment/earth- insight/2013/may/13/1

———. 2013b. How Resource Shortages Sparked Egypt’s Months-Long Crisis. The Atlantic, August 19. http://www.theatlantic.com/international/archive/2013/08/how-resource-shortagessparked-egypts-months-long-crisis/278802/

———. 2014. Behind the Rise of Boko Haram—Ecological Disaster, Oil Crisis, Spy Games. The Guardian, May 9, sec. Environment. https://www.theguardian.com/environment/earth-insight/2014/may/09/behind-rise-nigeria-boko-haram-climate-disaster-peak-oil-depletion

———. 2015. The US-Saudi War with OPEC to Prolong Oil’s Dying Empire. Middle East Eye. May 8. http://www.middleeasteye.net/columns/us-saudi-war-opec-prolong-oil-s-dyingempire-222413845

———. 2016a. Climate Change Fuels Boko Haram. Women Across Frontiers Magazine. February 29. http://wafmag.org/2016/02/boko-haram-filling-vacuum-nigerias-state-collapses/

———. 2016b. At the Root of Egyptian Rage Is a Deepening Resource Crisis. Quartz. Accessed August 16. http://qz.com/116276/at-the-root-of-egyptian-rage-is-a-deepening-resource-crisis/

———. 2016c. Return of the Reich: Mapping the Global Resurgence of Far Right Power. Investigative Report. London: Tell MAMA and INSURGE Intelligence. https://medium.com/ return-of-the-reich

———. 2016d. FEMA Contractor Predicts ‘Social Unrest’ Caused by 395% Food Price Spikes. Motherboard. Accessed August 21. http://motherboard.vice.com/read/fema-contractor- predicts-social-unrest-caused-by-395-food-price-spikes

Akuru, Udochukwu B., and Ogbonnaya I. Okoro. 2011. A Prediction on Nigeria’s Oil Depletion Based on Hubbert’s Model and the Need for Renewable Energy. International Scholarly Research Notices, International Scholarly Research Notices 2011: e285649. doi: 10.5402/2011/285649 .

Al-Sinousi, Mahasin, and Amira Saleh. 2008. International Expert Warns Of Egypt’s Oil And Gas Reserves Depletion In 2020. Al-Masry Al-Youm, May 17, 1434 edition. http://today.almasryalyoum.com/article2.aspx?ArticleID=105585

Arashi, Fakhri. 2013. Wheat Imports Cause Yemen Heavy Losses—National Yemen. http://nationalyemen.com/2013/03/03/wheat-imports-cause-yemen-heavy-losses/

Aston, T.H., Trevor Henry Aston, and C.H.E. Philpin. 1987. The Brenner Debate: Agrarian Class Structure and Economic Development in Pre-Industrial Europe. Cambridge: Cambridge University Press.

Aucott, Michael L., and Jacqueline M. Melillo. 2013. A Preliminary Energy Return on Investment Analysis of Natural Gas from the Marcellus Shale. Journal of Industrial Ecology 17(5): 668– 679. doi: 10.1111/jiec.12040 .

Azevedo, Ligia B., An M. De Schryver, A. Jan Hendriks, and Mark A.J. Huijbregts. 2015. Calcifying Species Sensitivity Distributions for Ocean Acidification. Environmental Science & Technology 49(3): 1495–1500. doi: 10.1021/es505485m .

Badgley, Catherine, and Ivette Perfecto. 2007. Can Organic Agriculture Feed the World? Renewable Agriculture and Food Systems 22(2): 80–85.

Bardi, Ugo. 2014. Extracted: How the Quest for Mineral Wealth Is Plundering the Planet. Vermont: Chelsea Green Publishing.

Barnett, Tim P., and David W. Pierce. 2008. When Will Lake Mead Go Dry? Water Resources Research 44(3): W03201. doi: 10.1029/2007WR006704

Barron, Robert. 2016. Facing Rumors of Money Troubles, Egypt Denies Tension with Foreign Oil, Gas Firms. Mada Masr. January 27. http://www.madamasr.com/sections/economy/ facing-rumors-money-troubles-egypt-denies-tension-foreign-oil-gas-firms

Berger, Daniel, William Easterly, Nathan Nunn, and Shanker Satyanath. 2013. Commercial Imperialism? Political Influence and Trade during the Cold War. American Economic Review 103(2): 863–896. doi: 10.1257/aer.103.2.863

Berman, Arthur, and Ray Leonard. 2015. Years Not Decades: Proven Reserves and the Shale Revolution. Houston Geological Society Bulletin 57(6): 35–39.

Bhardwaj, Mayank. 2016. Food Imports Rise as Modi Struggles to Revive Rural India. Reuters India. February 2. http://in.reuters.com/article/india-farming-idINKCN0VA3NL

Bindi, Marco, and Jørgen E. Olesen. 2010. The Responses of Agriculture in Europe to Climate Change. Regional Environmental Change 11(1): 151–158. doi: 10.1007/s10113-010-0173-x

Bose, Prasenjit. 2016. A Budget That Reveals the Truth about India’s Growth Story. The Wire. March 2. http://thewire.in/23392/what-the-budget-tells-us-about-indias-growth-story/ .

Boucek, Christopher. 2009. Yemen: Avoiding a Downward Spiral. Carnegie Endowment for International Peace. September. http://carnegieendowment.org/2009/09/10/yemen-avoidingdownward-spiral-pub-23827

Bove, Vincenzo, Leandro Elia, and Petros G. Sekeris. 2014. US Security Strategy and the Gains from Bilateral Trade. Review of International Economics 22(5): 863–885. doi: 10.1111/ roie.12141

Bove, Vincenzo, Kristian Skrede Gleditsch, and Petros G. Sekeris. 2015. ‘Oil above Water’ Economic Interdependence and Third-Party Intervention. Journal of Conflict Resolution, January 27: 0022002714567952. doi: 10.1177/0022002714567952 .

Bove, Vincenzo, and Petros G. Sekeris. 2016. Fueling Conflict: The Role of Oil in Foreign Interventions. IPI Global Observatory. Accessed July 19. https://theglobalobservatory.org/2015/03/civil-wars-oil-above-water-military-intervention/

Brandt, Adam R., Yuchi Sun, Sharad Bharadwaj, David Livingston, Eugene Tan, and Deborah Gordon. 2015. Energy Return on Investment (EROI) for Forty Global Oilfields Using a Detailed Engineering-Based Model of Oil Production. PLOS ONE 10(12): e0144141.

Brown, Jeffrey J., and Samuel Foucher. 2008. A Quantitative Assessment of Future Net Oil Exports by the Top Five Net Oil Exporters. Energy Bulletin. January 8. http://www.resilience.org/stories/2008-01-08/quantitative-assessment-future-net-oil-exports-top-five-net-oil-exporters

Brown, James H., William R. Burnside, Ana D. Davidson, John P. DeLong, William C. Dunn, Marcus J. Hamilton, Norman Mercado-Silva, et al. 2011. Energetic Limits to Economic Growth. BioScience 61(1): 19–26.

Buckley. 2016. Coal Decline Steepens in 2016 in India, China, U.S. Institute for Energy Economics & Financial Analysis. May 16. http://ieefa.org/coal-decline-steepens-2016-2/

Capellán-Pérez, Iñigo, Margarita Mediavilla, Carlos de Castro, Óscar Carpintero, and Luis Javier Miguel. 2014. Fossil Fuel Depletion and Socio-Economic Scenarios: An Integrated Approach. Energy 77: 641–666.

Castillo-Mussot, Marcelo del, Pablo Ugalde-Véle, Jorge Antonio Montemayor-Aldrete, Alfredo de la Lama-García, and Fidel Cruz. 2016. Impact of Global Energy Resources Based on Energy Return on Their Investment (EROI) Parameters. Perspectives on Global Development and Technology 15(1–2): 290–299.

Chen, Shuai, Xiaoguang Chen, and Xu. Jintao. 2016. Impacts of Climate Change on Agriculture: Evidence from China. Journal of Environmental Economics and Management 76: 105–124. doi: 10.1016/j.jeem.2015.01.005

Chowdhury, Shakhawat, and Muhammad Al-Zahrani. 2013. Implications of Climate Change on Water Resources in Saudi Arabia. Arabian Journal for Science and Engineering 38(8): 1959– 1971.

Clarkson, M.O., S.A. Kasemann, R.A. Wood, T.M. Lenton, S.J. Daines, S. Richoz, F. Ohnemueller, A. Meixner, S.W. Poulton, and E.T. Tipper. 2015. Ocean Acidification and the Permo-Triassic Mass Extinction. Science 348(6231): 229–232. doi: 10.1126/science.aaa0193

Cleveland, Cutler J., and Peter A. O’Connor. 2011. Energy Return on Investment (EROI) of Oil Shale. Sustainability 3(11): 2307–2322.

Coleman, Isabel. 2012. Reforming Egypt’s Untenable Subsidies. Council on Foreign Relations. April 6. http://www.cfr.org/egypt/reforming-egypts-untenable-subsidies/p27885

Cook, Benjamin I., Toby R. Ault, and Jason E. Smerdon. 2015. Unprecedented 21st Century Drought Risk in the American Southwest and Central Plains. Science Advances 1(1): e1400082. doi: 10.1126/sciadv.1400082

Coumou, Dim, Alexander Robinson, Stefan Rahmstorf. 2013. Global increases in record-breaking 0668-1.

Csereklyei, Zsuzsanna, and David I. Stern. 2015. Global Energy Use: Decoupling or Convergence? Energy Economics 51: 633–641.

Cunningham, Nick. 2016. Decline of Coal Demand Is ‘irreversible. MINING.com. February 19. http://www.mining.com/web/decline-of-coal-demand-is-irreversible/

Dawson, Terence P., Anita H. Perryman, and Tom M. Osborne. 2014. Modelling Impacts of Climate Change on Global Food Security. Climatic Change 134(3): 429–440. doi: 10.1007/ s10584-014-1277-y.

Daya, Ayesha, and Dana El Baltaji. 2016. Saudi Arabia May Become Oil Importer by 2030, Citigroup Says. Bloomberg.com. Accessed August 11. http://www.bloomberg.com/news/articles/2012-09-04/saudi-arabia-may-become-oil-importer-by-2030-citigroup-says-1-

DCDC. 2013. Regional Survey—South Asia Out to 2040. Strategic Trends Programme. UK Ministry of Defence, Defence Concepts and Doctrines Centre.

Department Of State, Bureau of Public Affairs. 2014. Syria. Press Release|Fact Sheet. U.S. Department of State. March 20. http://www.state.gov/r/pa/ei/bgn/3580.htm

Diffenbaugh, Noah S., Daniel L. Swain, and Danielle Touma. 2015. Anthropogenic Warming Has Increased Drought Risk in California. Proceedings of the National Academy of Sciences 112(13): 3931–3936. doi: 10.1073/pnas.1422385112

Dipaola, Anthony. 2016. Iraq’s Oil Output Seen by Lukoil at Peak as Government Cuts Back. Bloomberg.com. May 19. http://www.bloomberg.com/news/articles/2016-05-19/iraq-s-oiloutput-seen-by-lukoil-at-peak-as-government-cuts-back

Dittmar, Michael. 2016. Regional Oil Extraction and Consumption: A Simple Production Model for the Next 35 Years Part I. BioPhysical Economics and Resource Quality 1(1): 7. doi: 10.1007/ s41247-016-0007-7

Dodge, Robert. 2016. Unconventional Drilling for Natural Gas in Europe. In The Global Impact of Unconventional Shale Gas Development, ed. Yongsheng Wang and William E. Hefley, 97–130. Natural Resource Management and Policy 39. Springer International Publishing.

EASAC. 2014. Shale Gas Extraction: Issues of Particular Relevance to the European Union. European Academies Science Advisory Council.

Ebrahimi, Mohsen, and Nahid Ghasabani. 2015. Forecasting OPEC Crude Oil Production Using a Variant Multicyclic Hubbert Model. Journal of Petroleum Science and Engineering 133: 818– 823.

El. 2012. Youth Are Quarter of Egypt’s Population, and Half of Them Are Poor | Egypt Independent. Egypt Independent. August 12. http://www.egyptindependent.com/news/youth-are-quarter-egypt-s-population-and-half-them-are-poor

EIA. 2016. Petroleum & Other Liquids Weekly Supply Estimates. US Energy Information Administration. http://www.eia.gov/dnav/pet/pet_sum_sndw_dcus_nus_w.htm  .

Evans-Pritchard, Ambrose. 2015. Saudi Arabia May Go Broke before the US Oil Industry Buckles. The Telegraph, August 5, sec. 2016. http://www.telegraph.co.uk/business/2016/02/11/saudi-arabia-may-go-broke-before-the-us-oil-industry-buckles/

Famiglietti, J.S. 2014. The Global Groundwater Crisis. Nature Climate Change 4(11): 945–948.

Farmer, J., M. Doyne, C. Gallegati, A. Hommes, P. Kirman, S. Ormerod, A. Sanchez Cincotti, and D. Helbing. 2012. A Complex Systems Approach to Constructing Better Models for Managing Financial Markets and the Economy. The European Physical Journal Special Topics 214(1): 295–324.

Feely, Richard, Christopher L. Sabine, and Victoria J. Fabry. 2006. Carbon Dioxide and our Ocean Legacy. Pew Trust. http://www.pmel.noaa.gov/pubs/PDF/feel2899/feel2899.pdf

Foster, John Bellamy, Brett Clark, and Richard York. 2010. The Ecological Rift: Capitalism’s War on the Earth. New York: NYU Press.

Fournier, Valérie. 2008. Escaping from the Economy: The Politics of Degrowth. International Journal of Sociology and Social Policy 28(11/12): 528–545.

Francis. 2014. Boko Haram, Al Shabaab and Al Qaeda 2.0—Islamic Extremism in Africa. Humanosphere. May 7. http://www.humanosphere.org/world-politics/2014/05/boko-haram-alshabaab-and-al-qaeda-2-0-islamic-extremism-in-africa/

Friedman, Thomas L. 2013. The Scary Hidden Stressor. The New York Times, March 2. http:// www.nytimes.com/2013/03/03/opinion/sunday/friedman-the-scary-hidden-stressor.html

Fritz, Martin, and Max Koch. 2014. Potentials for Prosperity without Growth: Ecological Sustainability, Social Inclusion and the Quality of Life in 38 Countries. Ecological Economics 108: 191–199.

Gagnon, Nathan, Charles A.S. Hall, and Lysle Brinker. 2009. A Preliminary Investigation of Energy Return on Energy Investment for Global Oil and Gas Production. Energies 2(3): 490– 503.

García-Olivares, Antonio, and Joaquim Ballabrera-Poy. 2015. Energy and Mineral Peaks, and a Future Steady State Economy. Technological Forecasting and Social Change 90, Part B (January): 587–598.

Ghafar, Adel Abdel. 2015. Egypt’s New Gas Discovery: Opportunities and Challenges | Brookings Institution. Brookings. September 10. https://www.brookings.edu/opinions/egypts-new-gasdiscovery-opportunities-and-challenges/

Guilford, Megan C., Charles A.S. Hall, Peter O’Connor, and Cutler J. Cleveland. 2011. A New Long Term Assessment of Energy Return on Investment (EROI) for U.S. Oil and Gas Discovery and Production. Sustainability 3(10): 1866–1887.

Gülen, Gürcan, John Browning, Svetlana Ikonnikova, and Scott W. Tinker. 2013. Well Economics Across Ten Tiers in Low and High Btu (British Thermal Unit) Areas, Barnett Shale, Texas. Energy 60: 302–315.

Hall, Charles A. S., and Kent A. Klitgaard. 2012. Energy and the Wealth of Nations. New York, NY: Springer New York. http://link.springer.com/10.1007/978-1-4419-9398-4

Hall, Charles A.S., Cutler J. Cleveland, and Robert K. Kaufmann. 1992. Energy and Resource Quality: The Ecology of the Economic Process. Niwot, CO: University Press of Colorado

Hall, Charles A.S., Jessica G. Lambert, and Stephen B. Balogh. 2014. EROI of Different Fuels and the Implications for Society. Energy Policy 64: 141–152.

Hallock Jr., John L., Wei Wu, Charles A.S. Hall, and Michael Jefferson. 2014. Forecasting the Limits to the Availability and Diversity of Global Conventional Oil Supply: Validation. Energy 64: 130–153.

Ho, Mae-Wan. 1999. Are Economic Systems Like Organisms? In Sociobiology and Bioeconomics, ed. Peter Koslowski, 237–258. Studies in Economic Ethics and Philosophy. Berlin: Springer.

Holling, C.S. 2001. Understanding the Complexity of Economic, Ecological, and Social Systems. Ecosystems 4(5): 390–405.

Holthaus, Eric. 2014. Hot Zone. Slate, June 27. http://www.slate.com/articles/technology/future_ tense/2014/06/isis_water_scarcity_is_climate_change_destabilizing_iraq.single.html

Homer-Dixon, Thomas. 2011. Carbon Shift: How Peak Oil and the Climate Crisis Will Change Canada (and Our Lives). Toronto: Random House of Canada.

Hook, Leslie. 2013. China’s Appetite for Food Imports to Fuel Agribusiness M&A. Financial Times, June 6.

Hughes, J. David. 2013. Energy: A Reality Check on the Shale Revolution. Nature 494(7437): 307–308.

ICEF. 2016. Growing Chinese Middle Class Projected to Spend Heavily on Education through 2030. ICEF Monitor. http://monitor.icef.com/2016/04/growing-chinese-middle-classprojected-spend-heavily-education-2030/

IEA. 2009. World Energy Outlook. Washington, DC: International Energy Agency.

———. 2015. India Energy Outlook. World Energy Outlook Special Report. International Energy Agency. https://www.iea.org/publications/freepublications/publication/india-energy-outlook2015.html

Inman, Mason. 2014. Natural Gas: The Fracking Fallacy. Nature 516(7529): 28–30.

IRIN. 2008. Bread Subsidies Under Threat as Drought Hits Wheat Production. IRIN. June 30.

———. 2010. Growing Protests over Water Shortages. IRIN. July 27. http://www.irinnews.org/news/2010/07/27/growing-protests-over-water-shortages .

———. 2012. Time Running Out for Solution to Water Crisis. IRIN. August 13. http://www.irinnews.org/analysis/2012/08/13/time-running-out-solution-water-crisis

Jackson, Tim. 2009. Prosperity Without Growth: Economics for a Finite Planet. London: Earthscan.

Jackson, Peter M., and Leta K. Smith. 2014. Exploring the Undulating Plateau: The Future of Global Oil Supply. Philosophical Transactions of the Royal Society of London A: Mathematical, Physical and Engineering Sciences 372(2006): 20120491.

Jancovici, Jean-Marc. 2013. A Couple of Thoughts in the Energy Transition. Manicore. http:// www.manicore.com/anglais/documentation_a/transition_energy.html

Jefferson, Michael. 2016. A Global Energy Assessment. Wiley Interdisciplinary Reviews: Energy and Environment 5(1): 7–15

Johanisova, Nadia, and Stephan Wolf. 2012. Economic Democracy: A Path for the Future? Futures, Special Issue: Politics, Democracy and Degrowth, 44(6): 562–570.

Johnstone, Sarah, and Jeffrey Mazo. 2011. Global Warming and the Arab Spring. Survival 53(2): 11–17.

Kaminska, Izabella. 2014. Energy Is Gradually Decoupling from Economic Growth. FT Alphaville, January 17. http://ftalphaville.ft.com/2014/01/17/1745542/energy-is-gradually-decouplingfrom-economic-growth/

Katusa, Marin. 2016. How to Pocket Extraordinary Profits from Unconventional Oil. Casey Energy Report.

Kavanagh, Jennifer. 2013. Do U.S. Military Interventions Occur in Clusters? Product Page. http://www.rand.org/pubs/research_briefs/RB9718.html

Kelley, Colin P., Shahrzad Mohtadi, Mark A. Cane, Richard Seager, and Yochanan Kushnir. 2015. Climate Change in the Fertile Crescent and Implications of the Recent Syrian Drought. Proceedings of the National Academy of Sciences 112(11): 3241–3246.

King, Carey W. 2015. Comparing World Economic and Net Energy Metrics, Part 3: Macroeconomic Historical and Future Perspectives. Energies 8(11): 12997–12920.

King, Carey W., John P. Maxwell, and Alyssa Donovan. 2015a. Comparing World Economic and Net Energy Metrics, Part 1: Single Technology and Commodity Perspective. Energies 8(11): 12949–12974.

———. 2015b. Comparing World Economic and Net Energy Metrics, Part 2: Total Economy Expenditure Perspective. Energies 8(11): 12975–12996.

Kirkpatrick, David D. 2013a. Egypt, Short of Money, Sees Crisis on Food and Gas. The New York Times, March 30. http://www.nytimes.com/2013/03/31/world/middleeast/egypt-short-of- money-sees-crisis-on-food-and-gas.html

———. 2013b. Egypt, Short of Money, Sees Crisis on Food and Gas. The New York Times, March 30. http://www.nytimes.com/2013/03/31/world/middleeast/egypt-short-of-money-sees-crisison-food-and-gas.html

Klump, Edward, and Jim Polson. 2016. Shale-Gas Skeptic’s Supply Doubts Draw Wrath of Devon. Bloomberg.com. Accessed July 11. http://www.bloomberg.com/news/articles/2009-11-17/shalegas-skeptics-supply-doubts-draw-wrath-of-devon-energy

Kothari, Ashish. 2014. Degrowth and Radical Ecological Democracy: A View from the South— Blog Postwachstum. Postwatchstum, Wuppertal Institute. June 27.

Kundu, Tadit. 2016. Nearly Half of Indians Survived on Less than Rs38 a Day in 2011–2012. http://www.livemint.com/Opinion/l1gVncveq4EYEn2zuzX4FL/Nearly-half-of-Indians-survived-on-less-than-Rs38-a-day-in-2.html

Lagi, Marco, Karla Z. Bertrand, and Yaneer Bar-Yam. 2011. The Food Crises and Political Instability in North Africa and the Middle East.

Lazenby, Henry. 2016. Opec Believed to Overstate Oil Reserves by 70%, Reserves Depleted Sooner. Mining Weekly. Accessed August 22. http://www.miningweekly.com/article/opec-believed-to-overstate-oil-reserves-by-70-reserves-depleted-sooner-2012-10-04

Lelieveld, J., Y. Proestos, P. Hadjinicolaou, M. Tanarhte, E. Tyrlis, and G. Zittis. 2016. Strongly Increasing Heat Extremes in the Middle East and North Africa (MENA) in the 21st Century. Climatic Change 137(1–2): 245–260.

LePoire, David, and Argonne National Laboratory, Argonne, IL, USA. 2015. Interpreting ‘big History’ as Complex Adaptive System Dynamics with Nested Logistic Transitions in Energy Flow and Organization—Emergence: Complexity and Organization. Emergence, March. https://journal.emergentpublications.com/article/interpreting-big-history-as-complexadaptive-system-dynamics-with-nested-logistic- transitions-in-energy-flow-and-organization/

Lesk, Corey, Pedram Rowhani, and Navin Ramankutty. 2016. Influence of Extreme Weather Disasters on Global Crop Production. Nature 529(7584): 84–87. doi: 10.1038/nature16467

Li, Minqi. 2014. Peak Oil, Climate Change, and the Limits to China’s Economic Growth. New York: Routledge.

MacDonald, Gregor. 2010. Think OPEC Exports Won’t Decline? You’re Living In A Dreamworld. Business Insider. August 14. http://www.businessinsider.com/think-opec-exports-wontdecline-youre-living-in-a-dreamworld-2010-8

Matsumoto, Ken’ichi, and Vlasios Voudouris. 2014. Potential Impact of Unconventional Oil Resources on Major Oil-Producing Countries: Scenario Analysis with the ACEGES Model. Natural Resources Research 24(1): 107–119.

Mawry, Yousef. 2015. Yemen Fuel Crisis Ignites Street Riots. Middle East Eye. February 12. http:// www.middleeasteye.net/news/yemen-fuel-crises-ignites-ongoing-street-riots-393941730

May, Robert M., Simon A. Li, Minqi. 2014. Peak Oil, Climate Change, and the Limits to China’s Economic Growth. New York: Routledge.

MacDonald, Gregor. 2010. Think OPEC Exports Won’t Decline? You’re Living In A Dreamworld. Business Insider. August 14. http://www.businessinsider.com/think-opec-exports-wontdecline-youre-living-in-a-dreamworld-2010-8

Matsumoto, Ken’ichi, and Vlasios Voudouris. 2014. Potential Impact of Unconventional Oil Resources on Major Oil-Producing Countries: Scenario Analysis with the ACEGES Model. Natural Resources Research 24(1): 107–119.

Mawry, Yousef. 2015. Yemen Fuel Crisis Ignites Street Riots. Middle East Eye. February 12. http:// www.middleeasteye.net/news/yemen-fuel-crises-ignites-ongoing-street-riots-393941730

May, Robert M., Simon A. Levin, and George Sugihara. 2008. Complex Systems: Ecology for Bankers. Nature 451(7181): 893–895.

Mayah, Emmanuel. 2012. Climate Change Fuels Nigeria Terrorism. Africa Review. February 24. http://www.africareview.com/news/Climate-change-fuels-Nigeria-terrorism/979180-1334472- 4m5dlu/index.html

McGlade, Christophe, Jamie Speirs, and Steve Sorrell. 2013. Unconventional Gas—A Review of Regional and Global Resource Estimates. Energy 55: 571–584.

Meighan, Brendan. 2016. Egypt’s Natural Gas Crisis. Carnegie Endowment for International Peace. January. http://carnegieendowment.org/sada/62534

Moeller, Devin, and David Murphy. 2016. Net Energy Analysis of Gas Production from the Marcellus Shale. BioPhysical Economics and Resource Quality 1(1): 1–13.

Mohr, Steve. 2010. Projection of World Fossil Fuel Production with Supply and Demand Interactions. Callaghan: University of Newcastle.

Mohr, S.H., and G.M. Evans. 2009. Forecasting Coal Production until 2100. Fuel 88(11): 2059– 2067.

———. 2010. Long Term Prediction of Unconventional Oil Production. Energy Policy 38(1): 265–276.

Mohr, S.H., J. Wang, G. Ellem, J. Ward, and D. Giurco. 2015. Projection of World Fossil Fuels by Country. Fuel 141: 120–135

Mora, Camilo, Abby G. Frazier, Ryan J. Longman, Rachel S. Dacks, Maya M. Walton, Eric J. Tong, Joseph J. Sanchez, et al. 2013a. The Projected Timing of Climate Departure from Recent Variability. Nature 502(7470): 183–187.

Mora, Camilo, Chih-Lin Wei, Audrey Rollo, Teresa Amaro, Amy R. Baco, David Billett, Laurent Bopp, et al. 2013b. Biotic and Human Vulnerability to Projected Changes in Ocean Biogeochemistry over the 21st Century. PLOS Biol 11(10): e1001682.

Morgan, Geoffrey. 2016. Average Oil Production to Decline This Year, Grow More Slowly in the Future: CAPP. Financial Post, June 23.

Morrissey, John. 2016. US Central Command and Liberal Imperial Reach: Shaping the Central Region for the 21st Century. The Geographical Journal 182(1): 15–26.

Murphy, David J. 2014. The Implications of the Declining Energy Return on Investment of Oil Production. Philosophical Transactions of the Royal Society of London A: Mathematical, Physical and Engineering Sciences 372(2006): 20130126. doi:10.1098/rsta.2013.0126.

Murphy, David J., and Charles A.S. Hall. 2011. Energy Return on Investment, Peak Oil, and the End of Economic Growth. Annals of the New York Academy of Sciences 1219(1): 52–72.

Nandi, Sanjib Kumar. 2014. A Study on Hubbert Peak of India’s Coal: A System Dynamics Approach. International Journal of Scientific & Engineering Research 9(2).  http://www.academia.edu/9744358/A_Study_on_Hubbert_Peak_of_Indias_Coal_A_System_Dynamics_Approach

Nekola, Jeffrey C., Craig D. Allen, James H. Brown, Joseph R. Burger, Ana D. Davidson, Trevor S. Fristoe, Marcus J. Hamilton, et al. 2013. The Malthusian–Darwinian Dynamic and the Trajectory of Civilization. Trends in Ecology & Evolution 28(3): 127–130. doi: 10.1016/j. tree.2012.12.001

OBG. 2016. New Discoveries for Egyptian Oil Producers. Oxford Business Group. January 27. http://www.oxfordbusinessgroup.com/overview/fresh-ideas-new-discoveries-have-oilproducers-optimistic-about-future

Odhiambo, George O. 2016. Water Scarcity in the Arabian Peninsula and Socio-Economic Implications. Applied Water Science, June, 1–14.

Odum, Howard Thomas. 1994. Ecological and General Systems: An Introduction to Systems Ecology. Niwot, CO: University Press of Colorado.

Omisore, Bolanle. 2014. Nigerians Face Fuel Shortages In the Shadow of Plenty. National Geographic News. April 11. http://news.nationalgeographic.com/news/enerws/ener nigeria-fuel-shortage-oil/

Onyia, Chukwuma. 2015. Climate Change and Conflict in Nigeria: The Boko Haram Challenge. American International Journal of Social Science 4(2)

Owen, Nick A., Oliver R. Inderwildi, and David A. King. 2010. The Status of Conventional World Oil reserves—Hype or Cause for Concern? Energy Policy 38(8): 4743–4749.

Patrick, Roger. 2015. When the Well Runs Dry: The Slow Train Wreck of Global Water Scarcity. Journal—American Water Works Association 107: 65–76.

Patzek, Tad W., Frank Male, and Odum, Howard Thomas. 1994. Ecological and General Systems: An Introduction to Systems Ecology. Niwot, CO: University Press of Colorado.

Omisore, Bolanle. 2014. Nigerians Face Fuel Shortages In the Shadow of Plenty. National Geographic News. April 11. http://news.nationalgeographic.com/news/enerws/ener nigeria-fuel-shortage-oil/

Onyia, Chukwuma. 2015. Climate Change and Conflict in Nigeria: The Boko Haram Challenge. American International Journal of Social Science 4(2). http://www.aijssnet.com/journal/index/329 .

Owen, Nick A., Oliver R. Inderwildi, and David A. King. 2010. The Status of Conventional World Oil reserves—Hype or Cause for Concern? Energy Policy 38(8): 4743–4749.

Patrick, Roger. 2015. When the Well Runs Dry: The Slow Train Wreck of Global Water Scarcity. Journal—American Water Works Association 107: 65–76.

Patzek, Tad W., Frank Male, and Michael Marder. 2013. Gas Production in the Barnett Shale Obeys a Simple Scaling Theory. Proceedings of the National Academy of Sciences 110(49): 19731–19736.

Pearce, Joshua M. 2008. Thermodynamic Limitations to Nuclear Energy Deployment as a Greenhouse Gas Mitigation Technology. International Journal of Nuclear Governance, Economy and Ecology 2(1): 113.

Peel, Michael. 2013. Subsidies ‘Distort’ Saudi Arabia Economy Says Economy Minister. Financial Times. May 7. http://www.ft.com/cms/s/0/f474cf28-b717-11e2-841e-00144feabdc0.html

Phys.org. 2016. Minority Rules: Scientists Discover Tipping Point for the Spread of Ideas. Accessed August 21. http://phys.org/news/2011-07-minority-scientists-ideas.html

Pichler, Franz. 1999. Modeling Complex Systems by Multi-Agent Holarchies. In Computer Aided Systems Theory—EUROCAST’99, ed. Peter Kopacek, Roberto Moreno-Díaz, and Franz Pichler, 154–168. Lecture Notes in Computer Science 1798. Springer Berlin Heidelberg.

Pierce, Charles P. 2016. What Happens When the American Southwest Runs Out of Water? Esquire. June 1. http://www.esquire.com/news-politics/politics/news/a45398/southwest-desertwater-drought/

Pracha, Ali S., and Timothy A. Volk. 2011. An Edible Energy Return on Investment (EEROI) Analysis of Wheat and Rice in Pakistan. Sustainability 3(12): 2358–2391.

Pritchard, Bill. 2016. The Impacts of Climate Change for Food and Nutrition Security: Issues for India. In Climate Change Challenge (3C) and Social-Economic-Ecological Interface-Building. Environmental Science and Engineering. Springer.

Pueyo, Salvador. 2014. Ecological Econophysics for Degrowth. Sustainability 6(6): 3431–3483.

Qaed, Samar. 2014. Expanding Too Quickly? Yemen Times. February 25.

Qi, Ye, Nicholas Stern, Tong Wu, Jiaqi Lu, and Fergus Green. 2016. China’s Post-Coal Growth. Nature Geoscience 9.

Reganold, John P., and Jonathan M. Wachter. 2016. Organic Agriculture in the Twenty-First Century. Nature Plants 2(2): 15221.

Rioux, Sébastien, and Frédérick Guillaume Dufour. 2008. La sociologie historique de la théorie des relations sociales de propriété. Actuel Marx 43(1): 126.

RiskMetrics Group. 2010. Canada’s Oil Sands: Shrinking Window of Opportunity. Ceres, Inc. http://www.ceres.org/resources/reports/oil-sands-2010

Rockström, Johan, Will Steffen, Kevin Noone, Persson Åsa, F. Stuart Chapin, Eric F. Lambin, Timothy M. Lenton, et al. 2009. A Safe Operating Space for Humanity. Nature 461(7263): 472–475.

Ross, John, and Adam P. Arkin. 2009. Complex Systems: From Chemistry to Systems Biology. Proceedings of the National Academy of Sciences 106(16): 6433–6434.

Salameh, M. G. 2012. Impact of US Shale Oil Revolution on the Global Oil Market, the Price of Oil & Peak Oil.

Saleh, Hebah. 2013. Egypt Weighs Burden of IMF Austerity. Financial Times. March 11. http://www.ft.com/cms/s/0/464a9350-8a6d-11e2-bf79-00144feabdc0.html

Sanders, Jim. 2013. The Hidden Force behind Islamic Militancy in Nigeria? Climate Change. The Christian Science Monitor. July 8.

Sands, Phil. 2011. Population Surge in Syria Hampers Country’s Progress | The National. The National, March 6. http://www.thenational.ae/news/world/middle-east/population-surgein-syria-hampers-countrys-progress

Sarant, Louise. 2013. Climate Change and Water Mismanagement Parch Egypt | Egypt Independent. Egypt Independent. February 26. http://www.egyptindependent.com/news/climate-changeand-water-mismanagement-parch-egypt

Sayne, Aaron. 2011. Climate Change Adaptation and Conflict in Nigeria. Special Report. United States Institute of Peace. http://www.usip.org/publications/climate-change-adaptationand-conflict-in-nigeria

Schneider, E.D., and J.J. Kay. 1994. Life as a Manifestation of the Second Law of Thermodynamics. Mathematical and Computer Modelling 19(6): 25–48.

Schneider, François, Giorgos Kallis, and Joan Martinez-Alier. 2010. Crisis or Opportunity? Economic Degrowth for Social Equity and Ecological Sustainability. Introduction to This Special Issue. Journal of Cleaner Production, Growth, Recession or Degrowth for Sustainability and Equity? 18(6): 511–518.

Schrodinger, Erwin. 1944. What Is Life? http://whatislife.stanford.edu/LoCo_files/What-isLife.pdf

Schwartzman, David, and Peter Schwartzman. 2013. A Rapid Solar Transition Is Not Only Possible, It Is Imperative! African Journal of Science, Technology. Innovation and Development 5(4): 297–302.

Shahine, Alaa. 2016. Egypt Had FDI Outflows of $482.7 Million in 2011. Bloomberg.com. Accessed August 16. http://www.bloomberg.com/news/articles/2012-03-25/egypt-had-fdioutflows-of-482-7-million-in-2011-correct-

Shaw, Martin. 2005. Risk-Transfer Militarism and the Legitimacy of War after Iraq. In September 11, 2001: A Turning-Point in International and Domestic Law? ed. Paul Eden and T. O’Donnell. Transnational Publishers. http://sro.sussex.ac.uk/12462/

Simms, Andrew. 2008. The Poverty Myth. New Scientist 200(2678): 49.

Smith-Nonini, Sandy. 2016. The Role of Corporate Oil and Energy Debt in Creating the Neoliberal Era. Economic Anthropology 3(1): 57–67.

Söderbergh, Bengt, Fredrik Robelius, and Kjell Aleklett. 2007. A Crash Programme Scenario for the Canadian Oil Sands Industry. Energy Policy 35(3): 1931–1947.

Steffen, Will, et al. 2015. January 15, 2015. Planetary Boundaries: Guiding Human Development on a Changing Planet. Science.

Stewart, Ian. 2015. Debt-Driven Growth, Where Is the Limit? Deloitte: Monday Briefing. February 2. http://blogs.deloitte.co.uk/mondaybriefing/2015/02/debt-driven-growth-whereis-the-limit.html

Stokes, Doug, and Sam Raphael. 2010. Global Energy Security and American Hegemony. Baltimore: JHU Press. Stott, Peter. 2016. How Climate Change Affects Extreme Weather Events. Science 352(6293): 1517–1518.

Street, 1615 L., NW, Suite 800 Washington, and DC 20036 Media Inquiries. 2014. Attitudes about Aging: A Global Perspective. Pew Research Center’s Global Attitudes Project. January 30. http://www.pewglobal.org/2014/01/30/attitudes-about-aging-a-global-perspective/

Taha, Sharif. 2014. Kingdom Imports 80% of Food Products. Arab News. April 20. http://www.arabnews.com/news/558271

Tainter, Joseph. 1990. The Collapse of Complex Societies. Cambridge: Cambridge University Press.

Tao, Fulu, Masayuki Yokozawa, Yousay Hayashi, and Erda Lin. 2003. Future Climate Change, the Agricultural Water Cycle, and Agricultural Production in China. Agriculture, Ecosystems & Environment 95(1): 203–215.

TE. 2016. Egypt Government Debt to GDP 2002-2016. Trading Economics. http://www.tradingeconomics.com/egypt/government-debt-to-gdp

Terzis, George, and Robert Arp, eds. 2011. Information and Living Systems: Philosophical and Scientific Perspectives. MIT Press. http://www.jstor.org/stable/j.ctt5hhhvb.

Thevard, Benoit. 2012. Europe Facing Peak Oil. Momentum Institute/Greens-EFA Group in European Parliament.  http://www.greens-efa.eu/fileadmin/dam/Documents/Publications/PIC%20petrolier_EN_lowres.pdf

Timms, Matt. 2016. Resource Mismanagement Has Led to a Critical Water Shortage in Asia. World Finance, July 21.

Tong, Shilu et al. 2016. Climate Change, Food, Water and Population Health in China. Bulletin of the World Health Organization, July.

Tranum, Sam. 2013. Powerless: India’s Energy Shortage and Its Impact. India: Sage.

Trendberth, Kevin, Jerry Meehl, Jeff Masters, and Richard Somerville. 2012. Heat Waves and Climate Change. https://www.climatecommunication.org/wp-content/uploads/2012/06/Heat_ Waves_and_Climate_Change.pdf

Tverberg, Gail. 2016. China: Is Peak Coal Part of Its Problem? Our Finite World. June 20.  https://ourfiniteworld.com/2016/06/20/china-is-peak-coal-part-of-its-problem/

UN 2015. World Population Prospects. United Nations Department of Economic & Social Affairs, Population Division.

UN News Center, United Nations News Service. 2012. UN News—Despite End-of-Year Decline, 2011 Food Prices Highest on Record—UN. UN News Service Section. January 12.

Victor, Peter. 2010. Questioning Economic Growth. Nature 468(7322): 370–371.

Vyas, Kejal, and Timothy Puko. 2016. Venezuela Oil Production Drops Sharply in May. Wall Street Journal, June 14, sec. World. http://www.wsj.com/articles/venezuela-oil-productiondrops-sharply-in-may-1465868354

Wang, Jinxia, Robert Mendelsohn, Ariel Dinar, Jikun Huang, Scott Rozelle, and Lijuan Zhang. 2009. The Impact of Climate Change on China’s Agriculture. Agricultural Economics 40(3): 323–337.

Wang, Ke, Lianyong Feng, Jianliang Wang, Yi Xiong, and Gail E. Tverberg. 2016. An Oil Production Forecast for China Considering Economic Limits. Energy 113: 586–596.

Weijermars, Ruud. 2013. Economic Appraisal of Shale Gas Plays in Continental Europe. Applied Energy 106: 100–115. doi: 10.1016/j.apenergy.2013.01.025

Wiedmann, Thomas O., Heinz Schandl, Manfred Lenzen, Daniel Moran, Sangwon Suh, James West, and Keiichiro Kanemoto. 2015. The Material Footprint of Nations. Proceedings of the National Academy of Sciences 112(20): 6271–6676.

Wilkinson, Henry. 2016. Political Violence Contagion: A Framework for Understanding the Emergence and Spread of Civil Unrest. Lloyd’s.   http://www.lloyds.com/~/media/files/news%20and%20insight/risk%20insight/2016/political%20violence%20contagion.pdf

Williams, Selina, and Bradley Olson. 2016. Big Oil Companies Binge on Debt. Wall Street Journal, August 24. http://www.wsj.com/articles/largest-oil-companies-debts-hit-record-high1472031002

Wood, Ellen Meiksins. 1981. The Separation of the Economic and the Political in Capitalism. New Left Review, I 127: 66–95. World Bank. 2014. Future Impact of Climate Change Visible Now in Yemen.

World Bank. November 24. http://www.worldbank.org/en/news/feature/2014/11/24/future-impactof-climate-change-visible-now-in-yemen

Worth, Robert F. 2010. Drought Withers Lush Farmlands in Syria. The New York Times, October 13. http://www.nytimes.com/2010/10/14/world/middleeast/14syria.html

Yaritani, Hiroaki, and Jun Matsushima. 2014. Analysis of the Energy Balance of Shale Gas Development. Energies 7(4): 2207–2227.


Posted in Cascading Failure, Caused by Scarce Resources, Collapse of Civilizations, Collapsed & collapsing nations, Drought & Collapse, Exports decline to ZERO, Food production, Interdependencies, Limits To Growth, Middle East, Other Experts, Over Oil, Overpopulation, Peak Oil, Violence, War & Violence | Tagged , , , , , | 3 Comments

After the harvest – protecting food from rats, mold, insects, fire, and bacteria

Preface. It’s hard enough to protect crops before a harvest. In New South Wales, Australia a plague of millions of mice has multiplied after a bumper grain harvest and eating whatever they can find. Mice can produce 500 offspring a season (Glover 2021).

Mice, rats, and other pests can get into the post-harvest storage buildings in the U.S. as well and exponentially increase.  These are gigantic grain elevators, some so huge they can store enough grain for most of the U.S. for weeks at a time. These silos are highly energy-intensive and far apart, requiring legions of trucks hauling grain long distances and again for distribution. In 2020, the largest grain bin in the U.S. is about to be built in Mason city, able to hold 2.2 million bushels of corn. It will be 155 feet high, and 165 feet wide.  It will be subsidized by a federal program to encourage higher ethanol blends (15%) in gasoline rather than the standard 10% today.

To prepare for energy descent, while there’s still energy we ought to think about when, where and with what materials we can build thousands of much smaller, widely distributed storage silos.  Before oil, grain elevators could be found about 7 miles apart, the distance a horse could travel in one day hauling a heavy load of grain.

Alice Friedemann www.energyskeptic.com  author of “Life After Fossil Fuels: A Reality Check on Alternative Energy“, 2021, Springer; “When Trucks Stop Running: Energy and the Future of Transportation”, 2015, Springer; Barriers to Making Algal Biofuels, and “Crunch! Whole Grain Artisan Chips and Crackers”. Podcasts: Collapse Chronicles, Derrick Jensen, Practical Prepping, KunstlerCast 253, KunstlerCast278, Peak Prosperity , XX2 report

* * *

Grain storage in the news:

Flesher J (2021) New problems arise for crop storage as planet gets warmer. AP.  Climate change is making it more expensive to keep crops refrigerated as harvests ripen earlier and put are into storage for longer periods — potatoes, apples, peanuts, lettuce, sugar beets, onions, carrots and tomatoes are among the crops requiring producers to install equipment to regulate temperature and humidity, which increases their power costs as the outside air gets hotter. Higher temperatures are likely to lead to even higher rates of food spoilage as well. Already 20% of fruits and vegetables go bad between harvest and retail. Rising temperatures will make it easier for pests to survive winters. Stored grain will be more prone to rotting.

NPR. 2019. Meet the Granary Weevil, the Tiny Bug Who Resides in Our Pantries. “If you store grains in your pantry, you’ve probably openED a package or jar to find tiny bugs living inside. It’s no accident that they’ve made a home in your pantry — they’ve evolved along with humans. Grain insects cause the loss of 2 to 5% of harvested grains in developed countries. That number shoots up to 50% in less-developed countries. For most of history, humans had only the tools of creating dry environments and tightly sealed storage to fight pests. Today, we have insecticides, sophisticated packaging, and even an “Infestation Destroyer” that uses centrifugal force to fling insects to meet their high-impact deaths.”    Okay, but in the future we won’t have the energy or technology to do this, again, this needs to be planned for to help our grandchildren cope with the future.

***

Peter Golob, et. al. 2002. Crop Post-Harvest: Science and Technology. Volume 1 Principles and Practice. Volume 2 Durables. Volume 3 Perishables.  Blackwell Science.

Introduction

This is a book review of Golob’s book.  After reading it, I found it amazing farmers can grow anything, since crops can be destroyed by drought, wildfire, flood, insects, birds, snails, rodents, fungi, bacteria, viruses, hail, frost, lack of vital nutrients, too much pesticide, and so on.

But that’s only half the story, the story most familiar to everyone.  You’d think that once the harvest is over, it’s time to relax and celebrate.  Yet the crop is still not safe from harm, wherever it is stored it’s still susceptible to all of the above, plus spoilage and silo explosions. Civilization exists because our ancestors figured out how to store grain for several years to make it through bad harvests.

Before fossil fuels initiated the Industrial Revolution, 90% of the population was rural, unlike now, where over 80% of us in the United States are urban.  Most people spent a good deal of time preserving perishable food like meat, vegetables, and fruit by drying them out, or with preservatives such as salt and alcohol.  Canning didn’t begin until the early 1800s when Napoleon began using canned food to feed his troops.

Most people in the world got, and still get, the majority of their calories and nutrition from long-lasting food, mainly grains and beans.

Brian Fagan, in The Little Ice Age 1300-1850, described how hard it was to store a harvest to last beyond one bad harvest and for the next planting, even if barns were stuffed to the eaves and local lords and religious foundations also stored crops. It was usually impossible to keep mice and rats away or prevent spoilage. During this period of climate change, crops failed often from blazing hot summers, excessive cold, or torrential rain. Two or more bad years in a row happened every ten years.

In the 20th century, post harvest food technology was developed and enormous granaries were built that can store grain for many years. These modern granaries keep rodents and other pests out. Durables are fumigated or sprayed with pesticides to kill insects at all stages of their life cycle. Grain elevators keep durables cool and dry, vastly extending their storage life.

Post harvest technology preserves food after harvest and before delivery. Although transportation isn’t part of the discussion, it’s important to mention that the main reason famines stopped was the invention of the railroad. Areas with good crops could send their surplus to regions where crops had failed.

The length of time and amount of durables that can be stored with fossil-fuel built and controlled food storage technology is amazing. This technology has also made food safer to eat. Fossil fuels allow produce just harvested from the field to be cooled immediately, and kept cool throughout the supply chain, which makes it possible for us to enjoy fresh food year round — often produce that’s come thousands of miles before reaching our plates.

Golob et al’s Crop Post-Harvest volumes 1-3 are heavy textbooks that provide an in-depth look at the continuing war to get perishables to market and to preserve food. Both the old methods, still used in developing countries, and the amazing energy-intensive modern technology we’ve developed, are explained in great detail.

Humans are now using nearly all of the arable, ranch, and forested land on the planet, so preserving as much harvested food for as long as possible is our main hope of increasing food supplies in the future.

Why does good food go bad?  How durables like grains and beans are destroyed.

High temperatures and moisture are the enemies of harvested crops.  In places with both grain can spoil in months.

Temperature affects how quickly insects, mites, fungus, and mycotoxins develop and germination qualities are lost.  The biological activity of insects, mites, fungi, and the grain itself doubles for every eighteen degree Fahrenheit rise in temperature.  At low temperatures, insect breeding stops.

It’s hard for insects and microorganisms to survive if there’s no water, so low moisture is critical as well.  This is why it’s so hard to preserve fresh food for a long time — fresh food has a very high water content, i.e. on average, the percent of water in apples is 84%, turnips 92%, pork 56%, Beef 58%, and fish 81% .

Damage and cleanliness

Produce that isn’t stored sterilely is bound to be degraded by some biological agent.  Damaged produce provides a point of entry for secondary pests and saprobic fungi.  Attack usually begins with one or a few species followed by the invasion of a broad range of non-specific microorganisms and secondary insect pests.  Primary pests can also lead to quality losses since some insects feed on the germ region of seed, leading to a loss of nutrition or viability if planted.

Infection after harvest often occurs at the site of wounds from insect feeding or mechanical injury during the harvest.  The main insect pests in stored food are Coleoptera (beetles) and Lepidoptera (moths), as well as diptera, psocoptera, and dictyoptera.  There are also some bacterial infections of stored foods that can be serious, poisonous even, especially for those who are old, young or sick.

Rodents

There are over 200 species of rodents that damage crops while they’re growing, but rodents haven’t coevolved with grain storage long enough yet – only 40 species of rodents prey on food stores.  Rodents can eat 10% of their body weight every day.  They reproduce quickly, so if even two of the opposite sex get in, it won’t be long before exponential growth begins.  Rats live about a year, can get pregnant at 3 weeks with litters of four to eight, and reach adulthood in two to three months.  You’ve got to go for 100% rat mortality or they’ll quickly come back.  Rodents do even more damage by contamination with urine and feces than the food they eat.

Rodents can cause extensive damage to storage structures.  They almost impossible to keep out – they can climb smooth surfaces, walk along wires, ropes, electric cables, etc.  They’re also good at digging and tunneling, can gnaw through anything less than 5.5 on the Mohr hardness scale, i.e. lead, aluminum, tin, etc, so structures need to avoid edges rodents can get purchase on to gnaw.  Some species of rats can jump five feet high, squeeze through 1/5th of an inch cracks, and swim long distances.

Birds and Insects

Birds not only eat grain directly from bins, but they’ll peck bags open.  Twenty pigeons eat as much as a human does.  Birds contaminate food and spread pathogens like salmonella and zoonoses.

Insects not only eat grain, but can affect the quality and taste of grain, affect the ability of making dough, and ruin the flavor.  In the USA, some areas are more likely to succumb to insects than others.  The highest risk area are the southernmost states, the lowest risk area are the states of South & North Dakota, Montana, Minnesota, Iowa, Wisconsin, Michigan, Oregon, Washington, Idaho, and Montana.

In developing countries, termites can devour wood storage structures.

Fungi, mold, and microorganisms

Fungi flourish when moisture is over 22%.  They can cause blemishes, blights, discoloration, and even wreak revenge in the next generation, when the fungi-damaged seed produces a diseased plant or reduced germination rates.

Molds can produce toxic myco- and afla-toxins making them unsafe to eat and of poor quality.

If rodents, birds, insects, mites, fungi, and mold don’t harm the stored grain, then bacteria, viruses, yeasts, nematodes, anthracnose, blight, blotch, brown rot, canker, scab, dry rot, hyperplasia, hypertrophy, leaf spot, mildew, mould, mosaic virus, rust, smut, vascular disease, wet rot, soft rot, and toxins are still a peril.

And more…

In addition to all the pests and diseases, grain can suffer from mechanical damage at harvest, threshing, or any point thereafter — while being hauled to market, and careless handling at the market.

Grain can be damaged if drying is done incorrectly, or through temperature extremes at any point.  Moisture over 10-14% will lead to deterioration from fungi and biological degradation.

If grain is harvested too early, it will be green and therefore have high moisture content, causing it to rapidly deteriorate in storage.  If harvesting is too late, the mature grain may be attacked by insects and microorganisms, or cracked from repeated rain and dry weather, making it easier for microorganisms to attack in storage.

Fresh produce

However hard it is to store durables like grain and beans, it’s much easier than fruits or vegetables, which must be delivered to the consumer quickly, often within days.  The new, high-yield varieties of produce have higher nutrition, but they also have greater likelihood of spoilage in storage.   Lack of plant nutrients in the soil affects the quality at harvest and the ability of the produce to store.  Nitrogen may be good for growth, but it can lead to problems in some produce in storage.

For example, ideally lettuce is picked when the temperature is less than 60 degrees Fahrenheit and cooled within two hours.  If kept cool, it won’t spoil for nine and a half days.  But if lettuce is picked when it’s over 75 degrees Fahrenheit and isn’t cooled down until ten hours later, spoilage will begin in two and a half days.

Produce is pre-cooled by evaporative cooling, positive ventilation with ice banks, ice cooling, forced air cooling, hydro-cooling, and vacuum cooling.

Both durables (grains, legumes) and perishables are sprayed with chemicals to keep biota from attacking.

Fumigants can be essential to killing insects as well. Since Methyl Bromide causes ozone depletion, there’s a race on to invent a new fumigant, but this isn’t easy because there are so many essential properties. Fumigants must be a gas at room temperature, good at diffusing, kill all stages of pests, not be greatly heavier than air, and not leave harmful chemical residues. So other, costlier, methods of controlling insects are being tried, such as airtight storage, vacuums, and carbon dioxide atmospheres.

This is a very small subset of what’s covered in these three textbooks, which go in depth into the details of plant physiology, how to measure important storage parameters, detect pests, a long list of specific pests and the damage they do, how to build storage structures, manage pests, preserve food, the chemical structure of plants and oils, milling grains, trade and international agreements, applied research and dissemination, food systems, how food is preserved in developing countries, and much, much more.

Conclusion – Energy descent implications

If you’ve ever driven through the Midwest, you’ve seen enormous grain elevators from miles away.

These are built to protect against theft, rodents, birds, and insects.  They’re designed to keep the durables stored within as dry and cool as possible, by preventing cold humid air from getting into the grain at night and keeping the roof from getting so hot that condensation forms.

Climate change will make harvests far less assured in the future, with more years between successful harvests, as Brian Fagan describes in “The Little Ice Age”.  Research into how to store food after harvesting for long periods is essential to prepare for the double whammy of extreme weather and declining energy.

Long distance fresh produce will be the first to vanish from grocery store shelves as energy declines, but as Marion Nestle points out in “What to Eat”, the longer it takes food to reach market, the more nutrition is lost.  Locally produced produce is far healthier.

One solutions is to fund more research into low-energy, potentially manual post-harvest storage of durable crops ought to be increased.   Currently, modern storage technology is very energy intensive, and favors large farms over small farms because:

  • Small farms are expensive to include in horizontal and vertical supply chains
  • Small farms can’t meet as stringent quantity and quality demands as large firms supplying food to markets
  • Fruits and vegetables are hard for smaller or medium farms to deal with – they need special packing and refrigeration equipment to cool down the produce, transport it, and large growers can afford the computer-controlled deep irrigation systems, intense fertilizers and pesticides, and sophisticated packing plants to keep produce cool throughout the entire supply chain.
  • Small and medium farms don’t have the money to keep up with the latest research on hygiene, health, aesthetics, development, and marketing
  • The cost to build and operate high-tech storage structures is huge

Because agriculture, infrastructure, and western civilization are so dependent on fossil fuels, many writers have concluded the best way to lower suffering as energy declines, and to make as orderly and peaceful a transition as possible, is for millions of families to go back to land.  Clearly most families would prefer to be independent small farmers on their own land rather than poorly paid seasonal workers.

I hope, but doubt, there is funding for engineers and scientists to figure out the best ways to adapt existing infrastructure each step downward on the energy curve.  In the case of post-harvest technology, one puzzle that needs to be solved is how to continue using the enormous durable storage facilities we’ve built.  If long-term, it’s impossible to load half-mile-long 120-foot high grain elevators without fossil-fuel driven energy, then let’s start building smaller grain elevators and other post-harvest storage technology now, while the energy to do so still exists.

References

Glover E. 2021. The ground is just moving with thousands of mice: Australia hit by rodent plague. The Independent.

Posted in Agriculture, Books, Farming & Ranching, Peak Food | Tagged , , , | 2 Comments

Tilting at Windmills, Spain’s disastrous attempt to replace fossil fuels with Solar PV, Part 2

Preface. Below is a book review of Charles Hall’s 2017 book, “Energy Return on Investment: A Unifying Principle for Biology, Economics, and Sustainability“, that he wrote to discover why solar advocate EROI results are so much higher than what was found in Prieto & Hall’s “Spains Solar Revolution”.

Pedro Prieto also presented an update on June 20, 2017 at the International Society for Biophysical Economics “Spain’s Solar Revolution Revisited: six years later” to explain the differences here.Other factors were probably underestimated, but not adjusted: it is likely that solar panels don’t last for 25 years (slide 25), dust loss (27), angular losses (28), non-fulfillment of power (29), losses from shadowing (31), losses from voltage and frequency sags and swells (36), over-dimensioning (37).

And at the end of this post a very detailed criticism of Prieto in 2015 to the arguments advocates use and rebutal. Inbetween are other criticisms and rebuttals to give you as full an understanding of what all the fuss is about as I can.

Since fossil fuels are finite, the electric grid must be 100% renewable someday. The goal of EROI studies is to see which renewables are the most worth investing in long-term.  Someday they will be without any help from oil, coal, and natural gas, so it is necessary to have wide boundaries that includes all of the other essential infrastructure that makes solar and wind possible, especially  energy storage, the transmission system, and other renewables that can provide both millisecond balancing power and 6 to 12 weeks of energy storage, depending on size of grid and amount of renewable power in a region.

And electricity will have to power transportation, manufacturing — everything.  Electricity is just a fifth of the energy we use now (under the category Energy I explain why hydrogen, biofuels, methane hydrates and other energy resources can’t substitute for oil).

The biggest difference Hall has found so far is due to solar advocates multiplying solar electricity generation by a factor of 2.6 (BP) or 3 (IEA) because advocates claim that solar power is worth 3 times as much as fossil electricity since two-thirds of fossil generation is lost as heat.

According to Gail Tverberg, in her post “The Wind and Solar Will Save Us Delusion“, this is done by BP to account for the loss of energy when fossil fuels or biomass are burned and transformed into electricity. BP corrects for this by showing the amount of fuel that would need to be burned to produce this amount of electricity, assuming a conversion efficiency of 38%. Thus, the energy amounts shown by BP for nuclear, hydro, wind and solar don’t represent the amount of heat that they could make, if used to heat apartments or to cook food. Instead, they reflect an amount 2.6 times as much (=1/38%), which is the amount of fossil fuels that would need to be burned in order to produce this electricity.

But wait! Fossil fuels used for heat are several times more effective than heat generated with electricity, and burning natural gas at home in a 98% efficient furnace is far cheaper than burning it at a natural gas power plant and losing two-thirds of it to create electricity.

EROI simply must include all of the energy inputs required to build a solar plant as in Prieto & Hall’s study at a minimum, so we can see if it is worth subsidizing solar (or wind) in the first place.   If solar and wind can’t replace fossil fuels, because they depend on them too much, then the money/energy would be better spent building passive solar homes that would last for hundreds of years, prepare to go back to muscle power, expand organic agriculture and add organic agriculture departments at high schools and universities to start with. Integrated organic pest management. Much smaller granaries near farms to store harvests for 10 years or more to compensate for poor harvests from climate change and other factors.

We have very limited time and energy left to cope with the energy crisis.  Energy transitions take at least 50 years. The 2005 DOE report by Hirsch said that you’d want to prepare at least 20 years ahead for peak oil, with time the most limiting factor, and here it is 12 years after conventional oil peaked with an energy cliff rather than a bell curve looming.

If anything, solar and wind electricity should probably be reduced considerably, because they have a very low quality energy since they can’t be counted on. Here are some reasons to reduce their EROI (see “When Trucks Stop Running” for citations and more details):

All wind and solar do is add more wood to the fire. They do nothing to get rid of fossil fuels because they can’t be counted on. In the 2012 IEA world energy outlook, it was calculated that 450 GW installed capacity of wind in 2035 would only produce 112 GW of power since it’s not always blowing. But that’s no good for the grid, when it needs power, it needs power RIGHT NOW. The IEA calculated wind could be counted on only 5% of the time (the capacity credit) for just 22.5 GW at peak demand times. That means an additional 89.5 GW (112–22.5 GW) of reliable fossil, nuclear, or biomass power is needed to back up wind power. So the more you replace conventional power plants with wind, the more you depend on wind. And, the more you depend on the wind, the less you can depend on it. Great Britain’s office of science and technology estimated wind could be counted on reliably only 7–9 % of the time if the overall penetration of wind power ever reached 50%. So if 25 GW of wind capacity were built to replace 25 GW of fossil and nuclear plants that have double the lifespan of wind turbines, and the capacity credit of wind at peak demand was 5 GW, then an additional 20 GW of fossil and nuclear plants would be needed for backup, with nearly double the energy generation as before (45 GW). In regions where peak demand occurs in the winter, the capacity credit of solar power is zero, because peak demand occurs after dark. And thus the stark reality: “Investment in renewable generation capacity will largely be in addition to, rather than a replacement for power stations” (GBHL 2007). Worse yet, backup fossil and nuclear power plants must be online ready to step in immediately if wind or solar power falter, burning fuel meanwhile.

So you could build energy storage to store excess wind and solar generation. Since on average the wind is blowing 33% of the time, you’d want to build 3 times more wind turbines to keep the energy storaed in batteries, pumped hydro, and compressed air.

You’d also need to have a hugely expanded national grid, since most of the wind is in the Midwest, most of the solar is in the southwest, and most of the hydropower is along the west coast.

Energy storage, a national grid, and fossil fuel electricity generation plants are not separate entities which can be ignored in EROI studies, because solar and wind and the electric grid itself can’t exist without them.

Alice Friedemann  www.energyskeptic.com  Author of Life After Fossil Fuels: A Reality Check on Alternative Energy; When Trucks Stop Running: Energy and the Future of Transportation”, Barriers to Making Algal Biofuels, & “Crunch! Whole Grain Artisan Chips and Crackers”.  Women in ecology  Podcasts: WGBH, Financial Sense, Jore, Planet: Critical, Crazy Town, Collapse Chronicles, Derrick Jensen, Practical Prepping, Kunstler 253 &278, Peak Prosperity,  Index of best energyskeptic posts

Part 2: Critiques and rebuttals of Spain’s Photovoltaic Revolution. The Energy Return on Investment”, by Pedro Prieto and Charles A.S. Hall

Part 1 is an introduction and overview, followed by a book review of “Spain’s PV revolution” 

Below are 5 rebuttals of criticism of Prieto & Hall’s book:

  1. 2017.    Hall, Charles A.S. Energy Return on Investment: A Unifying Principle for Biology, Economics, and Sustainability. Springer.
  2. 2016-5-26. The real EROI of photovoltaic systems: Professor Hall weighs in. Ugo Bardi’s blog: Cassandra’s Legacy.
  3. 2015-4-1: Stanford Net Energy conference
  4. 2015-4-11 Pedro Prieto responds to criticism (private communication)
  5. 2015-4-11 Ted Trainer responds to criticism of Prieto & Hall

On an energy forum in March 2014, Prieto said: “Since we wrote the book, I have been able to experience a few more incidental factors: mice delightfully gnawing the cables and covers and optical fiber communication color cables, and storks excreting on modules with about 6 inches size -one cell- per excretion. Real life has many factors that they are not accounted in organized studies in labs, universities with particular technologies and plants in perfect irradiation places.”

Alice Friedemann   www.energyskeptic.com  author of “When Trucks Stop Running: Energy and the Future of Transportation”, 2015, Springer and “Crunch! Whole Grain Artisan Chips and Crackers”. Podcasts: Practical Prepping, KunstlerCast 253, KunstlerCast278, Peak Prosperity , XX2 report ]

Hall, Charles A.S. 2017. Energy Return on Investment: A Unifying Principle for Biology, Economics, and Sustainability. Springer.

[ Mostly verbatim, sometimes cut or paraphrased. See the book for cited references, tables, and graphs]

In the first decades of the 21st century a number of studies gave EROIs of 6–10:1, though rather than EROI studies more often used the energy pay back times of just one or two years for photovoltaic (PV) systems (e.g. Fthenakis et al. 2011; Raugei et al. 2012). These numbers were used by solar advocates to argue for the importance and economic viability of solar PV systems, and in some cases that solar PV systems were comparable to fossil fueled systems.

But in 2013 Prieto and Hall came out with a much lower estimate of EROI of 2.45:1 for sunny Spain with sophisticated engineers, which caused a great stir amongst solar advocates and initially greeted with disbelief by many in the industry.

This book provides the most comprehensive assessment of all of the energy costs of solar PV.  It differs from many earlier analyses in that

  1. it attempts to include (nearly) ALL energy costs actually used, not just the costs of the modules and some related hardware
  2. it uses measured rather than estimated energy output.
  3. It uses actual data from Spain which has a much higher insolation than Switzerland, Germany or the Netherlands.
  4. Of particular importance is that Prieto and Hall attempted to calculate the complete energy used to support the PV system by “following the money”, i.e. by attempting to assess all the money flows necessary for the system to operate (understood by Prieto because of his extensive on-site experience as Project Director, Project Designer, Consultant and Director of Development of a solar PV company).

They assigned an energy cost to each monetary cost using specific energy intensities: the mean energy use for the Spanish economy (7.16 MJ per Euro), and twice that for manufactured or engineering items, and one third that for business services as given in the protocol paper by Murphy et al. (2011). They derived about the same energy cost when they took all money spent times the national mean (7.16 MJ/Euro, similar to the global mean) as they found when they did a very detailed analysis of 24 categories of items, including such things as energy costs of roads and cleaning, surveillance, business services, meetings attended by engineers as well as modules.

This is consistent with the view of Herendeen and Bullard (1975) that when one purchases a complex product from final demand all the different energy intensities tend to “come out in the wash”. Raugei and Leccisi (2016), for example, did not calculate any energy cost for which they could not get a direct energy measurement for in their assessment of PV and fossil fuel derived energy for England. To me this seems to miss some costs.

Since then similar results were published by Palmer (2013) for rooftop PVs with battery back up in Australia, and Weissbach et al. (2013), for Germany (see also Raugei 2013; Weissbach et al. 2014; Raugei et al. 2015). In 2016 Ferroni and Hopkirk published an estimate of a negative EROI for cloudy Switzerland and Germany.

Yet Leccisi et al. (2016) and Raugei and Leccisi (2016) came back with estimates of values of 9:1 or higher. How could two different groups of competent investigators get such different estimates?

Why do some solar PV studies have a low EROI and others a high EROI?

1. The largest difference in EROI between these investigators is based on corrections for quality between fossil fuels and electricity.

Raugei et al. (2012) were very critical of comparing the apples of fossil fuels (where EROIs at the source were generally higher) with the oranges of higher quality electricity. They said that a number of summaries (e.g. the “widely cited ‘balloon graphs’ (Hall et al. 2008; Murphy and Hall 2010) and bar charts (Hall and Day 2009) have compared many technologies simply in ‘heat equivalents’, i.e. the energy values are given in terms of their abilities to heat water with no correction for energy quality”. The fundamental issue is that since we are willing in society to trade about 3 heat units of coal, oil or gas to generate one heat unit of electricity, the EROIs of the electricity derived from PVs or wind turbines (or nuclear power plants) should be weighted by a value of some three times that of a heat unit of fossil fuels.

2) Theoretical versus actual electricity output

EROI values in many studies are too high because they used “nameplate” values (1,800 kWh/M2-year) for assessing electricity outputs from PV facilities rather than the actual output. [My comment: this is because private solar facilities usually won’t give researchers this information.  But Prieto & Hall had 3 years of government data from all the facilities in Spain].  Nameplate is inaccurate since the actual electricity output is reduced by clouds, bird droppings, overheating, dust accumulation, lightning, equipment failures, and degradations over time to less than “Nameplate” value.  Also, too much output can fry electrical components at various locations in the grid.

Prieto and Hall found that the actual output for a facility in Spain with a nominal output of 1,800 kWh/m2-yr was measured at an actual 1,375 kWh/m2-year.  Ferroni and Hopkirk (2016) also found measured values considerably less than nameplate values.

3) Solar facilities probably don’t last for 25 to 30 years

A related issue is the assumptions about how long the facility will last.  Most investigators have applied a life span of 25 years for PV facilities, and the IEA guidelines suggest 30 years.  Since most solar facilities are new, this is hard to measure, but in reality it may be less.  Ferroni and Hopkirk (2016) came up with an estimate of a mean of 18 years for Switzerland.  Prieto (personal communication) believes it is much less than 25 years in Spain because many companies have declared bankruptcy and thus do not honor their warranties.  Without warranties or the specific parts to fix failures, many PV facilities in Spain have been abandoned or completely reconfigured.

4) Boundaries and Comprehensiveness of the cost assessments

Carbajalis Dale et al. (2015) state in a footnote in reference to Prieto and Hall’s study that they are inconsistent in their definition of system boundary and arbitrary in the inclusion of a large number of non-energy inputs. In their online Commodities and Future trading where they claim that “Renewables have a higher EROI than fossil fuels” they state “Prieto and Hall add every incidental energy cost they can think of, like the energy costs of building fences around the solar farm, and so on. They even add energy costs for things like corporate management, security, taxes, fairs, exhibitions, notary public fees, accountants, and so on (monetary costs are converted into energy by means of a formula)”.

We respond: “As if these were not legitimate energy costs to build and operate PV plants?” In fact they are. For example, fences and security are necessary, given the high value of things like scrap copper, so plants are very susceptible to thieves stealing electrical components (a cost, incidentally, Prieto and Hall included).  Without fences and security, the EROI goes to zero.

Nor can facilities exist without roads, module washing, and financial institutions.

Based on earlier studies (e.g. Hannon 1981), it is clear that all services and goods require substantial amounts of energy, about a third to half per dollar compared to societal means to undertake. In order to make a comprehensive assessment we “followed the money” and assigned a very conservative one-third the national mean energy cost to all service expenditures, which Prieto knew because as chief site engineer he signed for every penny and activity at a large gigawatt plant in Spain. The services we mentioned are not incidental but necessary and should be included in energy costs, and we’ve yet to hear a good reason why we should have excluded any of them.

Prieto and Hall found that the construction of modules and basic electronic components such as inverters were only about a third of the total energy cost of building and operating a solar facility in Spain.  We assume this is true elsewhere, yet our critics have yet to do a study that includes much of the real energy costs that we did.

Raugei et al. (2013) have argued that we included costs such as site preparation and environmental issues that are not included in our assessments of oil or coal.  This is not true since all such costs are included in our indirect energy assessments which are based on total “upstream” expenditures by industries. We agree with them that the boundaries should include all energy costs that any energy gathering activity experiences.

5) Technological changes over time

Another issue raised by Raugei and other solar analysts is that the monetary and energy cost of making solar PV modules has been declining for decades and will continue to do so, although perhaps at a declining rate. They criticize the Prieto and Hall study for using technology appropriate in 2008 (actually we used 2009-2011 technology) when there has been a 10 to 20% decline in the energy cost to make modules since then (some of which, in terms of money if not energy, is attributable to such things as subsidies by the Chinese government). As far as we know, there has not been a similar decline in the other inputs to PV systems.  I agree with them that one should do costs and benefits for particular years.

The EROI of Storage for Solar Energy

Swenson (2016) argues that at large scale, solar PV technologies will become more efficient.  But that adds to the energy and monetary costs to build storage and integration into the grid, lowering EROI.

Since sunshine and wind are dependent on nature’s only partially predictable whims, and can’t be programmed in advance, meeting the demand load can be very difficult.  A day might be sunny or cloudy (with half or less of the insolation), and wind blows on average only about 30% of the time (closer to 20% in Germany), and there can be periods of two weeks or more with no wind at all.  Although PV systems are slightly more predictable, storage is required to compensate for these intermittencies. Yet even if we used all of the batteries in the worldwide, they’d store less than one minute of global electrical output, nor is this cost effective on a massive scale.

And not just storage, but some other kind of readily dispatchable power. Right now the only storage option feasible at large scale is elevated storage of water in existing facilities or specially constructed pumped storage, but:

  • there’s an electricity of loss of 25-35% in the pump up and later release systems
  • the availability of such sites are limited
  • the intermittent release of water harms fish and aquatic ecosystems (Ward and Stanford 1979)

Carbajalis Dale et al. (2014) estimate that adding a relatively small amount of storage to PV systems would quickly put them into energy deficit.

Palmer (2013) found that batteries doubled the energy cost of rooftop solar systems.

These energy costs tend to be ignored by PV and wind advocates, who also argue that coal and nuclear facilities have their own problems with responding to variable loads (which however are being met readily now).

Future EROI assessments should include the large energy costs of storage, which will only grow larger as more intermittent renewables are added to the grid.

Exponential Growth of energy production

Many say we must grow these systems very rapidly and indefinitely.  But Neumeyer and Goldston (2016) found that an initial EROI of 10:1 quickly dropped to 2:1 as most of the power output went to generating new plants.  Carbajalis Dale and Benson (2013) and Kaufmann and Shiers (2008) found a similar very sharp drop in net power output if growth were large.

Thus a large exponentially growing PV system will have to be constructed using fossil fuels.

But there may not be enough materials to exponentially grow PV facilities.  Fizaine and Court (2015) and Gupta and Hall (2012) found that an exponentially growing PV system might run out of copper in a very few decades.  Hertwich et al. (2014) found that PV systems can use 11 to 40 times more copper than conventional fossil generation systems, though they thought there was enough copper to build a large renewable system.

Business Services and Taxes

All investigators agree that direct (on site) and obvious indirect energy costs should be included (Murphy et al. 2011).

But what about the energy to support business services used?  These require energy to build brick and mortar buildings, which need to be heated, cooled, and lighted with electricity and fossil fuels.  What about the energy to support the taxes paid?  Taxes, when spent, require energy also, such as the energy to build and maintain roads, provide schooling, and so on.  Oil and gas fields as well as PV facilities require considerable construction and maintenance costs that are paid for by governments which in turn operate from taxes.

For example, Pennsylvania has found there are very high costs associated with the new “fracked” gas wells due to the heavy trucks full of water driven over low quality roads during all seasons of the year, creating damage that has to be fixed with heavy equipment.  In addition the driller’s children require schooling, and there’s also an increase in the need for policing and health services (Dutzik et al 2012; Food & water watch 2013).  Therefore, tax expenditures and the energy required to generate these governmental services should be included in the energy cost of a project.

Labor

Perhaps most controversial is whether to include the energy required to support labor. There are various kinds of energy costs that might be included, such as the 1.8 MJ/hour a hard working person requires to do heavy labor.  People are basically machines that operate at about 20% efficiency, requiring food with 9 MJ/hour.  This is trivial compared to the machines most laborers use, such as a diesel engine burning 135 MJ per hour.

Labor is not available without pay, so the energy to support the worker’s paycheck might be included. Assume a worker is paid $50,000 a year.  Energy must be spent within the economy to produce the goods and services demanded by the worker or his/her family spending the paycheck.  In 2015 the U.S. economy used roughly 5.6 MJ per average dollar of GDP.  Thus, assuming that our worker’s family spends their money on “average” goods and services, it would take about 280,000 MJs of energy, equal to 46 barrels of oil, to support their paycheck.

When first presented in around 1970 as a potential factor in EROI, economists said this was inappropriate since this was consumption which shouldn’t be added to production.   But I think the energy to support worker’s paychecks is a legitimate part of the cost of production, but it is so controversial that we do not include it.


2016-05-26 The real EROI of photovoltaic systems: Professor Hall weighs in. Ugo Bardi’s blog: Cassandra’s Legacy.

May 8, 2016: a recent paper in Energy Policy on the EROI of photovoltaic solar systems came up with a NEGATIVE EROI of 0.85:1 (Ferroni and Hopkirk 2016).

They found that “at today’s state of development, PV technology cannot offer an energy source but a NET ENERGY LOSS, since its ERoEIEXT is not only very far from the minimum value of 5 for sustainability suggested by Murhpy and Hall (2011), but is less than 1 [0.85].

Prieto (private communication) notes that “Ferroni/Hopkirk calculate the failure rates of PV modules as per the public statistics of PV Cycle (a recycling European entity), that do not count modules that are simply abandoned.  The data contradicts the IEA PVPS program, calculating 30 years of life span for PV systems: the failure rates give a figure much closer to 18 years.”  

Prieto also says that a criticism of their paper is that Spain is a lousy country, but Germany is the “flagship of perfect workmanship”. Yet after 10 years, the reality is that Spain is producing twice as much energy as Germany in per MWp installed basis, not only because Spain is better irradiated (about 50%), but also because of the more efficient and better maintained utility scale installations in Spain versus the scattered rooftop individual home installation in Germany.” He also notes that the Ferroni (2016) paper “is dramatic and is raising some blisters.”

Ferroni, F., Hopkirk, R. J. 2016. Energy Return on Energy Invested(ERoEI)for photovoltaic solar systems in regions of moderate insolation. Energy Policy 94:336–344


2015-4-1: Stanford Net Energy conference 

Notably, the founder of EROI, Charles A. S. Hall, wasn’t invited.

At this Stanford University conference the goal was to start a new net energy think-tank that would standardize net energy by having a specific way researchers ought to conduct their studies, with the most up-to-date life cycle and other data, boundaries and assumptions, and so on.  If researchers strayed from this format or added additional material, they’d need to say why. The lack of standardization is one of the many reasons policy makers don’t take EROI studies seriously.

In my opinion, this makes it easy for proponents of various renewable solutions to calculate the EROI to be much higher than it actually is.  Without standards, it is easy to increase EROI by not counting the energy to make steel because the researcher claims it was 100% recycled, or cherry-picking the best performing wind or solar farms over the best performing time period, and so on.  Policy makers can’t be expected to make policy decisions or recommendations when EROI studies of wind ranges from 4 to 115.

Meta-studies can’t be done either because there is too much missing data, and/or unstated assumptions, and/or different models used, and rarely is real data available, since private companies don’t have to, and often don’t want to reveal their true performance, operation, and maintenance costs or they’d get less investment and lower stock prices.

Yet even at the conference, several EROI presentations were not clear about their boundaries.  Long after the artificial photosynthesis presentation which would combine hydrogen with CO2 to make liquid fuels (with a spectularly low EROI of only 1.66), I found that the outside boundary was set at 300 feet outside the factory gate and didn’t include storage or delivery to the customer.  Probably not calculated because the EROI would be less than 1, an energy sink.

By the end of the conference I was a bit frustrated at the lack of discussion of boundaries, because this has been a problem for 40 years and is the main problem to be solved to get policy leaders to pay attention, and more importantly fund such studies, since the researchers often have to pay for these studies out of their own pocket.

So at the end of the conference, with this issue rarely referred to the entire time, I asked the panel what they thought should be done about the boundary issue. For example, ethanol studies using narrow boundaries found higher EROI values than those with the widest boundaries, which often found a negative EROI.  I recommended Spain’s solar PV revolution by Prieto and Hall which used real production data over several years rather than theoretical data used in 99.9% of other studies as a good way to decide what to include or not include, since it made sense to make the boundaries wide, not narrow. Also, since nearly every presentation was on renewables that generated electricity, perhaps new standards for a fossil-free world should include how much electricity it would take to transport the 8,000 pieces of a wind turbines supply chain, the electricity to mine iron and make steel, cement, fiberglass, copper, and electric trucks and electric grid and batteries or a catenary system for trucks to deliver goods and the final wind turbine to its site.

I had the strong impression this was not a welcome question. No one leaped to answer, and finally one of the panelists said that the boundaries ought to be wide but that this question was best talked about over a glass of wine.

After this session one of the speakers, Marco Raugei, at Oxford Brookes University, came over.  He was very upset by my question because he thought Prieto and Hall’s book was awful. He told me it was so bad that several scientists had tried to prevent Springer from printing it.

I told Raugei that I had looked very hard for any criticism of the book but had not been able to find any rebuttals, so what exactly was wrong with it?  Raugei replied that the book wasn’t peer-reviewed. Well hello, books aren’t peer-reviewed, surely he knew this…and I pointed out that Farrell in 2006 had used non peer-reviewed papers in his famous ethanol EROI study. So I asked why someone didn’t write an analysis to refute the book? Raugei replied that since it wasn’t peer-reviewed, why bother.

When I asked Raugei to tell me more about what was wrong, he said that it was inconsistent in so many ways, not defensible the way economic inputs were converted from money to energy such as the insurance figures, some air travel expenses, too haphazard, inconsistent in method and goal, not clear enough in stating that this is just one snapshot moment in time in Spain and that it used an ill-advised subsidy scheme, that the EROI is not the same in other countries and parts of the world, and that the goals should have been more explicitly explained. I thought: What goals? Did he think Prieto and Hall had a goal of a low EROI figure?

Prieto has strong motivation to find a high EROI, since he built some of the solar plants he writes about in the book. He could make more money by exaggerating solar PV EROI.  Hall certainly has no dog in this fight.  In general, the scientists who are funded by industry produce the most problematic research.  For example National Corn Growers Association funded scientists found the highest EROI results for ethanol in their non-peer-reviewed papers.  Recently it was discovered that several Harvard scientists were paid by the sugar industry to blame fat, not sugar, for obesity.

It was ironic that Steven Chu was the opening keynote speaker at this net energy conference, since Tad Patzek once wrote me that “Steven Chu decided not to fund my Laboratory Directed Research and Development (at Lawrence Berkeley Laboratory) project whose goal it would have been to arrive at a consistent thermodynamic description of all major energy capture schemes bio and fossil, so that we compare apples with apples. What I did not appreciate is that no one wants to know that they may be working on a senseless project, such as industrial hydrogen from algae. I despair seeing the rapid corruption and sovietization of American science (without the Soviet strengths in basic sciences), but can do little about it. … It is not easy to get funded on the subjects I have proposed.  …In fact, my LDRD proposal to develop the comprehensive thermodynamic language to talk about the different energy resources was just not funded…”

Someday when a future history of science author attempts to write about the history of EROI, I hope that Patzek, Hall, and others have written memoirs that discuss how hard it was to get funding, get published (did scientists really try to prevent Spain’s solar revolution from being published?!), the criticism they received, and so on, because I think it will be of great interest to the grandchildren and further generations down the line.  Understanding why renewables have such low EROI might prevent cargo-cult like behavior to spend huge amounts of resources and time to build them after the dark age that may ensue at some point on the downslope of Hubbert’s curve.


2015-4-11 Pedro Prieto responds to criticism (private communication)

(Bold is my emphasis):

Alice, as promised, let’s start answering and commenting on some of your wise comments.

The first thing is to confirm that no EROI studies can be taken seriously if the range of results varies so wildly. So it is quite a sensible approach to try to reconcile the different studies and methodologies.

Having said that, the prevailing methodology is what fails, specifically in the case of Solar PV analyses, but also in others. Experts in solar PV will have more and more available data as time passes from global installations.

Until now, we had seen many studies on different solar PV technologies with different typologies and topologies. Even before our book “ Spain’s Photovoltaic Revolution. The Energy Return on Investment” (Prieto & Hall. Springer 2013) appeared, there were already many variances and divergences.

Even works of Fthenakis or Raugei have contemplated significant variances in the EROI results over time and with different studies of solar plants.

But they all had a methodology in common: they generally used, as you have correctly pointed out, the best material recovery, the best theoretical solar PV system in each case, the best irradiated areas, the assumption that systems will operate in full along the lifetime with no problems. In summary, a methodology that has helped or served as documentary support or reference to many to reach global conclusions on the long term ability of modern renewables to replace, take over or substitute fossil fuels, from a given particular plant analysis extrapolated massively. That was the case, for instance, of Mark Jacobson and Mark Delucci in their studies on how modern renewables could replace fossils and supply the present global consumption. This is a traditional bottom-up approach.

After my experiences of several years in the field with different technologies, typologies, topologies, latitudes and state of development countries and confronting with the real world results, Charles Hall and myself, after having had a pint of beer in an Irish Pub in Cork commenting these issues, in the ASPO International Conference held there in 2007, decided to embark in a study on solar PV. But we tried to do it in a radically different form. It took us several years of back and forth, discussions, checks and double checks, consulting with other experts and so on.

The study, as many of you may already know, was on a real world installed plant in the best irradiated country in Europe (Spain), with the official and very accurate energy production records of the Ministry of Industry (read by telemetry to more than 40,000 digital sealed meters in each of the respective individual plants) over a period of three complete years (2009-2011). That was the main innovation: a top-down analysis and the huge scope of the solar PV plants working in the real world, rather than theoretical academic bottom-up approaches.

With more than 140 GW of installed plants worldwide, and several complete yearly cycles of operation of many of them, it is going to be increasingly difficult for some authors to continue with the academic approach, to verify real behavior of the EROI.

Now, about the energy input boundaries.

Of course, if we focus only on the energy inputs of the solar modules and their composition (glass, aluminum frame, connection box, copper or silver soldering, doping materials, silicon, ingots, wafers, cells, etc.) and perhaps inverters or metallic structures orienting and tilting the arrays, then we may come with spectacular results in a very good irradiated area with the theoretical module yield. This is what has been generally considered in most of the studies carried out to date and what is proposed by some authors as the recommended methodology.

But this is just one of the factors we looked into when we decided to analyze the energy inputs of a complete solar PV system, not just what appears in the marketing pictures of the solar plants.

After many years working in the field, one can appreciate the number of activities that are indispensable (sine qua non conditions), for a solar PV plant to work and operate as some of the authors of several EROI/LCA/EPBT studies consider they are going to work.

We differentiate some 24 factors and additional analysis that was not absolutely complete nor exhaustive, but proven and existing. None of these factors had been considered or hardly appeared in but few of the analyses made by the most renowned solar PV EROI authors. Your study of our book already identifies some of them and I have mentioned them on many occasions.

One of the factors, “a7” (the energy input required for modules, inverters, trackers (if any) and metallic infrastructures, labor excluded), was precisely the EROI as usually calculated by many authors. We decided not to judge the different results of this universe of conclusions but to accept a sensible average of the range of many publications that gave us an EROI in itself for this concept of 8:1; that is, for 25 years of lifespan an Energy Pay Back Time (EPBT) of 3.1 years. Or an energy input cost equivalent to 0.125 of the total generation along the lifespan of the system.

But then we started to consider the rest of the factors (boundaries or extended energy input boundaries) and discovered that conventional EROI studies were ignoring two-thirds of the energy inputs indispensable to get the solar PV plants into operation.

The list calculated the energy inputs, based on the experience of several plants in Spain and extrapolating to the 4 GW installed power studied in the book, to road accesses to the plants, foundations, canalizations, perimeter fences, evacuation lines, rights of way, O&M module washing or cleaning self consumption, security and surveillance, transportation — sometimes as far as from China, premature phase-out or un-amortized manufacturing and other equipment, insurances, fairs exhibitions, promotions or conferences (like the one you had in Stanford –to whom to attribute the involved energy expenses?), administration expenses, municipality taxes, duties and levies, cost of land rent or ownership, circumstantial labor (notary publics, public officers, civil servants, etc.) agent representative or market agent, equipment stealing or vandalism, communications, remote control and plant management, pre-inscription, inscription and registration bonds and fees as required by the authorities, electrical networks and power lines restructuring ass a consequence of the newly injected 4 GW in a national network with about 100 GW, in unexpected and not previously planned nodes of the grid, faulty modules, inverters or trackers, associated costs to the injection of intermittent loads: network stabilization associated costs (only referred to combined cycle gas fired plants, well known costs).

Some of these factors may certainly have diminished with time. Many others, have certainly increased over time. Taxes, for instance, have raised sharply. Stealing in Spain, for instance, is not relevant, but in many countries of the world it is a problem.

We mentioned and developed a little of the associated energy costs of the injection of intermittent loads, by pump up or other massive electric energy storage systems, because we knew it was going to be fundamental and relevant and did not want to open any more the old wounds in an already meager EROI. These costs are still today in a fierce debate in Spain and in many other countries, but they are certainly relevant, should the modern renewables have to replace the present fossil fueled global societal functions.

As you can see, the BOUNDARIES are of essence to determine the real life EROI, rather than an academic EROI. No one critical of our book, could say, to the best of my knowledge, that any of these briefly listed factors was not a real one and was not needed to have (at least in Spain) a solar PV system up and running along its lifetime. But for some strange reason they had never considered them.

Once they recognized the facts of real life, then this battlefield was rapidly abandoned and shifted to the “comparison” with other energy sources, namely the fossil fuel sources. Some authors were claiming that if fossil fuels were treated with these ‘extended’ energy input boundaries and factors, their EROIs should obviously go down in a similar proportion.

What they did, then, was to use a multiplying factor on the order of 3 for solar PV, arguing that it has a logic, when comparing equivalent systems and using an equivalent methodology. I fully disagree and I have shown in several occasions the reason why:

The world uses (mostly burns) about 13 BToe/year of primary energy or more than 510 EJ/year.

Of that, approximately 170 EJ of fossil + nuclear go to produce an equivalent of 40 EJ of clean and useful electricity, this making the point of Raugei valid to some extent, if the solar PV systems would entirely go to replace electricity produced by fossil fuels, because of the losses of about 2/3 of the primary energy in the conversion process.

But the world is not behaving in this way, as scientists like Raugei and Fthenakis must know. New renewables just enter into the energy equation to simply provide more energy to the global system.

Above all, the most important flaw in this assumption is that the world also consumes about 285 EJ in non-electrical uses, like aviation, civil works, mining, transportation, merchant fleets, armies or agriculture (eating fossil fuels, Dale Allen Pfeiffer). And it happens that if we would pretend to use electricity from renewables to replace the fossil fuels used for these global activities, likely through an energy carrier like the eternal hydrogen promise, the pretended multiplication factor used by Carbajales et. al, would immediately operate in the reverse form and become a division factor, probably in the order of 3, with respect to the direct use of fossil fuels of today. That is why we did not employ this “correction factor” used by Carbajales et al.

I will not enter into this debate further, because I find it futile. I do not care if when treating the EROI of coal, oil or gas with these extended boundaries may go down two-thirds from already published studies, now ranging with the old methodologies, for instance, from 100 to 12:1 for oil, depending on the period and places, or 60 to 20:1 or coal or gas in similar levels.

Taking down these two-thirds of present EROI studies will not change the fact that this society is now operating on 80% fossil fuels.  And makes it possible to move it. This is the final proof.

An important part of the rest (excluding perhaps a part of biomass in underdeveloped countries) is also being produced because the energy subsidies given by fossil fuels to the other sources, like nuclear, or hydro, that we could not have dreamed of having if a well endowed fossil fueled society and its related machinery and technology weren’t available. Nuclear, hydro, solar PV, solar thermal or wind energies are absolutely underpinned by a fossil fueled society, not the vice versa. The global society has been making its growing economic, industrial and technological life basically without those energy sources. But we could not imagine these sources working and feeding themselves in all the complex value chain, plus providing an important net energy surplus to the global society. Not now, nor in a foreseeable horizon.

We can not ignore this crucial fact: biomass helped initially to coal to develop, but 60 years from the first massive use of coal, this fossil fuel had already passed biomass in volume and versatility of use and became quite independent of biomass.

This happened circa 1900, at the level of 800 MToe/year of global primary energy consumption and with about 1.6 billion inhabitants.

Then came oil, much more dense and versatile than coal. It took oil again about 60-70 years to pass coal and biomass as the main global energy source. This happened circa 1960, but then, in a consumption level of 3,000 MToe/year and with 3 billion people on Earth.

Now, we move in the level of 13,000 Mtoe/year of global primary energy consumption and with about 7.2 billion people. But gas or nuclear have not passed oil as the prime energy source. And we have to wonder why, if they were discovered and used massively more than 60 years ago.

Quite the contrary, we are moving fast, because of peak oil, back to the possibility of coal surpassing oil again in a decade or so, as the main energy contributor, but this time, probably at a lower global consumption level and probably with a world population still growing in numbers and in poverty.

The first two big energy transitions (biomass to coal and coal to oil) were made with the surpassed energy source still growing and helping to initially boost the coming one, but soon proved to be quite self sufficient to feed a growing and demanding global society, well after paying for their own energy inputs in the exploration, mining or drilling, extraction, transporting, refining and distributions processes WITHOUT ANY DOUBT, because nobody will doubt the evolution of the last century and the role of the fossil fuels on it. Now, we have to face the third big energy transition, in the highest level of energy consumption and population and with the main energy fuel, oil, in depletion.

Of course, one has to accept that in this complex world, all energy sources are somehow interrelated, but, as Orwell said in The Animal Farm, ‘all animals are equal, but some animals are more equal than others’. This is exactly what is happening with the energy sources and its properties and qualities: they can all be measured in EJ or in TWh or whatever, but some are more equal than others. Meaning that there is an obvious ASYMMETRIC interdependence of energy sources, since in the last century, fossil fuels (and oil in a very first place), were responsible for our present global status.

To me, then, there is a non sequitur to shift the EROI battlefield to try to extend the boundaries in the fossil fuel EROI studies, to lower them and favor renewables by comparison, because whatever the EROI and boundaries are considered, it is obvious that the present global society spending 13 BToe/year of primary energy (80% fossils), has been able in the last century (we shall see for how long) to pay their own energy expenses, AND provide a huge net energy surplus at the disposal of 7.2 billion humans who have grown at a spectacular rate for more than a century.

For instance, when the IEA mentions in their WEOs the costs of ‘subsidies’ to different energy sources, it always calculates much bigger subsidies for fossil fuels than for the modern renewables. It is a sort of energy fallacy, from my point of view.

If the global society has resources to subsidize anything, it is because it has previously gotten a surplus of resources from somewhere. And this ‘somewhere’ is obviously a global society that has created them using mainly fossil fuels at discretion. I can ‘subsidize’ my son to go to the cinema, but I cannot ‘subsidize’ myself from the salary I  earn by myself and saved in my left pocket, by changing it to my right pocket.

I understand that some fossil fueled activities may certainly be ‘subsidized’ in certain forms. For instance, kerosene for aviation in the airports, which is tax exempted in many countries, when compared with gasoline. Or ‘subsidized’ coal prices paid to depleted coal basins in Spain to continue producing low quality brown coal, to keep the social peace in the region and avoid the miners revolting. But it is a fallacy to conclude that ‘somebody’ is ‘subsidizing’ fossil fuels globally speaking, when fossil fuels are 80% of our global activities creating surplus. From a strict energy point of view, fossil fuels are subsidizing basically all world activities. Period.

What in reality the OECD watchdog does is a mystifying operation. When digging up the IEA figures of ‘subsidies’ of fossil fuels, one discovers that they are really talking about ‘prices’ or ‘price levels’ of fuel in the producing countries that are selling them domestically at prices lower than those the IEA  would wish they had, to leave more ground to the big OECD importers to buy this fuel from producers at prices OECD can afford.

Coming back to the energy input expenses in extended boundaries, we also left out the financial costs, despite knowing that they were quite large and generally also a sine qua non factor. Most of the plants have been financed in an 80% of the total turnkey projects at about 10 years term, with interest, that ranged from 2% to 5% per year. I firmly believe that finance is a form of using a pre-stored available resource (in a fossil fueled society, coming from fossil fuel related activities) to erect or put in place and operate a given system. In that case, an energy system. So, when one asks for credit or leasing and has to pay back this resource both the principal and the interest to the bank, in let’s say a 10 year term, this is energy evaporating into the system through the bank.

Labor energy input costs were also left aside, even though we had a very good set of data from industry in Spain, classified by categories, skills and full time and part time employees in the sector. The reason was that some of our factors may have had already included part of this labor in, to avoid some limited duplication.

If we had included these financial (even just the additional money created and having to pay back in the form of interests by the requested credits or leasing) and labor energy input cost, the solar PV EROI would have probably plummeted to  <1:1.

In fact, it is very surprising how they criticize the methodology we used to evaluate the financial data (which they did not question basically in numbers), by stating that the conversion of monetary into energy units is not adequate and do not conform to conventional input-output methodologies. Our methodology is clear in these conversion units and reflects a quite direct relation between GDP and total primary energy spent in Spain or between active labor and energy spent per laborer or any given and specific related industrial activity or service rendered. This despite we mentioned that Spain hasn’t published, for years, any input-output tables for the economy (Carpintero, Oscar).

However, it seems remarkable how some are incapable of detecting any anomaly in describing EPBT’s of solar systems recovering the energy spent in them in a question of few months for a life time of 30 years (EROI’s of 40:1 !!) and the astounding divorce with the economic reality, of a world or promoters that look for about 10 years economic recovery, this including heavy premium tariffs (Germany, Spain, Italy, now UK or France) or tax holidays or exemption (US and others) or economic recoveries that last more than the expected life time, if no economic incentives are given.

Without these incentives, the rest of the world is a renewables wasteland. Promoters are virtually not investing (with few exceptions in volume worldwide) in modern renewables, if there are no such incentives. The 140 GW world installed base so certifies, with about 70% of the global installed base made in developed countries with incentive schemes and some 25% made by emerging countries, like China or India (now Brazil or South Africa in a much lesser amounts), also with strong political incentives to cope world markets, leaving a meager 5% for the rest of the world. Doesn’t this crude reality show anything in their conversion of monetary units to energy units methodologies, to the ones giving EPBTs of few months and financial recoveries of many years?

So, I am not surprised, Alice, that some experts, having in their records tens of papers published with high solar PV EROI results, would have shown some annoyance at your question on our book. I would humbly ask from here that when somebody mentions that we work with some methodological ‘inconsistencies’, -a term to which they are so fond of to disqualify other disturbing views- they should rather look into the above explanations and facts of the real world.

I have kept silent until now on what I consider a very regrettable behavior now made public by Raugei, as per your comments. It is true that they dared to write our publisher asking him to stop publishing the book when it was in a draft version in a sort of censorship I had not seen since several centuries in medieval Spain. The recommendation came after somebody took the draft from our publisher without our consent some time before the release and they tried to stop the publication, even threatening that they would discredit it, as they have been doing since it was published, if it were published.  I have never seen such a type of behavior, even less in the academic instances.

The reason they gave first is that we missed our final EROI (2-3:1 being quite conservative and I reaffirm myself more and more as years are passing) by an order of 3. That was precisely the Raugei view on the penalty to be imposed on fossil fuels, if a clean electricity source could replace every kWh of fossil fuel origin, considering that in conventional fossil fuel (or nuclear plants for the case) we need about 3 units of primary energy to get out 1 unit of electric energy. We tried to clarify this in some posts, but unsuccessfully.

Fortunately, the publisher did not consider this a direct threat and the book was finally published.

As for the Raugei comment that the book was ‘awful’ because it had not been ‘peer reviewed’, he qualifies himself. Just look at the acknowledgements of the book. Two professors in Physics from different universities did review the book and produce sensible comments. Charles Hall, the coauthor, is an institution in EROI, that is here questioned with superficial comments. Besides, I understand that publishing a book is a free decision, that does not necessarily require peer revisions, yet despite that, we did have our work reviewed. Perhaps what Raugei wanted to say is that the peer review was not made by the usual reviewers in an inbreeding game.

I have been observing that in the academic world, things are getting unfortunately tougher. Some of the technical papers have sometimes more pages of references than pages of content (see more of my comments on the article below). In the case of solar PV systems, and the references in published papers, it seems there is an excess of ‘selfies’ which were a fashion in the academic papers. And secondly, it appears that credits are gained or given by the number of references that a given person is quoted and this has started a race for a sort of interbreeding cross-quotations, affirming Tadeusz Patzek’s fears about the ‘Sovietization’ of the American science. Perhaps what disturbed Raugei about our book is that we also skipped somehow from these habits and did not leave to the usual teams a review that, with all probability, would have ended up in the garbage.

Of course, Raugei is right when he presumes that our case is perhaps valid for Spain and for the 4 GW installed within the period 2009-2011. Because if we had considered Germany and its public production of solar PV systems within the same period, the Energy Return in terms of MWh per MWp installed would have been less than half of those of Spain.

I am now retired and happily growing my organic farm. Not now or since 2001, when I left working for a telecom corporation, have I had any interest in discrediting or crediting solar PV systems. I am not making my life by publishing papers and trying to gain credibility on a given subject. If anything, I should have defended, as you very well stated, the solar PV systems, because I own 50 kW within a 1 MW plant that I manage and I have helped to design, develop and done some consulting (including what we call here ‘permisología’, the intricate paperwork to get all permits and licenses to the the solar PV plants) of more than 30 MW that are working with different technologies, typologies, and topologies in different latitudes in Spain. I have also cooperated with projects in some Latin American and African countries and I have worked as director of Development of Alternative Energies for a listed Spanish company for a couple of years within the period.

Just a final nota bene, with additional comments on the paper Energy return on investment (EROI) of solar PV: an attempt at reconciliation. Michael Carbajales-Dale, Marco Raugei, Vasilis Fthenakis, Charles Banhart Journal of Latex Class Files. Volume 11 No. 4 December 2012

1) http://www.researchgate.net/profile/Michael_Carbajales-Dale

2) select the thumbnail picture on the left and then download

I can’t get the link provided to work, but maybe it’s my computer settings: http://www.researchgate.net/publication/271699871_Energy_return_on_investment_%28EROI%29_of_solar_PV_an_attempt_at_reconciliation:

The title of this paper, is a supposed attempt to reconcile different views on solar PV EROI, but I have never been informed by the authors of it, even though I have the dubious honor of being cited several times in it.

I did not know that I had formed a so-called “Prieto group in Madrid”, in second place, after Fthenakis group in Brookhaven and before Weissbach group in Berlin or Brandt group in Stanford.

Also surprising is that the document is dated December 2012 and our book was not published until the spring of 2013. Even more surprising, is that the book is criticized several times with the wrong citation:  P. Prieto and C. Hall, “Eroi of Spain’s solar electricity system,” 2012 rather than the correct Prieto & Hall. Spain’s Photovoltaic Revolution. The energy Return on Investment”. Springer, 2013, in the bulky references, that occupy almost as much space as the article in itself. This does not seem to be a very edifying example in referencing others.

Then, the paper comments that “an average energy payback time (EPBT) of 3 years and lifetime of 25 years are used to calculate the EROI subscript PE-eq = 8.33 value for this part of the system. No references are given for any other input data; though it appears that anecdotal worst cases of installations were generalized by the authors”.

Well, a brief look to the a7 factor (page 78) of Energy derived from Conventional Life Cycle Analysis Studies and Calculated as an Inverse Factor of EPBT”, comes out with an EROI of 8:1 for the energy content in modules, inverters, trackers and metallic infrastructure, quotes some works of Fthenakis, Alsema and Kim among others not cited, not to make too boring the EROI publications ranging around 8:1 in their conclusions and with these parameters analyzed (without extended energy input boundaries). Some more could be found in many places. In fact, these levels of EROI for solar PV were quite common in the early years of 21st century. See, for instance, Bankier and Gale in its Energy Payback of Roof Mounted Photovoltaic Cells. Energy Bulletin. June 16. 2006, where they come out with a number of EROI’s ranging from EPBT’s from 1 year (EROI 25:1) to 25 years (EROI = 1:1)

Author Low Estimate (years) Low Estimate Key Assumptions High Estimate (years) High Estimate Key Assumptions
Alsema (2000). 2.5 Roof mounted thin film module 3.1 Roof mounted mc-Si module
Alsema. & Nieuwlaar (2000) 2.6 Thin film module 3.2 mc-Si module
Battisti & Corrado (2005) 1.7 Hybrid photovoltaic / thermal module 3.8 Tilted roof, retrofitted mc-Si module
Jester (2002) 3.2 150W peak power mc-Si module 5.2 55W peak power mc-Si module
Jungbluth, N. (2005) 4 mc-Si module if emissions are not taken into account 25.5 sc-Si module if emissions are taken into account
Kato, Hibino, Komoto, Ihara, Yamamoto & Fujihara (2001) 1.1 100MW/yr a-Si, modules including BOS 2.4 10MW/yr mc-Si module including BOS
Kato, Murata & Sakuta (1997) 4 Sc-Si module. Excludes all processes required for micro-electronics industries. 15.5 sc-Si module. Includes all processes required for micro-electronics industries.
Kato, Murata & Sakuta, (1998) 1.1 a-Si module. Excludes all processes required for micro-electronics industries. 11.8 sc-Si module. Includes all processes required for micro-electronics industries.
Knapp & Jester (2001). 2.2 Production thin film module 12.1 Pre-pilot thin film module
Lewis & Keoleian (1996). 1.4 36.7 kWh/yr frameless a-Si module located in Boulder, CO 13 22.3 kWh/yr a-Si module with frame located in Detroit, MI
Meijer, Huijbregts, Schermer & Reijnders (2003). 3.5 mc-Si module 6.3 Thin-film module
Pearce & Lau (2002). 1.6 a-Si module 2.8 sc-Si module
Peharz & Dimroth (2005). 0.7 FLATCON (Fresnel-lens all-glass tandem-cell concentrator) module – 1900 kWh/(m2 yr) insolation 1.3 FLATCON (Fresnel-lens all-glass tandem-cell concentrator) module – 1000 kWh/(m2 yr) insolation
Raugei, Bargigli & Ulgiati (2005) 1.9 CdTe module including BOS 5.1 mc-Si module including BOS
Schaefer & Hagedorn (1992). 2.6 25 MWp a-Si module 7.25 2.5 MWp sc-Si module
Tripanagnostopoulos, Souliotis, Battisti & Corrado (2005). 1 Glazed Hybrid photovoltaic / thermal 4.1 Unglazed Hybrid photovoltaic / thermal
Alsema E. (2000). Energy Pay-back Time and CO2 Emissions of PV Systems. Progress in Photovoltaics: Research And Applications, 8, 17-25.
Alsema. E. Nieuwlaar, E. (2000). Energy viability of photovoltaic systems. Energy Policy, 28, 999-1010.
Battisti, R. Corrado, A. (2005). Evaluation of technical improvements of photovoltaic systems through life cycle assessment methodology. Energy, 30, 952–967.
CSIRO, Advanced Gasification Research Facility, Queensland Centre for Advanced Technologies, http://www.cat.csiro.au/3_4.htm
Jester, T. (2002). Crystalline Silicon Manufacturing Progress. Progress in Photovoltaics: Research and Applications, 10, 99–106.
Jungbluth, N. (2005). Life Cycle Assessment of Crystalline Photovoltaics in the Swiss ecoinvent Database. Progress in Photovoltaics: Research and Applications, 13, 429–446.
Kato, K. Hibino, T. Komoto, K. Ihara, S. Yamamoto, S. Fujihara, H. (2001). A life-cycle analysis on thin-film CdS/CdTe PV modules. Solar Energy Materials & Solar Cells, 67, 279-287.
Kato, K. Murata, A. Sakuta, K. (1997). An evaluation on the life cycle of photovoltaic energy system considering production energy of off-grade silicon. Solar Energy Materials and Solar Cells, 47, 95-100.
Kato, K. Murata, A. Sakuta, K. (1998). Energy Pay-back Time and Life-cycle CO2 Emission of Residential PV Power System with Silicon PV Module. Progress in Photovoltaics: Research and Applications, 6, 105-115.
Knapp, K. Jester, T. (2001). Empirical Investigation of the Energy Payback Time for Photovoltaic Modules. Solar Energy, 71, 165–172.
Lewis, G. Keoleian, G. (1996). Amorphous Silicon Photovoltaic Modules: A Life Cycle Design Case Study. National Pollution Prevention Center, School of Natural Resources and Environment, University of Michigan.
Meijer, A., Huijbregts, M., Schermer, J. Reijnders, L. (2003). Life-cycle Assessment of Photovoltaic Modules: Comparison of mc-Si, InGaP and InGaP/mc-Si Solar Modules. Progress in Photovoltaics: Research and Applications, 11, 275–287.
Odum, H. (1996). Environmental Accounting: Emergy and Environmental Decision Making. John Wiley & Sons, New York.
Pearce, J., Lau, A. (2002). Net Energy Analysis for Sustainable Energy Production from Silicon Based Solar Cells. Proceedings of Solar 2002 Sunrise on the Reliable Energy Economy June 15-20, 2002, Reno, Nevada
Peharz, G., Dimroth, F. (2005). Energy Payback Time of the High-concentration PV System FLATCON. Progress in Photovoltaics: Research and Applications, 13, 627–634.
Raugei, M. Bargigli, S. Ulgiati, S. (2005). Energy and Life Cycle Assessment of Thin Film CdTe Photovoltaic Modules. Energy and Environment Research Unit, Department of Chemistry, University of Siena, Italy.
Schaefer, H. Hagedorn G. (1992). Hidden Energy and Correlated Environmental Characteristics of P.V. Power Generation. Renewable Energy, 2, 15-166.
Tripanagnostopoulos, Y. Souliotis M. Battisti R. Corrado A. (2005). Energy, Cost and LCA Results of PV and Hybrid PV/T Solar Systems. Progress in Photovoltaics: Research and Applications, 13, 235–250.

As can be seen from the above, we were far from using as an EROI for modules+inverters, plus metallic infrastructure in a sort of anecdotal worst cases of installations generalized by the authors. On the contrary, we were more in the low estimate in years (high estimate EROI), than using worst cases.

Now, for the record, it should also be very convenient for all the prolific authors on solar PV EROI to revise the figures given in papers published several years ago, to double check how are they performing (Energy return statistics). We are very anxious and expectant to learn how it has gone with, for instance, the hybrid PV/Thermal promising analysis, or even better, the results, years after publication, of the Fresnel lenses combined with high efficiency cells in concentration mode.

I recall specifically in this respect  the V.M. Fthenakis and H.C. Kim paper, titled “Life Cycle Assessment of High-Concentration PV Systems”, in which they analyzed the estimated EPBT of the Amonix 7700 PV high concentration system with Fresnel lenses in operation at Phoenix , AZ, and found 0.9 yrs for its EPBT. I wonder if they could still support this analysis, just five years after their study and how the promising system has contributed to the grid parity worldwide, considering they recovered the energy spent on it in less than one year.

Scientific authors should be more careful when accusing to others of using ‘anecdotal worst cases’, especially for the expected Energy Return along a life time, when they are probably using ‘anecdotal best cases’, instead of basing their research on real life 3 years cycle proven and official statistics of production for 4 GW of installed parks.

Talking about the life time (directly involving the Energy Return), it is very interesting to see how some papers have changed the estimated life time of solar PV Systems from 25 years to 30 years. It is curious that virtually all manufacturers give a maximum of 25 years of power guarantee of their modules (with the corresponding degradation process over the years) and 5 years of material guarantee (the latter superseding or prevailing on the former in case of failure) and we find scientists happily granting 30 years for the EROI studies. In my opinion this is a clear attempt to produce higher EROI’s and lower EPBT’s with no rational grounds.

The fact that the Carbajales et al paper ends recommending “that the conventions outlined by the EIA PV Systems Program Task 12 (Environmental, Health and Safety) be followed in conducting EROI calculations, considering that the IEA methodology has easily swallowed the 30 years life time for solar PV modules, gives us a very clear clue of what is going on with these recommendations.

In our discussions on this topic a couple of years ago, an editor came to say that if our factors were really sine qua non (indispensable) for the system to be up and running and the IEA methodology did not considered them, it was time to change the IEA methodology.

I would just recommend the IEA tour Spain (it is not the worst country in solar PV systems; on the contrary, it is one of the most efficient in terms of MWh produced per Mw installed). The IEA should come and check and double check how many solar PV plants have not lasted, for a variety of reasons, the 25 year life time of the manufacturers or the 30 years of the IEA backed by some scientists. Just in 2015 alone about 40 MW have been dismantled, with a lifetime averaging about 5 years. Trials are the delight of reputable and expensive law firms, which earn quite a lot of money preparing lawsuits against promoters, manufacturers, banks and the government. That is real life, far beyond the academic instances. I am following now a demand of a promoter that has decided to buy 2/7th of the modules he originally bought for his 500 kW plant, because the manufacturer (not Chinese), he originally bought from 6 years ago, has disappeared, as have most of the European manufacturers in the last 5 years. One wonders what is the value of a technical guarantee on power, if the life time of the manufacturers becomes much shorter than the one of the power of the promised modules. This is, of course, ‘anecdotal’, although not for the interests of the affected promoters.

Conclusion:

After a couple of years from the publication, I have much more data to reaffirm for myself that we were really conservative in our 2.4:1 EROI for many different reasons and factors. But I will not publish more data. I will go back now to my organic garden and wish you all the best for what I suspect may be a grim future.

Antonio Gramsci: “I’m a pessimist because of intelligence, but an optimist because of will.”


2015-4-11 Ted Trainer responds to criticism of Prieto & Hall

Trainer is the author of “Renewable Energy Cannot Sustain a Consumer Society” 

It is very disappointing that so much confusion and acrimony surrounds the crucial issue of boundaries, and that they seem not to be moving to a resolution as quickly as they should be. There are of course big interests at stake, with the conventional high EROI assumption suiting the industry and the theorists who put out such claims. At the very least Prieto and Hall should be commended for getting the whole messy issue of boundaries and components, and appropriate energy cost assumptions for the various components, on the agenda. Sadly the disputation over this issue illustrates the way scientists are not immune from prejudiced and nasty behavior, (a considerable amount of which my efforts to analyze renewables has evoked.) When large scale research funding is at stake there can be strong incentive for competitors to reinforce perspectives that suit them.

As I see it, the goal should not be a single EROI figure for PV, because much depends on the situation and conditions. We need values for modules operating at the average site in Spain with its level of radiation and losses, and we need figures for the various components in the system, such as energy used to produce modules in the factory, energy used to produce the factory, energy lost in inversion, in typical inefficiency due to dust, poor alignment…, and in transmission, energy embodied in inverter replacement, energy used to get workers to the factory, energy used for Operations and Management at the solar farm, energy “retrieved” when the modules are recycled. A fairly thorough provision of these elements would enable anyone to work out the EROI for a particular plant at a particular location, and most importantly the EROI assuming a given set of boundary assumptions. Graham Palmer has just begun a PhD at Melbourne U intended to sort all this out.

I strongly object to Raugei’s comments to you re peer review. I have little respect for the entire peer review edifice, due to my unsatisfactory experience in trying to get critical analyses published. Very often I have found the comments of reviewers to range between nit picky imposition of the way they would have expressed things or gone about the job, through reasoning that I see as at least challengeable and at times dead wrong, to rejection on utterly idiotic grounds … such as being told that my recent 20 page detailed critique of the 2014 IPCC report on renewables was “not scientific”, after waiting seven months for review. (That phrase constituted the full case given for rejection.) On another occasion, where it took over a year to get through the difficulties, I was presented with a seven page essay disagreeing with elements in my case. If that reviewer wanted to express a different view he should have done it somewhere else, not try to insist that I say what he would have said. I have another case where a 50 word review from probably the most prestigious individual in the field said the paper was good, but the paper was rejected because a second even shorter review was unfavourable. The reasons were so unintelligible that I had to ask what they meant. It eventuated that the editor said he didn’t think it was the kind of paper his journal published … after I had waited seven months.

I see the process as far too prone to the whims, prejudices and in fact arrogance of reviewers and editors. They should get out of the way and let people say what they have found or think, and focus only on things like pointing out mistakes or pointing to overlooked evidence or assumptions, or logical errors. Their role should be to help get ideas and analyses out to others, and to block only as a last resort. Too often I have found that reviewers think their role is to make authors conform to their preferred style and they assume the right to condemn work that doesn’t proceed as they would have. I have written reviews in which I say I think the argument is wrong and the procedure not satisfactory but I think the paper should be published, because I could be mistaken and the paper does present a case that it is important for us to think about.

Ultimately what matters is not whether some guru approves of your analysis, what matters is whether the case is sound/convincing/persuasive/well supported, and that judgment should be up to readers, and the quality of the work should be established over time as others in the field comment on it. My main concern here is what must be the large amount of time and good work that doesn’t get published because of the whims of some guru. I would assume that most of us have had papers rejected by one set of reviewers but regarded highly by those from another journal.

So I see any attempt to block publication of controversial, and even flimsy/challengeable cases, on grounds to do with “peer review” as very annoying. I have no interest in whether or not it was peer reviewed; what matters is whether or not the case it argues is sound, or valuable, or ought to be heard. (Theses that are dead wrong can turn out to be valuable contributions, by helping subsequent discussion to clarify an issue.) Whether or not it was peer reviewed has nothing to do with whether or not it is correct, or a valuable contribution, and, Alice, should certainly not be regarded as “a valid criticism”.

In my view Raugei raises some important problems, such as the effect on the Pietro and Hall conclusions had by the Spanish subsidy system, but it’s appropriate to now sort these, not to regard them as reasons why the gook should be rejected.

The most important issue he raises is in claiming that the energy input to PV production should be reduced to one-third, on he grounds that it is electricity and PV produces electricity. As I see it this simply depends on whether the electricity used to produce the modules is coming from PV (or wind or CSP) generating systems … and at present it isn’t. In a world where all electricity came from PV farms it would make sense to put the value of the electricity input into the denominator of an EROI, but in the presenter world the energy going into production is (mostly) coal.


Posted in Charles A. S. Hall, EROEI Energy Returned on Energy Invested, Pedro Prieto, Photovoltaic Solar, Solar EROI | Tagged , , , | Comments Off on Tilting at Windmills, Spain’s disastrous attempt to replace fossil fuels with Solar PV, Part 2

Agricultural Transportation and Energy Issues. Senate hearing 2005.

Preface. What follows are excerpts from this hearing.  Over and over senators warn of our dependence on oil.  The question is: what are they doing about it?  I’d guess given the crackdown on immigration that the government is aware of limits to growth, though since 1 million legal immigrants are admitted a year, perhaps not…  What’s scary to me is that the military and homeland security are certainly planning for social unrest when energy grows scarce, and probably the military has dibs on the Strategic Petroleum Reserve when times get tough.  But those plans are being kept hidden from the public.

Alice Friedemann    www.energyskeptic.com   author of 2021 Life After Fossil Fuels: A Reality Check on Alternative Energy best price here; 2015 When Trucks Stop Running: Energy and the Future of Transportation”, Barriers to Making Algal Biofuels, & “Crunch! Whole Grain Artisan Chips and Crackers”. Podcasts: Crazy Town, Collapse Chronicles, Resistance Radio, Derrick Jensen, Practical Prepping, KunstlerCast 253, KunstlerCast278, Peak Prosperity, XX2 report

***

Senate 109–510. November 9, 2005. Agricultural Transportation and Energy Issues. U.S. Senate. 123 pages. 

SENATOR NORM COLEMAN, MINNESOTA

Our transportation system is the lifeblood of agriculture.

U.S. agriculture is highly dependent upon the effectiveness of our integrated agriculture transportation system, and poor transportation directly adds to farmers’ bottom lines. Truck, rail, and river must be able to work together to compete with each other and keep the price of transportation down.

The transportation and energy challenges we face this year hit our farmers particularly hard.  Both transportation and energy are basic inputs into almost every farm and business, so high transportation and energy costs go to the heart of our competitiveness as a nation.

Congress recently passed a Highway Bill to address many of our surface transportation needs, but we have yet to pass the Water Resources Development Act, known as ‘‘WRDA,’’ to authorize crucial funding for our water infrastructure. Improving our river navigation will not only lower the cost of doing business for producers, but also mean less highway congestion

Hurricane Katrina certainly highlighted the importance of river transportation to farmers, which was devastating to the agriculture transportation system in and around the Mississippi Gulf region. Overall, this area is responsible for about 60 to 70% of U.S. world grain exports.

It is estimated that one in four acres of U.S. production is destined for export channels; 60% of which goes through New Orleans to the Gulf.

Rail and truck transport have been critical for agriculture in this time of interrupted river traffic; but clearly, agriculture is heavily dependent on our rivers. And we cannot expect to compete with the rest of the world using locks over 70 years old, as we have on the Upper Mississippi River system.

But all of us here know transportation costs can’t be just boiled down to infrastructure. The price paid for energy has an enormous impact. And beyond transportation, energy prices are taking a severe toll on our farmers.

On average, energy accounts for about 13% of a farmer’s expenses. The increased costs of fertilizer caused by high natural gas prices, combined with extraordinarily high diesel prices and high transportation costs, have been a true challenge for producers today, who can’t raise their prices and are forced to absorb these very severe increases.

Clearly, our energy problems go far beyond Hurricane Katrina. I want to share  a few numbers with you: 37, 53, 60, 74. These four numbers represent the percentage of petroleum supplies we purchased overseas in 1980, 2002, today, and the projected purchases we will make in 2025: from 37 to 74. We were addicted to foreign oil in 1980; wherein our costs double our dosage down the road.

I am serious when I say that this Nation’s energy dependence is the greatest threat to our economy, our security, and our freedom that this Nation faces.

***

Fletcher R. Hall, Executive Director. The agricultural and food transporters conference of the American Trucking Associations.

According to U.S. government estimates, the transportation of agricultural commodities and products accounts for a significant portion of all U.S. freight traffic. In fact, defining agricultural movement to include movements of farm inputs, raw agricultural commodities, and processed agricultural commodities, agriculture is a primary user of transportation services in the U.S. at over 23% of total tonnage and over 31% of the total ton-miles, moved every year.

The U.S. agricultural sector depends extensively upon truck transportation for a number of reasons. Agricultural production typically occurs in areas substantially removed from the final markets of agricultural products.  Production and processing are generally dispersed over wide areas or regions. Agricultural commodities and products also tend to require a wide range of transportation services which are significantly impacted by energy issues and energy prices.  Agricultural commodities and products such as grains, are bulky and of low value. Others, such as fresh fruits and vegetables, and meats are highly perishable and of high value. Still others, such as livestock, require specialized handling and equipment. Modern commercial agriculture is also input-intensive, using a broad range of products from fertilizers to feed additives. These inputs generate demands for truck transportation, and their costs are affected by the price and availability of various forms of energy.

The trucking industry is essential to agriculture as trucks are now the primary transport mode for the movement of all major agricultural commodities.

  • Trucks are the leading transport mode for the movement of fresh fruits and vegetables in the U.S., with a market share of over 90%
  • 95% of livestock transportation is handled by truck, and fresh dairy products are primarily handled by trucks as well
  • According to the USDA’s latest grain transportation modal share analysis (October 2004), trucks transported 68.4% of all domestic grain movements ni the U.S. during the year 2000. Rail and barge shares decreased, while truck shares increased through 2000,making trucks the dominant mode for grain transport.
  • Trucks are the largest carrier of produce to ocean ports for export

Rising fuel costs have the potential to create a ripple effect through the economy whereby consumers are likely to see higher costs for whatever they are purchasing whether grown on a farm or delivered by truck. This is significant because 80% of communities in the U.S. get their goods solely by truck.

Higher diesel prices will raise the cost of harvesting and post-harvesting treatment e.g., drying, moving and storing of crops in and from the field. Higher energy costs in agricultural transportation will cause food prices to rise, as much as 3.5% this year (versus 2.5% per year in the preceding decade).

***

SENATOR KEN SALAZAR, COLORADO.    Here is what I am hearing from my state during harvest. Agriculture producers are some of the largest fuel consumers in the U.S., and producers are facing enormous fuel costs. For example, in Grand Junction, Colorado, diesel prices today are still over $3 a gallon. I have heard from a farmer in Brandon, Colorado, who has a dry land wheat farm of about 5,000 acres. He has seen a 217% increase in diesel costs, and about a 71% increase in gasoline costs since the summer of 2004. This operation will use about 200 to 250 gallons of diesel per day during the heavy farming season. If fuel prices do not moderate, this farmer will realize a doubling of fuel costs for 2006; equating to an additional $16,000 annually, just for his fuel expenses on his farm. I heard from another farmer in northeastern Colorado who, in order to cover the increasing price of fuel, has applied for additional loans from his local bank; only to be turned down because he was already over-extended on his existing loans. These anecdotes illustrate a problem which goes far beyond the borders of Colorado. After 5 years of weather-related disasters, such as droughts, hurricanes, or fires, these higher-input costs are having a severe impact not only on producers’ ability to harvest this year, but also in their ability to secure financing to operate for the next year. This is a crisis that is undermining the stability of farming operations across our country. This is a crisis and emergency that we must address.

I believe they need economic loss assistance, which will help offset the staggering increases in fuel and fertilizer costs.  Our producers are in a downward spiral, and we must help end that downward spiral. Each day, this energy crisis continues to drive farmers and ranchers into deeper debt, putting the life of our rural communities at risk.

SENATOR BLANCHE LINCOLN, ARKANSAS. The severe drought conditions which the country has seen, particularly in our region, combined with the high fuel costs, have forced our farmers to experience extremely high operating costs. We are hearing from our bankers, as well, our financial institutions. I have got three counties of banks that are telling me that they are going to have a record number of farm operations that will not be able to pay out or cash-flow because of the record amounts of resource they have had to put into producing a crop, and then to find the natural disasters that have wreaked havoc on them at harvest time. So it is a time when we have to remember what it is our producers do. And they do it very quietly. Very quietly, they produce the safest, most abundant and affordable food supply in the world. They make sure that, per capita, we pay less for our food supply than any other developed nation in the world. Our farmers are devastated, in terms of these fuel costs. And it is not just in terms of the diesel they put in their tractors. It is also the feedstock for their fertilizer. They are paying record prices for fertilizer, the feedstock, in the natural gas that is causing that to happen. And the projection is that in the next several years, we will no longer have a domestic production of fertilizer. So once again, we are going to set another variable onto our producers of not knowing what and when they can depend on the products that they need in order to produce this safe and abundant food supply.

Those small, rural county roads oftentimes are not able to transport the large cotton modules and the other crops that we grow. So we have got a lot of different issues there. But without a doubt, the fuel costs are the greatest burden that our farmers are carrying right now.

I would like to also echo Senator Salazar, in terms of relieving our dependence on foreign oil.

One consistent thing I hear from our ag producers in the South, it is, ‘‘Please, please, allow us to be a part of providing the kind of fuels, the renewable fuels, that we need in this country, to lessen our dependence on foreign oil and give us yet one more secondary market where we can market our products and our crops.’’

SENATOR DEBBIE STABENOW, MICHIGAN.   one of the reasons I was a strong supporter of the energy provision of the 2002 Farm Bill was because of the important ways in which we in agriculture can help to solve the problem of our dependence, over-dependence, on foreign oil.

KEITH COLLINS, PH. D., CHIEF ECONOMIST, U.S. DEPARTMENT OF AGRICULTURE.  The hurricanes also worsened the already tight energy situation. Farmers paid 43% more for diesel fuel in October 2005 than a year earlier; while prices paid for fertilizer by farmers were up 13% this October, compared with last October.

HOWARD GRUENSPECHT, DEPUTY ADMINISTRATOR, ENERGY INFORMATION ADMINISTRATION, U.S.

Hurricanes Katrina and Rita wrought incredible devastation on the central Gulf Coast; most importantly, in terms of human suffering, but also in energy impacts that have spread well beyond the stricken area. At its peak impact, Katrina shut down over 25 % of U.S. crude oil production, 20 % of our crude imports, 10 % of our domestic refining, and over 15 % of U.S. natural gas production. Rita compounded those impacts. For example, nearly 30 percent of total U.S. refining was shut in ahead of Rita, and outages continued at nearly 20 percent of refining capacity for some weeks thereafter.

The farm sector, as many of you have mentioned in your opening statements, is a significant consumer of energy, particularly diesel fuel, propane, and electricity. In addition to direct farm use of energy, agriculture is indirectly affected by energy requirements in the fertilizer industry, specifically in nitrogenous fertilizers.

Even before Hurricane Katrina struck, crude oil and petroleum prices were setting records. Oil prices worldwide have been rising steadily since 2002, due in large part to growth in global demand which has used up much of the world’s surplus production capacity. Refineries have been running at increasingly high levels of utilization in many parts of the world, including the United States.

Using previous information about energy use on farms and in closely related sectors, every additional dime added to the price of gasoline and diesel oil per gallon, sustained over a year, costs U.S. agriculture almost $400 million annually. Every dollar added to the price per 1,000 cubic feet of natural gas costs agriculture over $200 million annually in direct expense, and costs the fertilizer industry almost $500 million annually. Every dime increase in the price of propane costs agriculture over $200 million per year. Every penny increase in the price per kilowatt-hour of purchased electricity costs agriculture about $500 million annually in direct expense, and also adds about $35 million to the costs of the nitrogenous fertilizer industry.

Mr. COLLINS.  Early in my career, we used to always say that truck transportation was 3 times as expensive as rail, and rail was 3 times as expensive as barge. So if rail or barge wasn’t available, you did truck. If it was between rail and barge, you did barge. But that is not so true anymore. Because of the high energy prices, because of the demand, because of an economy that grew at 3.8 % last quarter, there has just been tremendous demand for all modes of transportation.

As far as farmers that would be exiting agriculture or unable to finance their operations,  I can’t answer that question. There are too many factors that determine whether someone is going to go out of business or not. You can’t take a change in energy costs in 1 year and translate that into somebody leaving the business. American agriculture is incredibly diverse. People have tremendous sources of income outside of farming. Farm income accounts for 13 percent of total household income of all 2.1 million farms, so they have other sources of income to draw on if they wanted to stay in business.

SENATOR TOM HARKIN, IOWA.  Our inland waterways transport 16 % of our goods, at 2 % of the cost of fuel usage. So it is very efficient, very effective.

Senator TALENT.  I think the ability of our producers to continue to produce the safest and most abundant and highest quality food supply in the world is not just an economic issue. It is a national security issue. I don’t want to be in a position where we are importing food the way we import oil. And part of that means, when there is some extraordinary hit on the farm sector, we should ameliorate a little bit some of the costs that they have had to take because of that. I don’t view that from an ideological perspective. For me, that is just a question of trying to protect the food security of the people of the country. To say it is unprecedented, is factually incorrect.

Mr. COLLINS.   I think providing a payment for energy price increases that would affect farmers like they affect every other business in America, like every other household in America—would be unprecedented. I think that would be unprecedented. Certainly, in the disasters that you spoke about, we did provide assistance. And those were focused on agriculture and on crop losses; and they were special, localized, specific disasters. We face a $5 billion increase in energy costs in agriculture this year. We are predicting next year we will face a $2 billion increase in interest costs. Interest is an input just like energy is an input. So how do you distinguish covering interest rate increases from energy increases, when this would be a national impact that affects everybody; not just unique to agriculture?

DANIEL T. KELLEY, National Council of Farmer Cooperatives, Normal, Illinois, on behalf of the AG Energy Alliance 

U.S. agriculture and related agribusinesses use natural gas for irrigation, crop drying, food processing, crop protection, and nitrogen fertilizer production.

Since 2002, 36% of the U.S. nitrogen fertilizer industry, which uses natural gas as a raw material, has been either shut down or mothballed. According to the U.S. Department of Agriculture, farmers’ fuel, oil, and electricity expenses have increased from $8.6 billion to $11.5 billion, from the period 1999 to 2005. Over that same period, fertilizer expenditures went from $9.9 billion to $11.5 billion. Combined, these expenditure increases represent a $4.5 billion decline in U.S. farmers’ bottom line over that 6–year period. The U.S. chemical industry has been especially hard hit by high energy prices, since natural gas is needed as a feedstock. Its natural gas costs increased by $10 billion since 2003, and $40 billion of business has been lost to overseas competitors, who pay much less for natural gas. Chemical companies closed 70 facilities in the United States in 2004 alone, and at least 40 more have been tagged for shutdown. Of the 120 chemical plants being built around the world with price tags of $1 billion or more, only one of those is being built in the U.S. Our Nation’s current natural gas crisis has two solutions: to increase supply; and second, to reduce demand. The challenge is to find ways to balance our Nation’s dwindling available supply of, and rising demand for, natural gas.

Congress can adopt measures to ensure potential Federal lands and Outer Continental Shelf areas are open for leasing; that leases and permits are issued promptly; that the appropriate tax and royalty policies are in place; and that the necessary pipeline infrastructure is available to bring supplies to market; while leaving behind as small an environmental impact as possible. The agriculture community believes that it is strategically critical for Congress to remove these production barriers now, to provide new sources of natural gas and oil supplies.

RICHARD CALHOUN, VICE PRESIDENT, GRAIN AND OILSEED SUPPLY CHAIN—NORTH AMERICA, CARGILL INCORPORATED; ON BEHALF OF THE NORTH AMERICAN EXPORT GRAIN ASSOCIATION, AND THE NATIONAL GRAIN & FEED ASSOCIATION

The transportation system in the United States has for many decades been one of the true competitive strengths of U.S. agriculture. For a number of reasons, this asset has turned from a potential strength to a potential weakness. Higher energy costs, congestion on railroads and highways, lack of investment in modernizing and maintaining the inland waterway system, as well as the recent storm-related problems, are combining to sharply escalate the costs of moving agricultural products to market.

The U.S. transportation system serving agriculture, including barges, railroads, and trucks, was running at virtually full capacity at the time Katrina struck the United States. The loss in transport capacity from that storm proved how vulnerable the U.S. is to such disruptions.

Barge transportation is 2.5 times as fuel efficient as rail movements, and almost nine times as efficient as trucking product. So as energy is likely to remain expensive, and energy conservation is a national goal, the time is nigh to begin seriously investing in modernizing the commercial navigation system.

NEAL ELLIOTT, PH. D., P.E., INDUSTRIAL & AGRICULTURAL PROGRAM DIRECTOR, AMERICAN COUNCIL FOR AN ENERGY-EFFICIENT ECONOMY

America, I would say, is in an energy straitjacket right now.  It will take several years, if not longer, to make significant expansion in energy resources. However, there is one resource that is available to us today, and that is energy efficiency and conservation. This is a resource that we can bring to the market both quickly and cost effectively. And we have seen several examples of those in recent years. In California and New York in 2001, energy efficiency and conservation played a major role in reducing demand and rebalancing energy markets; which avoided major economic losses.

RYAN NEIBUR, ROCKY MOUNTAIN FARMERS UNION, BURLINGTON, COLORADO.   The price of natural gas has increased 215 % in the last 3 years. This increase has raised my cost of irrigation per crop year from $50 an acre in 2003, to $158 expected in 2006. At this rate, farmers will not be able to afford irrigation, and will be forced to dry-land farm in an area that has been in a drought for 5 years. In my situation, dry-land farming irrigated ground is not an option with my bank.

Natural gas is the main ingredient used to make anhydrous ammonia and liquid nitrogen. In 2003, we paid $295 a ton, compared to $495 a ton in 2005. In the production of our corn crop, this price increase translates into a cost-per-acre change of $37–per-acre in 2003, to $62–an-acre in 2005; almost doubling the cost.

In December 2003, I paid $1.10 a gallon for farm fuel. In October 2005, I paid $2.85 a gallon, for the same farm fuel; an increase of over 155 percent. On my farm, fuel expense has gone from $60,700 in 2004, to over $135,000 in 2005. If you put this into a per-acre basis, it is extremely scary. Fuel cost for harvesting corn in 2004 was costing $9.80 per acre. In 2005, fuel cost for harvesting this year was over $22 per acre. Remember, the price of corn has not increased; nor has the yield. Farmers and ranchers are in a situation that does not allow us to pass on these additional costs as a surcharge; which other industries, such as truck lines and airlines, are able to do.

As a farmer, I have no means by which to pass on the higher costs of energy. And it seems that Congress should consider approving some type of mechanism to help farmers and ranchers offset these higher costs.

NFU has been a longtime advocate for renewable fuel standards and renewable bio-based fuels. And we believe that more efforts need to be made to produce fuel and energy from our farms.


Posted in Transportation, Trucks, U.S. Congress Energy Dependence, U.S. Congress Transportation | Comments Off on Agricultural Transportation and Energy Issues. Senate hearing 2005.

Doomsday: Will peak phosphate get us before global warming?

Price, Ed.  July 22, 2013. Doomsday: Will Peak Phosphate Get us Before Global Warming? oilprice.com

Although climate change catches the headlines, it is not the only doomsday scenario out there. A smaller but no less fervent band of worriers think that peak phosphate—a catastrophic decline in output of an essential fertilizer—will get us first.

One of the worriers is Jeremy Grantham of the global investment management firm GMO. Grantham foresees a coming crash of the earth’s population from a projected 10 billion to no more than 1.5 billion. He thinks the rest of humanity will starve to death because we are running out of phosphate fertilizer. This post on Business Insider from late last year provides an array of alarming charts to back up his warning.

Foreign Policy agrees that phosphate shortages are a potential threat. “If we fail to meet this challenge,” write contributors James Elser and Stuart White, “humanity faces a Malthusian trap of widespread famine on a scale that we have not yet experienced. The geopolitical impacts of such disruptions will be severe, as an increasing number of states fail to provide their citizens with a sufficient food supply.”

What is going on here? Is this really “the biggest problem we’ve never heard of,” as Elser puts it? Or are phosphate shortages something that global markets can cope with? Let’s take a closer look.

Why we need phosphates and why we are trouble if they run out

The element phosphorus is as essential to life as carbon or oxygen. It forms part of the structure of cell walls and DNA without which no plant or animal can exist. Phosphates are phosphorus in chemical forms that are available to plants. Some phosphates occur naturally in the soil as the result of weathering of rocks, but since the dawn of agriculture, farmers have added phosphate fertilizers to increase crop production. Manure, the traditional source, still accounts for about 15 percent of all phosphates used in agriculture, but since mid- twentieth century, most such fertilizer has come from phosphate rock.

What we appear to be running out of are deposits of phosphate rock that can be mined at reasonable cost with today’s technology. Up to now, the United States has been a big producer, but its reserves are declining. China has a lot, but its domestic use is soaring and it is not a big exporter. North Africa has the biggest reserves, but some of them are in politically unstable regions like the Western Sahara.

The following widely reproduced diagram from a 2009 paper in Global Environmental Change depicts the peak phosphorus hypothesis in the form of a “Hubbert curve” that shows production declining at an accelerating rate after hitting a maximum around 2035. After that, say peak phosphate proponents, we are in big trouble.

Peak Phosphorus

Can the market save us?

Yes, a shortage of phosphates could spell trouble, but don’t forget about markets. Adjusting to shortages is just what markets are for. As economists see it, depleting a resource like phosphate rock is supposed to cause its price to rise. As the price rises, two things are supposed to happen. First, users are supposed to figure out ways to get by with less, and second, producers are supposed to find new sources of supply. Will this happen in the case of phosphates, or do they have unique properties that will prevent markets from working their magic?

Some think the latter. For example, the authors of the peak phosphorus diagram write that:

“a key difference between peak oil and peak phosphorus, is that oil can be replaced with other forms of energy once it becomes too scarce. But there is no substitute for phosphorus in food production. It cannot be produced or synthesized in a laboratory. Quite simply, without phosphorus, we cannot produce food.”

Fortunately, the biological impossibility of substituting some other element for phosphorus in food production is not enough to thwart the operation of supply and demand in the phosphate market. One sign that the market is working is that phosphate prices are already rising. As the following chart shows, the U.S. prices of two of the most commonly used phosphate fertilizers soared in the early 2000s. Along with the prices of many other commodities, they dropped back from their peaks after the global financial crisis, but they are heading up again as the economy recovers.

Phosphate Fertilizers

The price increases have already had an impact on phosphate use. As the next chart shows, despite rising farm output, the growth rate of phosphate fertilizer use has slowed over time. The question for the future is whether it is technically feasible to increase food output further while actually reducing phosphate use.

Phosphate Use

Experts appear to think the answer is yes. A report published in Environmental Research Lettersestimates that improvements in farm management practices and consumer waste could cut the phosphates needed to produce the present U.S. farm output by half, even with today’s technologies. In the future, even greater reductions may be possible. According to Roberto Gaxiola of Arizona State University, generations of phosphate fertilizer use have reduced the efficiency of phosphorus uptake by domesticated crop plants. His experiments indicate that selective breeding and genetic engineering can produce plants that can flourish with much lower phosphorus use.

There are significant developments on the supply side, as well. Michael Mew of the Fertecon Research Centernotes that producers are already learning how to upgrade lower quality phosphate rock reserves and are modifying processing plants to accept lower quality inputs. Also, he notes that increasing vertical integration of the industry has resulted in a reduction in transportation costs. Those cost savings slow the rate of price increase and give more time for supply and demand to adjust.

Furthermore, although it is true that we cannot create or synthesize phosphorus, we can recover useable phosphorus from waste streams, including urban sewage. As this source explains, existing systems already remove phosphorus from sewage in order to preserve water quality in the rivers and streams into which they discharge treated waste. Given the low prices for phosphate that prevailed until recently, it did not pay to recover that phosphorus in usable forms. Much of it has ended up as sludge buried in landfills. However, several methods could recover a high percentage of the phosphorus from wastewater. At some price, doing so will become a profitable alternative to producing phosphate fertilizers from increasingly low-grade phosphate rock. It may even become worthwhile to mine phosphate from sewage sludge buried in old landfills.

The bottom line

The problems posed by depletion of finite supplies of high-grade phosphate rock are not trivial. However, it is highly misleading to forecast a sharp peak of phosphate fertilizer production in the near future, let alone to predict that mass starvation and population collapse lie on the downslope of the curve. The fact that there are no substitutes for phosphorus when it comes to building DNA or cell walls does not mean that markets are incapable of managing increasing scarcity.

What does seem likely is a period of continued high or rising phosphate prices, which will trigger three reactions. First, higher prices will make it economical to process ever-lower grades of phosphate rock. Second, they will spur changes in farm management and development of improved crop varieties; these in turn will accelerate incipient trends toward increased food output per unit of phosphate input. Third, higher prices will provide incentives for improved recycling of phosphorus from waste streams.

Putting all this together, Michael Mew dismisses the peak phosphate hypothesis. Instead, he foresees a phosphate plateau as higher prices cause historical growth rates to level off gradually.

Phosphate Produstion

Such a phosphate plateau does not preclude the need for changes in how people live and eat. It could well mean the relative price of food will rise over time, something that could cause hardship for many of the world’s poor. Furthermore, the price of phosphorus-intensive meat is likely to rise relative to those of other foods, making it unrealistic for the world’s emergent middle classes ever to attain the kind of meat-rich diet to which residents of today’s wealthy countries have become accustomed—a diet that, in the age of obesity,  is sometimes less of a blessing than a curse.

When all is said and done, a plateau is not a cliff. There is no phosphate doomsday on the horizon.

Posted in Peak Phosphorus | Tagged | 2 Comments

Sand mines used to frack oil & gas are destroying the best topsoil in the Midwest

Preface. Frac sand is a high-purity quartz sand that is injected into wells to blast and hold open cracks in the shale rock layer during the fracking process. In the United States, frac sand is being mined intensively from sandstone deposits across large swaths of land in Wisconsin, Illinois, Minnesota, and Michigan. With the sand, however, comes a number of air, water, public health concerns. These include but are not limited to displacing agricultural lands and ecologically sensitive ecosystems, damaging surface water, like streams, and introducing silica sand into the air, which is a human health hazard.

It is still having shortages in 2022: As oil prices soar, U.S. drillers scramble to find sand for fracking, Sand for fracking is now 3 times as expensive as it was last year, and it’s one of several reasons US oil production isn’t increasing

Alice Friedemann  www.energyskeptic.com  Author of Life After Fossil Fuels: A Reality Check on Alternative Energy; When Trucks Stop Running: Energy and the Future of Transportation”, Barriers to Making Algal Biofuels, & “Crunch! Whole Grain Artisan Chips and Crackers”.  Women in ecology  Podcasts: WGBH, Jore, Planet: Critical, Crazy Town, Collapse Chronicles, Derrick Jensen, Practical Prepping, Kunstler 253 &278, Peak Prosperity,  Index of best energyskeptic posts

***

Nancy C. Loem. May 23, 2016. The sand mines that ruin farmland.  New York Times.

Chicago — While the shale gas industry has been depressed in recent years by low oil and gas prices, analysts are predicting that it will soon rebound. Many of the environmental hazards of the gas extraction process, called hydraulic fracturing or fracking, are by now familiar: contaminated drinking water, oil spills and methane gas leaks, exploding rail cars and earthquakes.

A less well-known effect is the destruction of large areas of Midwestern farmland resulting from one of fracking’s key ingredients: sand.

Fracking involves pumping vast quantities of water and chemicals into rock formations under high pressure, but the mix injected into wells also includes huge amounts of “frac sand.” The sand is used to keep the fissures in the rock open — acting as what drilling engineers call a “proppant” — so that the locked-in oil and gas can escape.

Illinois, Wisconsin and Minnesota are home to some of the richest agricultural land anywhere in the world.

But this fertile, naturally irrigated farmland sits atop another resource that has become more highly prized: a deposit of fine silica sand known as St. Peter sandstone. This particular sand is valued by the fracking industry for its high silica content, round grains, uniform grain size and strength. These qualities enable the St. Peter sand to withstand the intensity of fracking, and improve the efficiency of drilling operations.

In the Upper Midwest, this sandstone deposit lies just below the surface. It runs wide but not deep. This makes the sand easy to reach, but it also means that to extract large quantities, mines have to be dug across hundreds of acres.

At the end of 2015, there were 129 industrial sand facilities — including mines, processing plants and rail heads — operating in Wisconsin, up from just five mines and five processing plants in 2010. At the center of Illinois’s sand rush, in LaSalle County, where I am counsel to a group of farmers that is challenging one mine’s location, The Chicago Tribune found that mining companies had acquired at least 3,100 acres of prime farmland from 2005 to 2014.

In the jargon of the fracking industry, the farmland above the sand is “overburden.” Instead of growing crops that feed people, it becomes berms, walls of subsoil and topsoil piled up to 30 feet high to hide the mines.

But the effects cannot be hidden indefinitely. These mines are destroying rural communities along with the farmland. Homesteads and small towns are being battered by mine blasting, hundreds of diesel trucks speed down rural roads dropping sand along the way, stadium lighting is so bright it blots out the night sky, and 24-hour operations go on within a few hundred feet of homes and farms. As a result, some farmers are selling and moving away, while for those determined to stay, life is changed forever.

Quality of life is not their only concern. Silica is a human carcinogen and also causes lung disease, including silicosis. Because of its dangers, silica is heavily regulated in the workplace, but there are generally no regulations for silica blown around from the sand-mining operations. These mines also use millions of gallons of groundwater every day. Local wells are running dry, and the long-term availability of water for homes and farms is threatened.

Because of the recent slowdown in the fracking industry, many of the sand mines stopped or slowed production, providing temporary respite to these rural communities. But with oil edging back up toward $50 a barrel, and projected to go higher, the Midwest farmlands face a renewed threat.

The sand mines do promise jobs. But it’s shortsighted to rely on a new fracking boom when we’ve already seen how vulnerable the business is to cyclical dips. America’s frac sand industry shrank to about $2 billion last year from $4.5 billion after the price of oil plummeted in 2014. As mines were mothballed or shuttered, hundreds of miners and truckers were laid off.

Even assuming a coming recovery, there may be as few as 20 to 30 jobs in a mine covering hundreds of acres — a mine that may operate for only 20 years. When the sand is exhausted, the mine is a hole in the ground and the jobs are gone. The farms that it replaced provided employment and sustenance for centuries.

There are alternatives to this despoliation. Not all frac sand is buried under prime farmland. Texas, Kansas, Arkansas and Oklahoma all have usable frac sand that is not “burdened” by rich prairie earth, and transportation costs there are often lower.

In the Midwest, we badly need more legal restraints on how frac sand mines operate. People must be protected from blowing silica. Sand piles should be covered and mines set a safe distance from homes, farms, schools and public spaces. At present, such regulations are often lax, and local residents have rarely won the needed protections from local or state governments eager to cash in on the boom.

Groundwater, too, needs stronger safeguards. A good example to follow is LaSalle County, which in 2013 placed a moratorium on new high-capacity wells needed for mining pending the results of a United States Geological Survey study in part funded by Northwestern, where I teach, of the capacity of groundwater supplies to support new mines.

Unfettered frac sand mining is ruining the rural communities of the Midwest. All people are left with are thousands of acres of holes in the ground in place of what was once rich, productive farmland. That is too high a price to pay.

Posted in Oil & Gas Fracked, Peak Sand, Soil | Tagged , , , | 3 Comments

HSBC bank report predicts another financial crisis in 2018

[ Bill Hill of the Hill’s group predicted in June 2016 (at a peakoil.com forum): “We expect to have reached permanent depression by the end of 2017. The reduction will not hit all nations the same way. The richer Western countries will be able to afford fuels for longer than smaller poorer counties. But, how that will feed back into their general economies is yet an unknown. It will definitely have a negative impact, and perhaps a gigantic one. Like the S&P collapsing, an explosion of corporate bankruptcies, and supply chains breaking. But all and all we will just have to wait and see. It has been four years since petroleum hit its energy half way point. We should not have to wait much longer. ]

Is an Economic Oil Crash Around the Corner? By Nafeez Ahmet, January 2017, Alternet.

A report by HSBC shows that contrary to industry mythology, even amidst the glut of unconventional oil and gas, the vast bulk of the world’s oil production has already peaked and is now in decline, while European government scientists show that the value of energy produced by oil has declined by half within the first 15 years of the 21st century.

The upshot? Welcome to a new age of permanent economic recession driven by ongoing dependence on dirty, expensive, difficult oil—unless we choose a fundamentally different path.

Last September, a few outlets were reporting the counter intuitive findings of a new HSBC research report on global oil supply. Unfortunately, the true implications of the HSBC report were largely misunderstood.

New scientific research suggests that the world faces an imminent oil crunch, which will trigger another financial crisis.

The HSBC research note — prepared for clients of the global bank — found that contrary to concerns about too much oil supply and insufficient demand, the situation was opposite: global oil supply in coming years will be insufficient to sustain rising demand.

Yet the full, striking import of the report, concerning the world’s permanent entry into a new age of global oil decline, was never really explained. The report didn’t just go against the grain of the industry’s hype about “peak demand”: it vindicated what is routinely lambasted by the industry as a myth: peak oil ,  the concurrent peak and decline of global oil production.

The HSBC report you need to read

Insurge Intelligence obtained a copy of the report in December 2016, and for the first time we are exclusively publishing the entire report in the public interest. Read and/or download the full HSBC report.

Headquartered in London, HSBC is the world’s sixth largest bank, holding assets of $2.67 trillion. So when it produces a research report for its clients, we should listen. Among the report’s most shocking findings is that, “81% of the world’s total liquids production is already in decline.”

Between 2016 and 2020, non-OPEC production will be flat due to declines in conventional oil production, even though OPEC will continue to increase production modestly. This means that by 2017, deliverable spare capacity could be as little as 1% of global oil demand.

This heightens the risk of a major global oil supply shock around 2018 which could “significantly affect oil prices.”

The report asserts that peak demand (the idea that demand will stop growing leaving the world awash in too much supply), while certainly a relevant issue due to climate change agreements and disruptive trends in alternative technologies, is not the most imminent challenge:

“Even in a world of slower oil demand growth, we think the biggest long-term challenge is to offset declines in production from mature fields. The scale of this issue is such that in our view rather there could well be a global supply squeeze some time before we are realistically looking at global demand peaking.”

Under the current supply glut driven by rising unconventional production, falling oil prices have damaged industry profitability and led to dramatic cut backs in new investments in production. This, HSBC says, will exacerbate the likelihood of a global oil supply crunch from 2018 onwards.

Four Saudi Arabias, anyone?

The HSBC report examines two main datasets from the International Energy Agency and the University of Uppsala’s Global Energy Systems Program in Sweden.

The latter has consistently advocated a global peak oil scenario for many years — the HSBC report confirms the accuracy of this scenario, and shows that the IEA’s data supports it.

The rate and nature of new oil discoveries has declined dramatically over the last few decades, reaching almost negligible levels on a global scale, the report finds. Compare this to the report’s warning that just to keep production flat against increasing decline rates, the world will need to add four Saudi Arabia’s worth of production by 2040. North American production, despite remaining the most promising in terms of potential, will simply not be able to fill this gap.

Business Insider, the Telegraph and other outlets that covered the report last year acknowledged the supply gap, but failed to properly clarify that HSBC’s devastating findings basically forecast the long-term scarcity of cheap oil due to global peak oil, from 2018 to 2040.

The report revises the way it approaches the concept of peak oil — rather than forecasting it as a single global event, the report uses a disaggregated approach focusing on specific regions and producers. Under this analysis, 81% of the world’s oil supply has peaked in production and so now “is post-peak.”

Using a more restrictive definition puts the quantity of global oil that has peaked at 64%. But either way, well over half the world’s global oil supply consists of mature and declining fields whose production is inexorably and irreversibly decreasing:

“If we assumed a decline rate of 5%pa [per year] on global post-peak supply of 74 mbd — which is by no means aggressive in our view — it would imply a fall in post-peak supply of c.38mbd by 2030 and c.52mbd out to 2040. In other words, the world would need to find over four times the size of Saudi Arabia just to keep supply flat, before demand growth is taken into account.”

What’s worse is that when demand growth is taken into account — and the report notes that even the most conservative projections forecast a rise in global oil demand by 2040 of more than 8 mbd above that of 2015 — then even more oil would be needed to fill the coming supply gap.

But with new discoveries at an all-time low and continuing to diminish, the implication is that oil can simply never fill this gap.

Technological innovation exacerbates the problem

Much trumpeted improvements in drilling rates and efficiency will not make things better, because they will only accelerate production in the short term while, therefore, more rapidly depleting existing reserves. In this case, the report concludes: “the decline-delaying techniques are only masking what could be significantly higher decline rates in the future.”

This does not mean that peak demand should be dismissed as a serious concern. As Michael Bradshaw, professor of global energy at Warwick University’s Sloan Business School, told me for my previous Vice article, any return to higher oil prices will have major economic consequences.

Price spikes, economic recession

Firstly, oil price spikes would have an immediate recessionary effect on the global economy, by amplifying inflation and leading to higher costs for social activity at all levels, driven by the higher underlying energy costs.

Secondly, even as spikes may temporarily return some oil companies to potential profitability, such higher oil prices will drive consumer incentives to transition to cheaper renewable energy technologies like solar and wind, which are already becoming cost-competitive with fossil fuels.

That means a global oil squeeze could end up having a dramatic impact on continued demand for oil, as twin crises of peak oil and peak demand end up intensifying and interacting in unfamiliar ways.

The demise of fossil fuels

But the HSBC report’s specific forecasts of global oil supply and demand are part of a wider story of global net energy decline.

A new scientific research paper authored by a team of European government scientists, published on Cornell University’s Arxiv website in October 2016, warns that the global economy has entered a new era of slow and declining growth. This is because the value of energy that can be produced from the world’s fossil fuel resource base is declining inexorably.

The paper—currently under review with an academic journal—was authored by Francesco Meneguzzo, Rosaria Ciriminna, Lorenzo Albanese, Mario Pagliaro, who collectively conduct research on climate change, energy, physics and materials science at the Italian National Research Council,  Italy’s premier government agency for scientific research.

According to HSBC, oil prices are likely to rise and stabilize for some time around the $75 per barrel mark. But the Italian scientists find that this is still too high to avoid destabilizing recessionary effects on the economy.

The Italian study offers a new model combining “the competing dynamics of population and economic growth with oil supply and price,” with a view to evaluate the near-term consequences for global economic growth.

Data from the past 40 years shows that during economic recessions, the oil price tops $60 per barrel, but during economic growth remains below $40 a barrel. This means that prices above $60 will inevitably induce recession. Therefore, the scientists conclude that to avoid recession, “the oil price should not exceed a threshold located somewhat between $40/b [per barrel] and $50/b, or possibly even lower.”

More broadly, the scientists show that there is a direct correlation between global population growth, economic growth and total energy consumption. As the latter has steadily increased, it has literally fueled the growth of global wealth.

But even so, the paper finds that the world is experiencing: “declining average EROIs [Energy Return on Investment] for all fossil fuels; with the EROI of oil having likely halved in the short course of the first 15 years of the 21st century.”

EROI is the total value of energy a resource can generate, calculated by comparing the quantity of energy extracted, to the quantity of energy put in to enable the extraction.

This means that overall, despite total liquids production increasing, as the energy value it generates is declining, the overall costs of extraction are simultaneously increasing. This is acting as an increasing geophysical brake on global economic growth. And it means the more the economy remains dependent on fossil fuels, the more the economy is tied to the recessionary impact of global net energy decline: “The chance of future economic growth matching the current trajectory of the human population is inextricably bound to the wide and growing availability of highly concentrated energy sources enjoying broad applicability to energy end uses.”

The problem is that since the 1980s, the share of oil in the global energy mix has declined. To make up for this, economic growth has increasingly had to rely on clever financial instruments based on debt: in effect, the world is borrowing from the future to sustain our present consumption levels.

In an interview, lead author Francesco Meneguzzo explained:  “Global conventional oil peaked around the year 2005. All the following supply increase was due to unconventional oil exploitation and, since 2009, basically to U.S. shale (tight) oil, which in turn peaked around March, 2015.

“What looks like to be even more important is the fact that global oil supply has failed to keep the pace with the increase in total energy consumption, which ‘natural’ growth requires to be approximately proportional to population increase, leading to the decline of the oil share in the energy mix. While governments have struggled to fuel their economies with ever increasing energy supply, other sources have steadily replaced oil in the energy mix, such as coal in China. Yet, no other conventional source has proved to be a valuable substitute for oil, hence the need for debt in order to replace the vanishing oil share.”

On a business-as-usual trajectory then, the economy can quite literally never recover — unless it transitions to a truly viable new energy source which can substitute for oil.

“In order to avoid the [oil] price affordable by the global economy falling below the extraction cost, debt piling (borrowing from the future) becomes a necessity, yet it is a mere trick to gain some time while hoping for something positive to happen,” said Meneguzzo. “The reality is that debt, basically as a substitute for oil, does not work to produce real wealth, as apparent for example from the decline of the industry value added as a percentage of GDP.”

Where will this end up?

“Recently, debt has started shrinking, basically because it has failed to generate real wealth. Assuming no meaningful (and fast) transition to renewable energy, the economic growth can only deteriorate further and further.”

Basically, this means, Meneguzzo adds, “delocalizing manufacturing to economies using local, cheaper and dirtier energy sources (such as coal in China) as well as lower wages, further shrinking domestic aggregate demand and fueling a downward spiral of deflation and/or debt.”

Is there a way out? Not within the current trajectory: “Unless that debt is immediately used to exploit renewable sources on a massive scale, along with ‘accessories’ such as storage making them as qualified as oil, social and political derangements, even before an economic crash, look to be unavoidable.”

Crisis convergence

Seen in this broader scientific context, the HSBC global oil supply report provides stunning confirmation that for the most part, global oil production is already in post-peak ,  and that after 2018, this is going to manifest in not simply a global supply shock, but a world in which cheap, high quality fossil fuels is increasingly hard to find.

What will this mean? One possible scenario is that by 2018 or shortly thereafter, the world will face a similar convergence of global crises that occurred a decade earlier.

In this scenario, oil price hikes would have a recessionary affect that destabilizes the global debt bubble, which for some years has been higher than pre-2008 crash levels, now at a record $152 trillion.

In 2008, oil price shocks played a key role in creating pre-crisis economic conditions for consumers in which rising living costs helped trigger debt-defaults in housing markets, which rapidly spiraled out of control.

In or shortly after 2018, economic and energy crisis convergence would drive global food prices up, regenerating the contours of the triple crunch we saw ravage the world from 2008 to 2011, the debilitating impacts of which we have yet to recover from.

2018 is likely to be crunch year for another reason. Jan. 1, 2018 is the date when a host of new regulations are set to come in force, which will “constrain lending ability and prompt banks to only advance money to the best borrowers, which could accelerate bankruptcies worldwide,” according to Bloomberg. Other rules to come in play will require banks to stop using their own international risk assessment measures for derivatives trading.

Ironically, the introduction of similar well-intentioned regulation in January 2008 (through Basel II) laid the groundwork to rupture the global financial architecture, making it vulnerable to that year’s banking collapse.

In fact, two years earlier in July 2006, David Martin, an expert on global finance, presciently forecast that Basel II would interact with the debt bubble to convert a collapse of the housing bubble into a global financial conflagration. Just a month after that warning, I was told by a former senior Pentagon official with wide-ranging high-level access to the U.S. military, intelligence and financial establishment that a global banking collapse was imminent, and would likely occur in 2008.

My source insisted that the event was bound up with the peak of global conventional oil production about two years earlier (which according to the U.K.’s former chief government scientist Sir David King did indeed occur around 2005, even though unconventional oil and gas production has offset the conventional decline so far).

Having first outlined my warning of a 2008 global banking collapse in August 2006, I re-articulated the warning in November 2007, citing Martin’s forecast and my own wider systems analysis at a lecture at Imperial College, London. In that lecture, I predicted that a housing-triggered banking crisis would be sparked in the context of the new era of expensive fossil fuels.

I called it then, and I’m calling it now. Some time after January 2018, we are seeing the probability of a new crisis convergence in global energy, economic and food systems, similar to what occurred in 2008.

Today, we are all supposed to quietly believe that the economy is in recovery, when in fact it is merely transitioning through a fundamental global systemic phase-shift in which the unsustainability of prevailing industrial structures are being increasingly laid bare. The truth is that the cycles of protracted economic crisis are symptomatic of a deeper global systemic process.

One way we can brace ourselves for the next crash is to recognize it for what it is: a symptom of global system failure, and therefore of the inevitable transition to a post-carbon, post-capitalist future. The future we are stepping into simply doesn’t work the way we are accustomed to.

The old, industrial era rules for the dying age of energy and technological super-abundance must be re-written for a new era beyond fossil fuels, beyond endless growth at any environmental cost, beyond debt-driven finance.

This year, we can prepare for the post-2018 resurgence of crisis convergence by planting seeds — however small — for that future in our own lives, and with those around us, from our families, to our communities and wider societies.
Nafeez Ahmed is an investigative journalist and international security scholar. He writes the System Shift column for VICE’s Motherboard, and is the winner of a 2015 Project Censored Award for Outstanding Investigative Journalism for his former work at the Guardian. He is the author of A User’s Guide to the Crisis of Civilization: And How to Save It (2010), and the scifi thriller novel Zero Point, among other books.

Posted in Crash Coming Soon, Economic Decline | Tagged , | Comments Off on HSBC bank report predicts another financial crisis in 2018

Peak coal 2013-2045 — most likely 2025-2030

Preface.  The amount of coal reserves is far less than what the IPCC has assumed in their models, where they used RESOURCES, which is coal that can’t be economically and/or technologically obtained.  Typical economists, they assume humans are so smart they can figure out everything.

Peak oil sets the timetable for peak coal, since coal mining and transport depends on oil.

Signs of peak coal?

2020: The Energy 202: U.S. coal production hit its lowest point in last four decades. Washington Post.  The United States mined 706 million tons of coal in 2019 — the lowest total since 1978. That’s a 7% drop from 2018, continuing a decade-long decline in overall output since the coal-mining sector’s peak production in 2008. Wyoming, the top coal-producing state, saw a 9% drop in 2019. Arizona stopped mining coal altogether. With the coronavirus pandemic leading to a decline in demand for electricity, the U.S. coal sector is on pace for even bigger drop in 2020, with the U.S. Energy Information Administration projecting in a blog post Monday mining levels “comparable with those in the 1960s.”  On the other hand, coal is still the main source for electricity globally, and 70% of world steel production.

Alice Friedemann  www.energyskeptic.com  author of “When Trucks Stop Running: Energy and the Future of Transportation”, 2015, Springer, Barriers to Making Algal Biofuels, and “Crunch! Whole Grain Artisan Chips and Crackers”. Podcasts: Collapse Chronicles, Derrick Jensen, Practical Prepping, KunstlerCast 253, KunstlerCast278, Peak Prosperity , XX2 report

***

Dennis Coyne. March 11, 2016. Coal Shock Model. peakoilbarrel.com

Coal is an important energy resource, but we do not know how the size of the economically recoverable resource that will eventually be recovered. The mainstream view is that there are extensive coal resources that are economically recoverable. But research by Rutledge, Mohr, and Laherrere contradicts this view.

My estimates of the coal URR are based on the work of David Rutledge and Steve Mohr. Recent work by Jean Laherrere has coal URR estimates which are higher than my estimates, his medium scenario (650 Gtoe) is higher than my high case (630 Gtoe) and his estimates are usually conservative. My estimate may be too conservative, though my medium case (URR=510 Gtoe) is somewhat higher than the best estimate of Steve Mohr (465 Gtoe), whose work on coal is the best that I have found.

The average of the best estimate of Mohr and Laherrere’s medium case is about 550 Gtoe, a little higher than my medium case and similar to Laherrere’s low case. Based on the recent work by Laherrere, my best estimate would be 560 Gtoe (570 Gtoe is the average of my medium and high cases and 550 Gtoe is the average of the Mohr and Laherrere medium cases, the average of all 4 is 560 Gtoe).

The peak for world coal output will be sooner than most people think, the range is 2013 to 2045, my estimate is 2025 to 2030 with peak output between 4 and 5 Gtoe/year (2014 output was about 4 Gtoe/year).

blog1603/

The eventual peak in World fossil fuel output is a potentially serious problem for human civilization. Many people have studied this problem, including Jean Laherrere, Steve Mohr, Paul Pukite (aka Webhubbletelescope), and David Rutledge.

I have found Steve Mohr’s work the most comprehensive as he covered coal, oil, and natural gas from both the supply and demand perspective in his PhD Thesis. Jean Laherrere has studied the problem extensively with his focus primarily on oil and natural gas, but with some exploration of the coal resource as well. David Rutledge has studied the coal resource using linearization techniques on the production data (which he calls logit and probit).

Paul Pukite introduced the Shock Model with dispersive discovery which he has used primarily to look at how oil and natural gas resources are developed and extracted over time. In the past I have attempted to apply Paul Pukite’s Shock Model (in a simplified form) to the discovery data found in Jean Laherrere’s work for both oil and natural gas, using the analysis of Steve Mohr as a guide for the URR of my low and high scenarios along with the insight gleaned from Hubbert Linearization.

In the current post I will apply the Shock model to the coal resource, again trying to build on the work of Mohr, Rutledge, Laherrere, and Pukite.

A summary of URR estimates for World coal are below:blog1603/

The “Laherrere+Rutledge” estimate uses the Rutledge best estimate for the low case and Laherrere’s low and medium cases for the medium and high cases. Laherrere also has a high case of 750 Gtoe for the World coal URR, which seems too optimistic in my opinion. The “high” estimate of Steve Mohr has been reduced from his “Case 3” estimate of 670 Gtoe by 40 Gtoe because I have assumed lignite and black coal resources are lower than his high estimate.

An update of David Rutledge’s estimate using the latest BP data through 2014 gives a URR of about 400 billion tonnes of oil equivalent (Gtoe) for coal. The Rutledge 2009 estimate was about 350 Gtoe.

My initial estimate was in billions of tonnes (Gt) of coal at 800 Gt for the low estimate (a round number near Steve Mohr’s low estimate of 770 Gt) and 1300 Gt for the high estimate (about the same as Steve Mohr’s high estimate), my medium estimate was simply the average of the high and low estimates. I came across Jean Laherrere’s estimate after I had developed my model, surprisingly his medium estimate is a little higher than my guess, which is usually not the case (for other fossil fuels).

I do not have access to discovery data for coal, but based on World Resource estimates gathered by David Rutledge, most coal resources had been discovered by the 1930s. I developed simple dispersive discovery models with peak discovery around 1900 for each of the three cases, these are rough estimates, I only know is that coal was discovered over time. The cumulative coal discovery models in Gtoe are shown in the chart below for the low, medium and high URR cases.

blog1603/

In each case about 75% of coal discovery was prior to 1940.  Coal resources have been developed very slowly, especially since the discovery of oil and natural gas. As a simplification I assume that the rate that the discovered coal is developed remains constant over time.

A maximum entropy probability density function with a mean time from discovery to first production of 100 years is used to approximate how quickly new proved developed producing reserves are added to any reserves already producing each year. For example a 1000 million tonne of oil equivalent (1 Gtoe) coal discovery would be developed (on average) as shown in the chart below:

blog1603/

Reading from the chart, about 9 Mtoe of new producing reserves would be developed from this 1850 discovery in 1860 and about 5 Mtoe of new producing reserves would be developed in 1920. About half of the 1000 Mt discovered in 1850 would have become producing reserves by 1920, so the median time from discovery to producing reserve is about 70 years (the mean is 100 years due to the long tail of the exponential probability density function).

The model takes all the discoveries for each year and applies the probability density function (pdf) above to each year’s discoveries (the pdf is 1000 less than shown in the chart because we multiplied the pdf by 1000 to show the new producing reserves in Mtoe.) Then the new producing reserves from each year’s discoveries are simply added together in a spreadsheet, not complicated, just an accounting exercise.  The new producing reserves curve (when everything is added up) is shown below for the medium URR case (510 Gtoe):

blog1603/

Each year new producing reserves are added to the pool of producing reserves while some of these reserves are produced and become fossil fuel output. This is indicated schematically below:

blog1603/

If the Fossil fuel output is less than the new producing reserves added in any year, then the producing reserves would increase during that year, if the reverse is true they would decrease.

The fossil fuel output divided by the producing reserves is called the extraction rate.

Using data from David Rutledge for fossil fuel output to 1980 and data from BP’s Statistical Review of World Energy from 1981 to 2014, I extrapolated the extraction rate trend from 2000 to 2014 to estimate future coal output. The chart below shows the discovery curve, new producing reserves curve, and the output curve for the scenario with a URR of 510 Gtoe.

blog1603/

Note that when new producing reserves are more than output the producing reserves will increase (up to 1986), after 1993 output is higher than the new producing reserves added each year so producing reserves start to decrease. Producing reserves are in the following chart for the medium scenario (URR=510 Gtoe).

blog1603/

The fall in producing reserves combined with increased World output of coal from 2000 to 2013 required an increase in extraction rates from 1.5% to 2.9%. I assume after 2014 that this increase in extraction rates continues at a similar rate until reaching 4% in 2026 and then extraction rates gradually flatten, reaching 5.1% in 2070.

Clearly I do not know the future extraction rate, this is an estimate assuming recent trends continue. For this scenario with a coal URR of 510 Gtoe output peaks in 2026 at about 4250 Mtoe/year.

blog1603/

For the low and high URR cases the details of the analysis are covered at the end of the post. The extraction rate trend from 2000 to 2014 was also extended until a peak was reached and then the increase in extraction rates were assumed to lessen until a constant rate of extraction was reached.

The three scenarios(low, medium, and high) are presented in the chart below.

blog1603/

The low scenario peaks in 2013 at about 4 Gtoe/a, the medium scenario peaks in 2025 at about 4.3 Gtoe/a, and the high scenario peaks in 2045 at about 4.9 Gtoe/a. Note that the medium scenario is not my best estimate, it is simply a scenario between possible low or high URR cases, reality might fall on any path between the high and low scenarios, depending on the eventual URR and extraction rates in the future.

A blog post by Luis de Sousa covered Jean Laherrere’s estimate of future coal output with URR between 550 Gtoe and 750 Gtoe.

blog1603/
blog1603/

For comparison, I have adjusted my chart (shown above) to have a similar scale as Jean Laherrere’s chart.

Note that only the two higher scenarios in my chart can be roughly compared with the lower two scenarios in Laherrere’s chart (510 compared with 550 Gtoe and 630 compared with 650 Gtoe). My scenarios peak at higher output at a later year and decline more steeply as a result.

The chart below is Steve Mohr’s medium independently dynamic scenario, where supply responds to coal demand.

blog1603/
blog1603/

The Chart above labelled C Case 2 is figure 5-8 from page 69 of Steve Mohr’s PhD Dissertation, the peak output is 210 EJ/year in 2019 (from Table 5-7 on page 71), Case 2 has a URR of 19.4 ZJ or 465 Gtoe (ZJ=zettajoule=1E21 J). My medium scenario (URR of 21.3 ZJ) has a lower peak output of 180 EJ/year, which occurs 6 years later than Mohr’s scenario. (1 Gtoe=41.868 EJ=4.1868E-2 ZJ).

It is interesting that Jean Laherrere’s larger URR scenario (550 Gtoe) has a peak of 4 Gtoe/year, while Mohr’s smaller URR (465 Gtoe) has a peak of 5 Gtoe/year. Mohr’s scenario was created in 2010 before the 2014 slowdown in Chinese coal consumption and he may have assumed that China and India would resume their rapid increase in coal consumption from 2010 to 2025. Jean Laherrere’s scenario was created in 2015 and in his 550 Gtoe scenario he may assume that the recent decrease in World coal output (in 2014) will continue in the future.

My medium scenario (510 Gtoe) is between Mohr’s medium (case 2) scenario and Laherrere’s low scenario. I have created two new scenarios using a URR of 510 Gtoe which match the peak output of Laherrere’s 550 Gtoe scenario and Mohr’s 465 Gtoe scenario. I have also created a “plateau” scenario with URR=510 Gtoe with World output remaining at the 2014 level until 2025. The various scenarios are presented in the chart below.

blog1603/

The extraction rates in the 4 different 510 Gtoe scenarios can be compared in the chart that follows.

blog1603/

Generally  a higher peak in output leads to steeper annual decline rates, the chart below compares annual decline rates for the 4 different 510 Gtoe URR scenarios.

blog1603/

Works Cited

  • De Sousa, Luis. “Peak Coal in China and the World, by Jean Laherrère.”          attheedgeoftime.blogspot.com. Web. 11 March. 2016.
  • Mohr, Steve. Projection of world fossil fuel production with supply and demand interactions. 2010. Web. 11 March. 2016.
  • Oil Conundrum. theoilconundrum.com. Web. 11 March. 2016.
  • Rutledge, David. “Estimating long-term world coal production with logit and probit transforms.” International Journal of Coal Geology. 85 (2011): 23-33. Web. 11 March. 2016.

Appendix with details of Low and High cases

With links to Excel files at end of appendix

Low case-URR=390 Gtoe

blog1603/

blog1603/

blog1603/

blog1603/

High Case- URR=630 Gtoe

blog1603/

blog1603/

blog1603/

blog1603/

Further reading

Posted in Coal, Peak Coal | Tagged | Comments Off on Peak coal 2013-2045 — most likely 2025-2030

Ugo Bardi: The Hill’s Group report

[ The Hill’s group consists of energy insiders, and I must admit I was impressed by the predictions they said their model had already gotten right, such as the drop in oil price when everyone was expecting the price to rise.  And much of what they say matches the predictions and timeline of others as well as how the net energy cliff will unfold.  The charts and calculus are very impressive, and for years their paper has been discussed on peak oil forums. 

A scientist I know working in Saudi Arabia thinks we’ve got at least 20 years, and that if Exxon, Chevron, and other oil and gas companies go bankrupt, no problem — the government will nationalize them.  Another scientist pointed out that “Modern society runs on oil, thus the oil industry will be the absolute LAST industry to fail. It will be supported by hook or crook until then. Even at $200 a barrel we get energy a thousand times cheaper than human labor. Just not 20,000 times as much anymore”.

Dennis Coyne, who published Seppo Korpela’s article here says: “Oil prices are not determined primarily by thermodynamics as the Hill’s Group suggests.  Geology and technology will affect the cost to supply the oil and World economic growth and technology will affect the demand for oil, the price of oil will mostly be determined by these factors along with policy and political choices made by individual nations.”

After Bardi’s post I’ve added some of the predictions Bill Hill said their model predicted on various forums — many sound plausible, but perhaps not an outcome of their model…  And at the very bottom, an English translation of one of the Spanish articles.  Stay tuned for a peer-reviewed critique of their paper, which I’ve heard is in the works.

Alice Friedemann   www.energyskeptic.com  author of “When Trucks Stop Running: Energy and the Future of Transportation”, 2015, Springer and “Crunch! Whole Grain Artisan Chips and Crackers”. Podcasts: Practical Prepping, KunstlerCast 253, KunstlerCast278, Peak Prosperity , XX2 report ]

Ugo Bardi. Feb 26, 2017. Catastrophism is popular, but not necessarily right. Debunking the “Hill’s Group” analysis of the future of the oil industry. Cassandra’s Legacy.

“The Hill’s Group” has been arguing for the rapid demise of the world’s oil industry on the basis of a calculation of the entropy of the oil extraction process. While it is true that the oil industry is in trouble, the calculations by the Hill’s group are, at best, irrelevant and probably simply plain wrong. Entropy is an important concept, but it must be correctly understood to be useful. It is no good to use it as an excuse to pander unbridled catastrophism. 

Catastrophism is popular. I can see that with the “Cassandra’s Legacy” blog. Every time I publish something that says that we are all going to die soon, it gets many more hits than when I publish posts arguing that we can do something to avoid the incoming disaster. The latest confirmation of this trend came from three posts by Louis Arnoux that I published last summer (link to the first one). All three are in the list of the ten most successful posts ever published here.

Arnoux argues that the problems we have today are caused by the diminishing energy yield (or net energy, or EROI) of fossil fuels. This is a correct observation, but Arnoux bases his case on a report released by a rather obscure organization called “The Hill’s Group.” They use calculations based on the evaluation of the entropy of the extraction process in order to predict a dire future for the world’s oil production. And they sell their report for $28 (shipping included).

Neither Arnoux nor the “Hill’s Group” are the first to argue that diminishing EROEI is at the basis of most of our troubles. But the Hill’s report gained a certain popularity and it has been favorably commented on many blogs and websites. It is t is understandable: the report has an aura of scientific correctness that comes from its use of basic thermodynamic principles and of the concept of entropy, correctly understood as the force behind the depletion problem. There is just a small problem: the report is badly flawed.

When I published Arnoux’s posts on this blog, I thought they were qualitatively correct, and I still think they are. But I didn’t have the time to look at the details of the report of Hill’s group. Now, some people did that and their analysis clearly shows the many fundamental flaws of the treatment. You can read the results in English by Seppo Korpela, and in Spanish by Carlos De Castro and Antonio Turiel. [ NOTE: at the very bottom I have an english translation minus the equations ].

Entropy is a complex subject and delving into the Hill’s report and into the criticism to it requires a certain effort. I won’t go into details, here. Let me just say that it simply makes no sense to start from the textbook definition of entropy to calculate the net energy of oil production. The approximations made in the report are so large to make the whole treatment useless (to say nothing of the errors it contains). Using the definition of entropy to analyze oil production is like using quantum mechanics to design a plane. It is true that all the electrons in a plane have to obey Schroedinger’s equation, but that’s not the way engineers design planes.

Of course, the problem of diminishing EROEI exists and can be studied. The way to do that is known and it is based on the “life cycle analysis” (LCA) of the process. This method takes into account entropy indirectly, in terms of heat losses, without attempting the impossible task of calculating it from first principles. By means of this method we can see that, at present, oil production still provides a reasonable energy return on investment (EROEI) as you can read, for instance, in a recent paper by Brandt et al.

But if producing oil still provides an energy return, why is the oil industry in such dire troubles? (see this post on the SRSrocco report, for instance). Well, let me cite a post by Nate Hagens:

In the last 10 years the global credit market has grown at 12% per year allowing GDP growth of only 3.5% and increasing global crude oil production less than 1% annually. We’re so used to running on various treadmills that the landscape doesn’t look all too scary. But since 2008, despite energies fundamental role in economic growth, it is access to credit that is supporting our economies, in a surreal, permanent, Faustian bargain sort of way. As long as interest rates (govt borrowing costs) are low and market participants accept it, this can go on for quite a long time, all the while burning through the next higher cost tranche of extractable carbon fuel in turn getting reduced benefits from the “Trade” creating other societal pressures.

Society runs on energy, but thinks it runs on money. In such a scenario, there will be some paradoxical results from the end of cheap (to extract) oil. Instead of higher prices, the global economy will first lose the ability to continue to service both the principal and the interest on the large amounts of newly created money/debt, and we will then probably first face deflation. Under this scenario, the casualty will not be higher and higher prices to consumers that most in peak oil community expect, but rather the high and medium cost producers gradually going out of business due to market prices significantly below extraction costs. Peak oil will come about from the high cost tranches of production gradually disappearing.

I don’t expect the government takeover of the credit mechanism to stop, but if it does, both oil production and oil prices will be quite a bit lower. In the long run it’s all about the energy. For the foreseeable future, it’s mostly about the credit

In the end, it is simply dumb to think that the system will automatically collapse when and because the net energy of the oil production process becomes negative (or the EROEI smaller than one). No, it will crash much earlier because of factors correlated to the control system that we call “the economy”. It is a behavior typical of complex adaptative systems that are never understandable in terms of mere energy return considerations. Complex systems always kick back.

The final consideration of this post would simply be to avoid losing time with the Hill’s report (to say nothing about paying $28 for it). But there remains a problem: a report that claims to be based on thermodynamics and uses resounding words such as “entropy” plays into the human tendency of believing what one wants to believe. Catastrophism is popular for various reasons, some perfectly good. Actually, we should all be cautious catastrophists in the sense of being worried about the catastrophes we risk to see as the result of climate change and mineral depletion. But we should also be careful about crying wolf too early. Unfortunately, that’s exactly what Hill&Arnoux did and now they are being debunked, as they should be. That puts in a bad light all the people who are seriously trying to alert the public of the risks ahead.

Catastrophism is the other face of cornucopianism; both are human reactions to a difficult situation. Cornucopianism denies the existence of the problem, catastrophism (in its “hard” form) denies that it can be solved or even just mitigated. Both attitudes lead to inaction. But there exists a middle way in which we don’t exaggerate the problem but we don’t deny it, either, and we do something about it

A defense of the Hills Group (one of the comments at Cassandra’s Legacy):

Your preference for Life Cycle Analysis over the Thermodynamics of Steady State is just that…your preference. The ETP model includes as a cost the cost of replacing reserves as they are used. The method used in the ETP model is similar to what one might use for a biological system…that is, the parents have to provide for the children…adult birds need to look for caterpillars to feed the young. Now, if, as Hubbert assumed, we have a boundless supply of nuclear energy just waiting in the wings, a Life Cycle study would be appropriate. But since oil is part of the very biological business of keeping humans alive and functioning, there is nothing wrong with the ETP method. Whichever method is used, the user is responsible for understanding the assumptions and applying them appropriately.
*You fail to see that the numbers quoted by Nate Hagens MIGHT just have a more fundamental cause than ‘just because’. If the falling value of energy, and particularly oil, as displayed by the output from the ETP model is correct, then we would expect the numbers that Hagens quotes. Hagens is not ‘disproving’ the ETP model.
*After accusing other people of confusing the EROEI methodology, you fall into the same trap. The ETP model does not claim that EROEI is going below 1. As estimated from the ETP model, the ‘dead state’ is arrived at when the EROEI is around 7 (as I remember). Such numbers are reasonably consistent with what Charles Hall and others have called ‘extended EROEI’. That is, they count the costs beyond the well-head. The ETP methodology estimates that, with a well-head EROEI of 7, we will no longer be able to sustain the industrial economy as it is presently configured.
*While the ETP model does not model the human reaction to the recognition that the economic and social system cannot go on much longer as it has been going for the last decades and centuries, Mr. Hill has been very clear that he thinks the situation is dire. The oil companies could lose enormous amounts of equity values overnight. The recognition would reverberate through the economy and the social system. The ETP model tells us something about the physical world, which we must interpret in terms of the financial and social world.

And FYI, some of the predictions the Hills Group claim that their model predicts for the future:

The 2012 energy half way point, set out by the Etp Model, marked the point where the world started being better off without oil than with it. That conversion will be complete by no later than 2030.

Our model indicates that conventional crude production will fall to 44 mb/d by 2030. Thereafter, it goes into catastrophic decline.

Our analysis indicates that it will probably be in the range of 15 to 20 years after that when the majority of petroleum production will ceaseThe oil age is coming to an end. The Etp Model provides a very important time line; one that informs us that we have at most 14 years to put into place an alternate energy system; one beyond oil. Past that point the world will have fallen into such a deep depression that it will no longer be able to help itself.

We expect to have reached permanent depression by the end of 2017 (prediction made June 2016).

The reduction will not hit all nations the same way. The richer Western countries will be able to afford fuels for longer than smaller poorer counties. But, how that will feed back into their general economies is yet an unknown. It will definitely have a negative impact, and perhaps a gigantic one. Like the S&P collapsing, an explosion of corporate bankruptcies, and supply chains breaking. But all and all we will just have to wait and see. It has been four years since petroleum hit its energy half way point. We should not have to wait much longer. We are likely to see the first major impacts this year!

Things are a lot worse than oil producers are admitting. The Etp Model indicates that in the present price environment that only about 35% of the world’s producers are making money over their full life cycle costs. Their desperation for cash ensures that production will not decline until many of them start to fail. The energy dynamics of the situation point to falling prices until at least 2020. By then much of the world’s petroleum production capacity will be gone forever!

Damage is being inflicted on the industry that will never be repaired. CapEx is being cut everywhere in the industry, and future development is likely to never fully recover. The Etp Model indicates that only about an additional 320 Gb will now ever be extracted. In 2012 petroleum contributed $6.22 trillion to the $16.16 trillion GDP of the US. That contribution will fall by more than half during the next decade.

Very low priced oil is a catastrophe for the petroleum industry, and the world. Whereas the oil age might have staggered forward for another 14 to 15 years, it might all come unglued over the next 5 or 6.

The Etp Model indicates that only about an additional 320 Gb will now ever be extracted.

The industry’s net worth is now declining by 24% per year. If the price decline continues, as expected, trillions of dollars will be lost to bond and equity holders over the next few years. Pension funds, and Sovereign wealth fund will be hit particularly hard.

EROEI

Year EROEI : 1
1945 167.0
1980 30.4
2014 9.1
2015 8.9

At 6.9 : 1 it will have reached its the theoretical limit, or were the PPS (Petroleum Production System) reaches the “dead state”. That will be dependent on its accumulated production, which has had a very consistent rate of increase for the last 100 years. The accumulated production has followed Hubbert’s curve almost exactly; by 2009 it had deviated from that curve by 0.04 Gb. In other words the amount remaining to be extracted is a product of how much has already been removed. Any amount after 1,780 Gb will remain in the ground as it will no longer be able to act as an energy source.

The highest ERoEI crude left in the world is probably coming out of the Middle East and Nigeria; and both of them are about to explode.

Saudi Arabia

When Ghawar will start to collapse has been the subject of heated discussion for a very long time. Looking at its water cut, as reported by Aramco reserve engineers, and the fact that they have been drilling horizontal wells to skim the last few feet off the top of the oil column indicates that it probably won’t be long in coming. A better indication is probably the price. The Affordability Curve gives a pretty good indication as to what is likely to transpire, and The Price of Oil  puts the maximum affordability at:

2015 – $77.28
2016 – 65.94
2017 – 54.18
2018 – 41.16
2019 – 26.88

By the looks of the above graph sometime between 2018 and 2019 the Saudi’s will no longer be able to cover their lifting cost. Once that happens their production will collapse, and they will likely break the peg. My WAG (wild ass guess) would be sometime in that time frame.   Of course, the Iranians may decide to blow the crap out of them at any time, and that would put a real crimp onto their production. It looks like the best case scenario is 2 to 3 years before Saudi Arabia implodes.

Shale / Light Tight Oil

U.S. LTO production will not start to decline because of a lack of drilling opportunities, lack of funds (the FED has their back), or because of high well decline rates. It will decline when it runs out of buyers for it. That will happen in the next couple of years.

It now requires about 74,000 BTU to extract, process, and distribute a gallon of petroleum. Only the lower API fractions have an energy content that is sufficient to provide a surplus of energy after their process energy is subtracted.

The energy dynamics imply that once conventional crude is depleted, that other alternative liquid fuels will not be able to maintain enough of the economy needed to produce them, or provide for their demand. Shale is a good example of this phenomenon. Most shale is incapable of driving the economy, and its only use is as a feedstock for other processes.

Civilization is likely to experience something resembling a brown out. Voltage drops until the motors grind to halt, and burn up. Imagine billions of people milling around trying to figure out why things are running slower, and slower. Not much has yet fully stopped working, but nothing is working quite right!

Petroleum is providing just enough energy at this point in time to keep what is running going. If any additional load is placed on the system, like having to bail out the banks again, a good sized war, or even some natural disaster something is going to burn up. Maybe a big chunk of the health care system, the consumer economy, or the petroleum industry but something will no longer be maintainable. The world no longer has the extra energy to expend on anything but what it is presently using. The danger is that when it starts it could cascade into a black out!


An analysis of the theoretical foundations of the ETP model  By Antonio Turiel

Last February 20th,  we held a monographic session in the Transition Forum organized by FUHEM (a Spanish foundation concerned with social issues, basically a NGO of many intellectuals and scarce funds), to analyze the ETP model. This model created by the Hill’s Group tries to forecast the global oil production evolution in the next years. It is based in the decreasing net energy that oil is offering.

To start the discussion, FUHEM asked me to make an analysis to validate and check the theoretical robustness of the said model. They were trying to see, among other things, if their conclusions (quite terrible, by the way) could be used in their discussions with political agents.


I have deemed convenient to write this post explaining the conclusions of my analysis, due to its importance and the raising interest on this subject.


This is a rather technical post, but I will try to explain the basic concepts in the most intuitive possible form. The formulas and concepts treated are those included in the document “Depletion: A determination for the world’s petroleum reserve”, release 2 of March 1st. 2015.


The following critique is not exhaustive; there are many aspects in the model that will not be treated. I will mainly focus on the most relevant theoretical aspects, but not even all of them, and I will deliberately sidestep the discussion on use of data. Carlos de Castro, on his turn, made a detailed analysis for the same session on the data processing in the ETP model. This analysis can be accessed as post in the blog of the Energy, Economy and System Dynamics Group of the Valladolid University.


The Hill’s Group Report (hereinafter HGR) states in its introduction that they intend to estimate the energy needed by the oil production and distribution system (so called Petroleum Production system, or PPS) to make its products reach the society and to check if this energy is approaching to the energy efficiency limit, which corresponds with the energy that can be obtained just burning this oil.


All the HGR is based on the equations used to calculate the energy needed by the PPS to continue working. This needed energy is called Total Production Energy or ETP. They use some thermodynamic equations to this effect and I will precisely focus my analysis on the theoretical derivation of these equations.


Theoretical foundations of the ETP


One of the weakest points of the report is the inadequate definition of the validity boundaries.  By the treatment given to the variables, it could be thought that calculations are made at the well head and therefore, that the calculated ETP  refers to the energy spent to just extract the oil. However, as per other considerations, it is mentioned that the calculations include all the PPS.


Making a calculation for the whole PPS is a rather complex issue, even introducing simplifying hypothesis, such as taking typical or mean values, as there are a huge amount of mixed processes with different efficiencies. The conditions under which extraction, refining and distribution take place greatly change from one place to another in the planet (the spatial dimension, as quoted to Antonio Serrano in his analysis of these problems).


In fact, the biggest problem to tackle the analysis with thermodynamic equations is to define and accurately enclose the limits of the system under study and to be sure that the hypotheses are correctly applied to it. In fact, sometimes implicit hypothesis are included inadvertently. So, one has to be extremely careful with the data handling and with the terms included in the equations.


Other conceptual problems observed from the start is that the analysis takes the PPS isolated from the rest of the economy and specifically form other energy sources that could back the oil extraction, (oil could still be interesting when no net energy can be extracted from it due to its possibly bigger added value). That makes the statements on the collapse of the PPS questionable, to say the least. The collapse may finally happen, but it is not unavoidable in pure logic, from what is being theoretically analyzed.


The basic variable to derive the ETP is the calculation of the entropy variation rate. As the “entropy” word appears, you can bet that 90% of the readers will just jump over the part of the report with the formulas and go directly to the graphs and the conclusions.


This post has precisely the aim to analyze to which extent these equations are physically sound, if they are well applied and to which system they are applied. I will try to make the explanation as simple as possible, complementing each theoretical concept with a more simple explanation. In any case, I recommend the (Spanish speaking) readers with time and will to know about this in more detail, to read an old post of this blog, called “Entropía


The first equation introduced in the HGR is a general one, valid for any system, on the entropy variation rate with time:


Equation 1.


Intimidating, as it appears, this equation shows, in fact, a very simple equality

(Notation: S is the symbol to denote entropy). The first term of the equation is the derivative of entropy with time. This term does not say anything specific, being at the left of the sign equal. The equation is issued to calculate this term in the left side. The terms in the right side will give information on which things change the entropy.


(Notation: Q means heat. The dot on top means the variation with (respect) time. T means temperature). The entropy of a given body is intimately associated to its temperature. This term includes all the changes of the entropy produced in the considered system due to heat flows. The sigma letter Σ heading the term is a sum indicating that we have to add all the transferences of associated entropies due to all possible heat flows: there exists an undefined amount of heat sources Qj, each of them associated to a temperature Tj and we have to add all of them (for all the values of j index).


(Notation: m is the mass of a substance or a given body and s is the entropy per mass unit of this substance or body; it is also called “specific entropy”). This term is just telling that if there are substances or bodies entering into the system, they bring their entropy with them. The dot on top of the m means variation of the mass of the entering substance or body with time and as in the previous term, it is added over all the possible entering bodies, in this case numbered with the i index.


Analog to the previous term, but in this case, referred to the substances or bodies abandoning the system. That’s why the negative sign before the summation, because leaving the system also removes entropy from the total.


This is the last term of the equation and refers to all the changes in the entropy associated to irreversible processes taking place in the system. This term is a complete hotchpotch where it can be included everything that could not be counted in the other terms. That’s why is the most difficult to evaluate.


The equation just dissected is correct. It is a general one specifying the different factors contributing to the increase of entropy and it can be applied to any system without exceptions. The problem of this equation is that has an undefined number of terms (the sums could easily contain thousands of terms), which makes hard to use it in practice. When this general equation is applied to simple systems, it is possible to make approximations that allow to simplify it and make it manageable. But each of these approximations implies certain hypothesis that could determine the particular system for which they are of application. This implicit specification of the system of application may happen and pass unnoticed to the person who is applying it, that could even claim that the system of application is another one. This is precisely the case of the ETP model, as we shall see below.


The first hypothesis in the HGR is to assume that there are no entering masses in the system; only outgoing masses: the oil flow that leaves the wellhead and enters into the PPS. Besides, there is a simplification, when considering only one temperature, taken in a first approach as the typical temperature of the oil deposits. For the outgoing mass the HGR considers the total oil mass leaving all oil deposits. Therefore, the equation is reduced to the following form:


Equation 2.


Simplifying sums and substituting the quantities by typical values (or by mean values, the report is not explicit on that) is an approximation, but that is not the main problem of this equation. Such kind of simplification is what in Statistical Mechanics is called “mean field” and is applied to systems containing a large number of parts, all of them with the same type of interaction. The mean field gives a good first approach to the reality, maybe incurring in some degree of error but correctly capturing trends.


But the problem is not the mean field approximation. It is that the HGR ignores all type of interactions that a real PPS system has. For instance, all the intense flow of materials (steel, concrete, electronics of many different types, etc.) which are required to build and maintain the wells, to build and repair the distribution system (pipelines, trucks, supertankers, etc.). The report also ignores the intense heat inflows and outflows associated to all these processes. All these interactions are of diverse types and cannot be managed with a mean field approximation. Simply because the system is extremely heterogeneous and there are no mean or typical values that could properly describe such complex systems.


I will put an example to make myself better understood.


Talking about fusion or freezing temperatures of water is useful in practical terms, even if we could be talking of waters from different origins with different mineral salts diluted and therefore slightly different freezing points. In all cases, we are talking of liquids with homogeneous aspects, suffering similar processes. At the end, all the water samples considered will freeze into ice at approximately the same temperature, with slight differences among them. So, it has some sense to talk of a fusion temperature at zero degrees Celsius, and this allow us to understand how ice behaves.


Now, let’s think in a heterogeneous system; one constituted by different parts with different behaviors. One apparently simple like ice cream in a vanilla cornet. If we increase the temperature of the system over the melting point of the ice cream, the ice cream will melt, but it will still be contained within the wafer cone. If we continue increasing the temperature, the water content of the ice cream will eventually evaporate, leaving a viscous mass than then a dry mass. If we still increase the temperatures, the system will burn, but the way it will do it, will depend on the different combustion points; it will depends on how the wafer will be softened, the amount of remaining water in the ice cream, etc.


The cornet ice cream system cannot be understood with the temperature changes and even less with a given fusion temperature. All the ice cream cornet interactions are rather complex and to understand how the system behaves it is not enough with assessing the behavior of each part (ice cream and wafer cone) separately; it depends also on how the two parts interact with each other for the particular ice cream and wafer cone under consideration. And if the ice cream cornet is complex, we have to imagine how complex should be all the global production and distribution system.


This is the reason why the mean field approach used in the equation above cannot be applied (apart from the fact that there are incoming masses and this term cannot be neglected). The conclusion is that the simplified equation applies to the liquid oil contained in the geological deposits, although the interactions with the rocks are also neglected and they may not be so negligible when, for instance, the reservoir rock is collapsing and cementing when the oil is extracted from its interstices.


There is a new formula introduced in this point of the report, even it is not used until later, that confirms that the report refers to liquid oil. The formula tells about the entropy variation for an uncompressible, non-reactive liquid, when its temperature is modified from T1 to T2


Equation 3


The variable c is the specific (per unit of mass)  heat capacity of a liquid (it is explicitly stated in the report that the constant-volume specific heat equals the pressure-constant specific heat, what means that we are talking about uncompressible liquids. Therefore, this formula has only sense when applied to uncompressible liquids that are not undergoing any type of chemical reaction (nor a phase change, as we shall discuss later). In fact, when this equation is used later one, it evidences that all the derivation of the ETP equation refers to liquid oil.


If the first hypothesis is very restrictive and determines the system to which is applied, the second hypothesis has much more implications and is regrettably more inconsistent. It is enounced as follows:


Given


(that is, the entropy variation is diminishing as the outgoing mass is decreasing), so the author of the model concludes that


Equation 4


There are many problems with this deduction. First, limits of applicability. To obtain Equation 4 we have been told that we can neglect the total entropy variation and the entropy associated to outgoing mass because the outgoing mass flow is decreasing. This means that the formula could only be valid for wells that are already in an advanced terminal decline. This hypothesis is not true if we consider the total global number of wells.


Equation 4 is not valid for wells not yet in final decline because even if the entropy change due to heat fluxes equals the entropy change due to irreversible processes when the outgoing mass flow is very low, it does not imply that those two terms are equal at any other time.


But the situation is even worse: if the oil outflow tends to zero, not only the entropy will tend to vanish, but also the heat flow (there is less heat to transfer, by lacking its source, the oil still to be extracted) and also the change in entropy due to irreversibility will bend to zero. All four terms from Equation 3 tend to zero in the final terminal decline, and for assuming that some terms become negligible in front of others (they go to zero faster, we could say), a very detailed analysis is required. This analysis is not done in the report.


The small detail that on top of equation 4 there is a wrong sign (the entropy variation due to irreversibility should appear with a sign minus, when solving equation 2)  is in fact a minor issue (the entropy transference could be redefined with a different convention of signs).


Equation 4 is the starting point to calculate what the report calls “rate of irreversibility production” identified with the letter I and defined as follows:

Equation 5


This amount, as per equation 4, corresponds exactly with the heat Q (being rigorous, the variations are the both quantities are equal), so what can be calculated solving this equation is the associated flow of heat. Coming back to the expression of equation 3 and combining it with that of equation 5 (it is exactly what the report does), what they calculate is the heat flow obtained when taking a uncompressible, non-reactive liquid, that does not experiment any phase transition and taking it from a given temperature (the one of the geological deposit) to other (the one at the surface).


In this last pirouette, without any theoretical explanation, the heat flow is identified with the specific ETP; that is, per unit of oil mass extracted and surprisingly divided by billions of barrels (Gb), thus obtaining the fundamental formula of the report:


Equation 6


Where m represent the extracted masses (of oil if with subscript c, and water, if with subscript w) and the letters c represent the specific heat capacity of the substance (oil if with subscript c and water, if with subscript w)


It is worth to spend some time analyzing this expression. The important thing is the numerator, because the rest consist in dividing by some quite arbitrary amounts (the extracted mass of oil and the Gigabarrels). The numerator has a form that should sound familiar even to a secondary grade student:

Expression 1. Sensible heat of the oil and water mix.


We must remember that the specific heat capacity of a given substance is the amount of heat that has to be given to a gram of it to increase its temperature by 1 degree Celsius. For instance the heat capacity of pure water at 25 º C and normal pressure is one calorie per gram and per centigrade degree, or otherwise, 4.18 joules per gram and centigrade degree. Taking this into account and that the heat capacities of the liquids are “quite” constant (with many nuances), the expression 1 is simply the amount of released heat by a mixture of oil and water when it goes from a temperature TR (that of the deposit) to a T0 (that of the environment). In this point, the problems of this theoretical digression are so numerous that it is difficult to list them all.


There is no reason whatsoever to identify this heat flow from the mixture of oil and water leaving a deposit with that of the energy ETP (Etp by definition has to be the energy consumed by the PPS to obtain, refine and distribute oil).


It is not just that the theoretical rationale implies only a minimum part of the PPS (oil in the deposit) and that there are errors in the approximations (the direst one that invalids everything, in obtaining  equation 4). It is not only that the HGR only computes the heat derived from the extracted mixture. Even discarding these errors, the ETP, as well as the heat, should be a variable of process, not a variable of state. This means that the amount of energy consumed by PPS  depends on the specific processes used to move from one state to the other. Which has the following logic: we do not use the same energy to extract oil with a specialized brand new drilling machine, that using a more deteriorated and obsolete equipment. We do not incur in the  the same energy consumption when transporting oil by a tortuous and long road, that sending it through a well-maintained pipeline system, etc. etc. That is precisely the difficulty implied by trying to assess the ETP from first principles: it is necessary to know in detail the specific processes used. Besides, these processes can be improved with time (in fact this is what usually happens). Therefore, any attempt to make forecasts has to consider these factors as well as many others (financial, geopolitical technological, or demand) that the report does not even mention.


Even from the point of view of evaluating this heat flow (which by the way has a minor importance with respect to many other processes that need to be described)  there are many errors. Specifically, given the fact that the temperature of the deposit is of several hundreds degrees Celsius, it could be assumed that in some point from the deposit and the wellhead, the mix of oil and water could suffer a liquid to gas transition, as the pressure decreases, and the subsequent latent heat should be accounted. In any case this heat flow has no much sense, because the oil does not come out at the deposit temperature (it will be very dangerous, as the contact with the oxygen could lead to a deflagration). There must be a temperature exchange process in the extraction (likely favored by the well design), that will introduce irreversible processes that should be accounted in the last term of the equation (and there are not).


It is rather curious to see the water fraction appearing in the last moment of the derivation, when in fact this water is entering basically pumped in from the surface to favor the oil extraction; but it was  precisely the incoming mass term what was the first one to be eliminated in the first simplification. In fact the water inflow also implies a heat flow not considered, of opposite sign to the one considered in the formula, that will probably tend to diminish in the left side of equation 4.


The entropy is a variable of state and it characterizes, as such, the state of the system; but knowing just the entropy does not suffice to completely characterize a state; other complementary variables are needed, such as temperature, pressure, internal energy, chemical potentials…That’s why even knowing completely the specific process involved in the ETP for the PPS system, the entropy alone will not be enough for evaluation ETP; other complementary variables that the report does not contemplate will also be required.


This flaw is severe: apart from the need to introduce more terms in the sums of equation 1 and making consistent hypothesis, it will be necessary to define a good number of additional equations, as many as the state variables, also containing a good number of terms in each of them. In this sense the ETP model has only scratched the surface of the thermodynamic modeling of the energy required for the continuity of the PPS.


Some more observations could be made, but I believe it is crystal clear that there is no theoretical reason for the ETP curve, derived from this thermodynamic model. As such, at most the model could work in an effective way, assuming that the curve resembles the right one and that the model parameters can be adjusted a posteriori to produce meaningful results Therefore, data processing in the model is crucial. Regrettably, data processing has many problems on itself, as described by  Carlos de Castro.. I will leave them out to shorten this post.


Discussion of the ETP model.


The emergence of the ETP model some months ago raised big expectations among the experts in energy depletion, especially because the convincing nature of a fast collapse of the oil industry. The present strong divestment in upstream by oil companies, that started in 2014 and still lasts today, seems to be in perfect agreement with the problems anticipated with the HGR and with the posts by Louis Arnoux


In this sense, the appearance of the report whose theoretical grounds have been discussed here, it is something positive, as it opens a necessary debate on the decline of the net energy to still today reluctant sectors to this type of discussion. On the other hand the application of the thermodynamic principles to the assessment of the net energy limits, it is something that has sense and it seems an interesting path to explore, even if this will imply a very exhaustive and meticulous work, with a good comprehension of the many aspects of the oil industry, to ensure a correct accounting.


In the negative side, there are many things: an incorrect application of the theory, wrong deductions, definitions with no physical meaning, defective data processing, lack of interaction with the economy and other energy sources, etc.

Taking into account these deficiencies, it is obvious that the ETP model cannot be used for a serious discussion of the energy depletion problems; at least not until a whole review is made.


My work in this post, has been somehow similar (although more informal) than the one I would have made as a peer reviewer if sent to a scientific media. In fact, once the Hill’s Group released the report, it should have been desirable to send it to a scientific journal to be peer reviewed, to be later released and disseminated in the scientific community, general public and stakeholder. Passing this revision would have been a guarantee that the work had been assessed by experts and the results are trustworthy.  I understand the authors may already be working on that. My advice is that they wait for the reviewers to finish and apply the suggested corrections, before giving more publicity to a model that as it is today can only serve to discredit to a community that deserves to be heard more than ever.


Personal assessment


The appearance of the ETP model has prompted the necessity to endow the community with the adequate models to describe the growing non-linearity of the system, that will be growing if there are no short term reactions to the problems already detected.


However, the ETP model has been received with a surprising lack of criticism by the community, in a collective gap in which I myself have participated in some way. It may have happened a confirmation bias: as one colleague said, a brilliant and enlightened physicist, the model started with correct premises and arrived to coherent conclusions; therefore, it was reasonable to expect that the model will work properly.


In reality, very few had bothered to calmly analyze the model and point out the deficiencies. I hope this should serve to maintain a critical thinking  and do not accept things that seem to confirm what we believe. All hypothesis must be examined and all the works revised to obtain the highest efficiency, yielding the best results to all of us. I do hope that this post and similar others could contribute to improve the model and to improve our understanding of the troubled way ahead of all of us.


Bests.


Antonio


Posted in Ugo Bardi | Tagged , , | Comments Off on Ugo Bardi: The Hill’s Group report

Peak Uranium by Ugo Bardi from Extracted: How the Quest for Mineral Wealth Is Plundering the Planet

Figure 1. Cumulative uranium consumption by IPCC model 2015-2100 versus measured and inferred Uranium resources. Figure 1 shows that the next IPCC report counts very much on nuclear power to keep warming below 2.5 C.  The black line represents how many million tonnes of reasonably and inferred resources under $260 per kg remain source: 2016 IAEA redbook Clearly most of the IPCC models are unrealistic. Source: David Hughes (private communication)

Preface. This is an extract of Ugo Bardi’s must read “Extracted” about the limits of production of uranium. You can find plenty of material saying there is are a lot of uranium reserves and resources  left elsewhere (EMD 2019). The problem is, uranium requires fossil fuels to be mined, extracted, and processed, and world oil production peaked in 2018, peak world coal in 2013. If you read my book “When Trucks stop running”, you’ll see why trucks can’t run on electric batteries or overhead wires, and without trucks, civilization collapses, so nuclear electricity is not going to solve the energy crisis, and leaves toxic waste our descendants will have to deal with for hundreds of thousands of years (Alley 2013)

Uranium in the news:

Novikova T (2022) Russia & US Uranium. Counterpunch.org. The United States relies heavily on imported uranium, with Russia supplying about 16 percent. And also 23% of enrichment services are provided by Russia, so total imports may be more than 16%.  Though so many reactors in the U.S. are long past their time of retirement and are shutting down that this may well reduce consumption by 16% or more.  The U.S. only produced 1% of world uranium production, and new permits take years.

July 2016 Water power. Extracting uranium from seawater. Scientific American. Stephen Kung of the DOE’s office of Nuclear Energy said that terrestrial sources of uranium are expected to last for only another 100 to 200 more years. It takes 8 weeks to extract 6 grams of uranium from seawater, or 0.75 grams per day,  It takes 27,000,000 grams to run a 1 gigawatt nuclear power plant for one year, so it would take 98,630 years to extract enough uranium from seawater to run just one nuclear power plant.

Alice Friedemann  www.energyskeptic.com  Author of Life After Fossil Fuels: A Reality Check on Alternative Energy; When Trucks Stop Running: Energy and the Future of Transportation”, Barriers to Making Algal Biofuels, & “Crunch! Whole Grain Artisan Chips and Crackers”.  Women in ecology  Podcasts: WGBH, Planet: Critical, Crazy Town, Collapse Chronicles, Derrick Jensen, Practical Prepping, Kunstler 253 &278, Peak Prosperity,  Index of best energyskeptic posts

***

Bardi, Ugo. 2014. Extracted: How the Quest for Mineral Wealth Is Plundering the Planet. Chelsea Green Publishing.

Although there is a rebirth of interest in nuclear energy, there is still a basic problem: uranium is a mineral resource that exists in finite amounts.

Even as early as the 1950s it was clear that the known uranium resources were not sufficient to fuel the “atomic age” for a period longer than a few decades.

That gave rise to the idea of “breeding” fissile plutonium fuel from the more abundant, non-fissile isotope 238 of uranium. It was a very ambitious idea: fuel the industrial system with an element that doesn’t exist in measurable amounts on Earth but would be created by humans expressly for their own purposes. The concept gave rise to dreams of a plutonium-based economy. This ambitious plan was never really put into practice, though, at least not in the form that was envisioned in the 1950s and ’60s. Several attempts were made to build breeder reactors in the 1970s, but the technology was found to be expensive, difficult to manage, and prone to failure. Besides, it posed unsolvable strategic problems in terms of the proliferation of fissile materials that could be used to build atomic weapons. The idea was thoroughly abandoned in the 1970s, when the US Senate enacted a law that forbade the reprocessing of spent nuclear fuel.

A similar fate was encountered by another idea that involved “breeding” a nuclear fuel from a naturally existing element—thorium. The concept involved transforming the 232 isotope of thorium into the fissile 233 isotope of uranium, which then could be used as fuel for a nuclear reactor (or for nuclear warheads). 48 The idea was discussed at length during the heydays of the nuclear industry, and it is still discussed today; but so far, nothing has come out of it and the nuclear industry is still based on mineral uranium as fuel.

Today, the production of uranium from mines is insufficient to fuel the existing nuclear reactors. The gap between supply and demand for mineral uranium has been as large as almost 50% from 1995 to 2005, though gradually reduced the past few years.

The U.S. mined 370,000 metric tons the past 50 years, peaking in 1981 at 17,000 tons/year.  Europe peaked in the 1990s after extracting 460,000 tons.  Today nearly all of the 21,000 ton/year needed to keep European nuclear plants operating is imported.

The European mining cycle allows us to determine how much of the originally estimated uranium reserves could be extracted versus what actually happened before it cost too much to continue. Remarkably in all countries where mining has stopped it did so at well below initial estimates (50 to 70%). Therefore it’s likely ultimate production in South Africa and the United States can be predicted as well.

Table 1. The European mining cycle allows us to determine how much of the originally estimated uranium reserves could be extracted versus what actually happened before it cost too much to continue. Remarkably in all countries where mining has stopped it did so at well below initial estimates (50 to 70%). Therefore it’s likely ultimate production in South Africa and the United States can be predicted as well.

The Soviet Union and Canada each mined 450,000 tons. By 2010 global cumulative production was 2.5 million tons.  Of this, 2 million tons has been used, and the military had most of the remaining half a million tons.

The most recent data available show that mineral uranium accounts now for about 80% of the demand.  The gap is filled by uranium recovered from the stockpiles of the military industry and from the dismantling of old nuclear warheads.

This turning of swords into plows is surely a good idea, but old nuclear weapons and military stocks are a finite resource and cannot be seen as a definitive solution to the problem of insufficient supply. With the present stasis in uranium demand, it is possible that the production gap will be closed in a decade or so by increased mineral production. However, prospects are uncertain, as explained in “The End of Cheap Uranium.” In particular, if nuclear energy were to see a worldwide expansion, it is hard to see how mineral production could satisfy the increasing uranium demand, given the gigantic investments that would be needed, which are unlikely to be possible in the present economically challenging times.

At the same time, the effects of the 2011 incident at the Fukushima nuclear power plant are likely to negatively affect the prospects of growth for nuclear energy production, and with the concomitant reduced demand for uranium, the surviving reactors may have sufficient fuel to remain in operation for several decades.

It’s true that there are large quantities of uranium in the Earth’s crust, but there are limited numbers of deposits that are concentrated enough to be profitably mined. If we tried to extract those less concentrated deposits, the mining process would require far more energy than the mined uranium could ultimately produced [negative EROI].

Modeling Future Uranium Supplies

Uranium supply and demand to 2030

Table 2. Uranium supply and demand to 2030

Michael Dittmar used historical data for countries and single mines, to create a model that projected how much uranium will likely be extracted from existing reserves in the years to come. The model is purely empirical and is based on the assumption that mining companies, when planning the extraction profile of a deposit, project their operations to coincide with the average lifetime of the expensive equipment and infrastructure it takes to mine uranium—about a decade.

Gradually the extraction becomes more expensive as some equipment has to be replaced and the least costly resources are mined. As a consequence, both extraction and profits decline. Eventually the company stops exploiting the deposit and the mine closes. The model depends on both geological and economic constraints, but the fact that it has turned out to be valid for so many past cases shows that it is a good approximation of reality.

This said, the model assumes the following points:

  • Mine operators plan to operate the mine at a nearly constant production level on the basis of detailed geological studies and to manage extraction so that the plateau can be sustained for approximately 10 years.
  • The total amount of extractable uranium is approximately the achieved (or planned) annual plateau value multiplied by 10.

Applying this model to well-documented mines in Canada and Australia, we arrive at amazingly correct results. For instance, in one case, the model predicted a total production of 319 ± 24 kilotons, which was very close to the 310 kilotons actually produced. So we can be reasonably confident that it can be applied to today’s larger currently operating and planned uranium mines. Considering that the achieved plateau production from past operations was usually smaller than the one planned, this model probably overestimates the future production.

Table 2 summarizes the model’s predictions for future uranium production, comparing those findings against forecasts from other groups and against two different potential future nuclear scenarios.

As you can see, the forecasts obtained by this model indicate substantial supply constraints in the coming decades—a considerably different picture from that presented by the other models, which predict larger supplies.

The WNA’s 2009 forecast differs from our model mainly by assuming that existing and future mines will have a lifetime of at least 20 years. As a result, the WNA predicts a production peak of 85 kilotons/year around the year 2025, about 10 years later than in the present model, followed by a steep decline to about 70 kilotons/year in 2030. Despite being relatively optimistic, the forecast by the WNA shows that the uranium production in 2030 would not be higher than it is now. In any case, the long deposit lifetime in the WNA model is inconsistent with the data from past uranium mines. The 2006 estimate from the EWG was based on the Red Book 2005 RAR (reasonably assured resources) and IR (inferred resources) numbers. The EWG calculated an upper production limit based on the assumption that extraction can be increased according to demand until half of the RAR or at most half of the sum of the RAR and IR resources are used. That led the group to estimate a production peak around the year 2025.

Assuming all planned uranium mines are opened, annual mining will increase from 54,000 tons/year to a maximum of 58 (+ or – 4) thousand tons/year in 2015. [ Bardi wrote this before 2013 and 2014 figures were known. 2013 was 59,673 (highest total) and 56,252 in 2014.]

Declining uranium production will make it impossible to obtain a significant increase in electrical power from nuclear plants in the coming decades.

Here are 7 other posts from this great book:

References

Alley, W. M., et al. 2014. Too Hot to Touch: The Problem of High-Level Nuclear Waste.Cambridge University Press.

EMD. 2019. EMD Uranium (Nuclear minerals and REE) committee annual report. i2massociates.com

Posted in Peak Uranium, Ugo Bardi | Tagged , | 5 Comments