Gail Tverberg: Why peak coal, oil, and natural gas will all happen at the same time

The world’s coal resources are clearly huge. How could China, or the world in total, reach peak coal in a timeframe that makes a difference?

If we look at China’s coal production and consumption in BP’s 2016 Statistical Review of World Energy (SRWE), this is what we see:

Figure 1. China's production and consumption of coal based on BP 2016 SRWE.

Figure 1. China’s production and consumption of coal based on BP 2016 SRWE.

Figure 2 shows that the quantities of other fuels are increasing in a pattern similar to past patterns. None of them is large enough to make a real difference in offsetting the loss of coal consumption. Renewables (really “other renewables”) include wind, solar, geothermal, and wood burned to produce electricity. This category is still tiny in comparison to coal.

Figure 2. China's energy consumption by fuel, based on BP 2016 SRWE.

Figure 2. China’s energy consumption by fuel, based on BP 2016 SRWE.

Why would a country selectively decide to slow down the growth of the fuel that has made its current “boom” possible? Coal is generally cheaper than other fuels. The fact that China has a lot of low-cost coal, and can use it together with its cheap labor, has allowed China to manufacture goods very inexpensively, and thus be very competitive in world markets.

In my view, China really had no choice regarding the cutback in back coal production–market forces were pushing for less production of goods, and this was playing out as lower commodity prices of many types, including coal, oil, and natural gas, plus many types of metals.

China is mostly self-sufficient in coal production, but it is a major importer of natural gas and oil. Lower oil and natural gas prices made imported fuels of these types more affordable, and thus encouraged more importing of these products. At the same time, lower coal prices made many of China’s mines unprofitable, leading to a need to cut back on production. Thus we see the rather bizarre result: consumption of the cheapest energy product (coal) is falling first. We will discuss this issue more later.

China’s Overall Historical Production of Energy Products

With the pattern of energy consumption shown in Figure 2, growth in China’s total fuel consumption has slowed, as shown in Figure 3.

Figure 3. China energy consumption by fuel, based on BP 2016 SRWE.

Figure 3. China energy consumption by fuel, based on BP 2016 SRWE.

The indicated increases in total fuel consumption in Figure 3 are as follows: 8.1% in 2011; 4.0% in 2012; 3.9% in 2013; 2.3% in 2014; 1.5% in 2015.

Unless there is a huge shift to a service economy, we would expect China’s GDP to decrease rather rapidly as well, perhaps staying 1% or 2% higher than the growth in fuel consumption. Such a relationship would suggest that China’s reported GDP for 2014 and 2015 may be overstated.

The Problem of Low Coal Prices

Most of us don’t pay attention to coal prices around the world, but according to BP data, coal prices have been following a similar pattern to those of oil and natural gas.

Figure 4. Coal prices since 1999 based on BP 2016 SRWE data.

Figure 4. Coal prices since 1999 based on BP 2016 SRWE data.

Oil prices tend to cluster more closely than those of coal and natural gas because there is more of a world market for oil than for the other fuels. Coal and natural gas have relatively high delivery costs, making it more expensive to trade these products internationally.

Figure 5. World oil prices since 1999 for various oil types, based on BP 2016 SRWE. (Prices not adjusted for inflation.)

Figure 5. World oil prices since 1999 for various oil types, based on BP 2016 SRWE. (Prices not adjusted for inflation.)

Figure 6. Historical prices for several types of natural gas, from BP 2016 SRWE.

Figure 6. Historical prices for several types of natural gas, from BP 2016 SRWE

The one place where natural gas prices failed to follow the same pattern as oil and coal prices was in the United States. After 2008, shale producers extracted more natural gas for the US market than it could easily absorb. This overproduction, together with a lack of export capacity, led to falling US prices. By 2014 and 2015, prices were falling everywhere for oil, coal and natural gas.

Why Prices of Fossil Fuels Move Together

The reason why prices of fossil fuels tend to move together is because commodity prices reflect “demand” at a given time. This demand is determined by a combination of wage levels and debt levels. When wage levels are high and debt levels are increasing, consumers can afford more goods, such as new homes and new cars. Building these new homes and cars takes many different kinds of materials, so commodity prices of many kinds tend to rise together, to encourage production of these diverse materials.

Why Fossil Fuel Prices Don’t Necessarily Rise Indefinitely

Rising fossil fuel prices depend on rising demand. Wages are not really rising fast enough to increase fossil fuel prices to the levels shown in Figures 4, 5, and 6, so the world has had to depend on rising debt levels to fill the gap. Unfortunately, there are diminishing returns to adding debt. We can witness the poor impact that Japan’s rising debt level has had on raising its GDP.

Adding more debt is like using an elastic rubber band to increase the world output of goods and services. Adding debt works for a while, as the relatively elastic economy responds to growing debt. At some point, however, the amount of debt required becomes too high relative to the benefit obtained. The system tends to “snap back,” and prices fall for many commodities at the same time. This seems to be what happened recently in late 2008, and what has happened again recently. The challenge is to restore world economic growth, since it is really robust world economic growth that allows commodity prices to rise to high levels.

Some Historical Perspective on Rising Energy Prices and Rising Debt

In “normal” times, a small increase in demand will increase production of fossil fuels by several percentage points–generally enough to handle the rising demand. Prices can then fall back again and there is no long-term rise in prices. This situation occurred for quite a long time prior to about 1970.

After about 1970, we found that it became more difficult to raise production levels of energy products, without permanently raising prices. US oil production began to decline in 1970. This started an energy crisis that has been simmering beneath the surface for 45 years. Various workarounds for our energy shortage problem were tried, such as adding nuclear, drilling for oil in new areas such as the North Sea, and building more energy efficient cars. Another approach used was reducing interest rates, to make high-priced homes, cars and factories more affordable.

By the late 1990s, even these workarounds were no longer providing the benefit needed. Another idea was tried: encourage more international trade. This would allow the world access to untapped energy sources, including coal, in the less developed parts of the world, such as China and India.

This too, worked for a while, but resource depletion tended to continue to raise the cost of energy extraction. Also, the competition with low-cost labor in India, China, and other countries tended to hold down the wages of the less-educated workers in the developed countries. Higher prices at the same time that wages for some of the workers were depressed is, of course, a bad mismatch.

One way of “fixing” the problem was with cheaper debt, and more debt, so that consumers could buy homes and cars with lower incomes. This fix of more debt stopped working in 2008, as repayment on “subprime” debt faltered, and all fossil fuel prices collapsed.

Figure 7. World Oil Supply (production including biofuels, natural gas liquids) and Brent monthly average spot prices, based on EIA data.

Figure 7. World Oil Supply (production including biofuels, natural gas liquids) and Brent monthly average spot prices, based on EIA data.

To “re-inflate” the world economy, world leaders began to try to add even more debt. They did this by fixing interest rates even lower, starting in late 2008, using a program called Quantitative Easing (QE). This program was successful in raising commodity prices again, although its effect seemed to diminish with time. China’s huge growth in debt during this period helped as well.

Energy prices turned downward again in mid-2014, when the United States discontinued its QE program, and China (under new leadership), decided not to continue increasing debt as quickly as before. The result was a second sharp drop in commodity prices, without a corresponding drop in the cost of producing these fossil fuels. This shift was devastating from the point of view of energy supply producers.

Impact of Lower Prices on China’s Coal Producers

China has a lot of coal resources, but not all of these resources can be produced cheaply. Generally, the least expensive resources tend to be produced first. When prices are high, it may look like deeper, thinner seams can be extracted, in addition to the easier and cheaper to extract seams, but this is never certain. At some point, prices may fall and thus issue a “stop mining” instruction.

When coal prices drop, producers are likely to encounter debt problems, as loans related to coal operations become due. The reason why this happens is because loans taken out when coal prices were high are likely to reflect an optimistic view of how much can be extracted. Once prices drop, operators discover that they have committed themselves to paying back more in loans than their coal mines can actually produce. This seems to be happening now.

What Are the Implications for Future World Coal Production?

If we look at a chart showing world consumption of energy products by fuel, we see that world coal production has turned down in a similar manner to the downturn in Chinese coal production.

Figure 8. World energy consumption by fuel, separately by major groupings.

Figure 8. World energy consumption by fuel, separately by major groupings.

There are many large areas of the world that seem to be beyond their peak in coal production, including the United States, the Eurozone, the Former Soviet Union, and Canada. Note that the United States’ coal production “peaked” in 1998. This added to pressures for globalization.

Figure 9. Areas where coal production has peaked, based on BP 2016 SRWE.

Figure 9. Areas where coal production has peaked, based on BP 2016 SRWE. FSU means “Former Soviet Union.”

If we consider the rest of the world excluding the areas shown separately in Figure 9 as the “Non-Peaking Portion of the World,” we find that China’s current coal production far exceeds that of the Non-Peaking portion of world production.

Figure 9. Coal production in China compared to world production minus production shown in Figure 8.

Figure 10. Coal production in China compared to world production minus production shown in Figure 8.

Figure 10 indicates that even the non-peaking portion of the world is showing a downturn in production in 2015, no doubt relating to current low prices.

Another issue is that India’s coal production now falls far short of its consumption. Thus, India is becoming a major coal importer. In 2015, India’s consumption of coal slightly exceeded that of the United States, making it the second largest consumer of coal after China, and the largest coal importer. If China should decide to increase its coal consumption by adding imports, it would need to compete with India for supplies.

Figure 14. India's production and consumption of coal, based on BP 2016 SRWE.

Figure 11. India’s production and consumption of coal, based on BP 2016 SRWE.

India’s hope for continued economic growth is also tied to coal, even though it doesn’t produce enough itself. India’s use of natural gas is declining, because its own locally-produced natural gas supplies are declining, and imports are expensive.

Figure 11. India's energy consumption by fuel based on BP 2016 SRWE.

Figure 12. India’s energy consumption by fuel based on BP 2016 SRWE.

Imported coal is more expensive than locally produced coal, because of the transportation costs involved. Thus, adding an increasing portion of imported coal will eventually make India’s products less price competitive. India started from a lower wage level than China, so perhaps it can temporarily withstand a somewhat higher average coal price. At some point, however, it will reach limits on how much of its mix can be imported, before workers cannot afford its products made with this high-priced coal.

As noted above, India and China will be competing for the same exports, if they both expect to grow using imported coal. We can modify Figure 9 to show what the size pool producing imports might now look like, if the countries needing imports is “China + India,” and the part with perhaps extra coal to export is the Non-Peaking Areas from Figure 9, less India.

Figure 12. Coal production for China plus India, compared to production from non-peaking group used in Figure 9, minus India. Based on BP 2016 SRWE.

Figure 12. Coal production for China plus India, compared to production from non-peaking group used in Figure 9, minus India. Based on BP 2016 SRWE.

This comparison shows an even a worse mismatch between the peaking areas, and the current production of areas that might raise their supply.

Is Future Coal Production a Function of Resources Available, or of Prices?

Future coal production is clearly a function of both the amount of resources available and future prices. If there are no resources available, it is pretty clear that no resources can be extracted.

What most researchers have not understood is that future prices are important as well. We can’t expect that prices will rise indefinitely, because low-paid workers, especially, find themselves in a squeeze. They find homes and cars increasingly unaffordable, unless the government can somehow manipulate interest rates down to never heard of levels. Because of this lack of understanding of the role of prices, most of today’s models don’t considered the possibility that price levels may cut back production, at what seems to be an early date relative to the amount of resources in the ground.

Part of the confusion comes the view economists have regarding prices, innovation, and substitution. Economists seem to be firmly convinced that prices will always rise to fix the problem of future shortages, but their models do not seem to take into account the major role that energy plays in the economy, and the lack of available substitutes. Certainly, the history of energy prices does not support this claim.

If I am correct in saying that prices cannot rise indefinitely, then all three of the fossil fuels are likely to peak, more or less simultaneously, when prices can no longer stay high enough to enable extraction. The downslope after the peak will be based on financial outcomes, such as the bankruptcies of coal operators, not on the exhaustion of reserves or resources in the ground. This dynamic can be expected to produce a much sharper downturn than modeled by the Hubbert Curve.

If analysts consider the possibility that prices will never again rise very high for very long, they realize such a low-price scenario would be a catastrophe. That is why we hear very little about this possibility.

Conclusion

It appears likely that China’s coal production has “peaked” and has begun to decline. This is especially likely if energy prices stay low, or never rise very high for very long.

If I am correct about energy prices not rising high enough in the future, all fossil fuels may reach peak production more or less simultaneously in the not too distant future. Widespread debt defaults seem likely if this happens.

If we are, in fact, reaching peak coal, even before peak oil, this is disconcerting for those who believe that the Hubbert Model is the only way of viewing the world. Maybe we are expecting too much from the model; maybe we need a model that considers prices, and how prices depend on wages and rising debt. Falling energy prices are especially bad for the system; they seem to lead to debt defaults.

Posted in China, Gail Tverberg, Peak Coal, Peak Natural Gas, Peak Oil | Tagged , , | Comments Off on Gail Tverberg: Why peak coal, oil, and natural gas will all happen at the same time

Why studies come up with different Energy Returned on Invest (EROI) results: can it be fixed?

[ There are many issues with biofuels beyond their trivial to negative energy return on investment (EROI). In Peak Soil I point out that current industrial farming techniques are destroying topsoil about 15 times faster than pre-fossil fuel economies — Iowa has some of the best topsoil in the world, but in the past century, half of it’s been lost, from an average of 18 to 10 inches deep (Pate 2004 May Rains Cause Severe Erosion in Iowa) and it’s hard to grow food in less than 6 inches of soil. In the past it took an average of 1500 years to deplete topsoil enough to cause a society to collapse (Montgomery 2007 Dirt: The Erosion of Civilizations).  The Ogallala and Califiornia aquifers are also getting permanently depleted.

Alice Friedemann   www.energyskeptic.com  author of “When Trucks Stop Running: Energy and the Future of Transportation, 2015, Springer]

Hall, C.A.S., Dale, B.E., Pimentel, D. 2011. Seeking to Understand the Reasons for Different Energy Return on Investment (EROI) Estimates for Biofuels. Sustainability 3:2413-2432.

Excerpts from this 20 page paper follow  (see the original here)

Abstract: The authors of this paper have been involved in a contentious discussion of the EROI of biomass-based ethanol. This contention has undermined, in the minds of some, the utility of EROI for assessing fuels. This paper seeks to understand the reasons for the divergent results.

Introduction

We are in a time of profound transition in how the world will be fueled and fed. The fossil energy resources (petroleum, coal and natural gas) that have powered the world’s economy since the initiation of the industrial revolution are increasingly problematic in terms of their price (and price volatility), security of supply, declining energy return on investment (EROI) and environmental impacts [1]. These issues are well known and will not be discussed further here.

There is a less well known, but very important, positive correlation between the amount of energy that a society has at its disposal and the wealth of that society. Richer societies invariably have more energy available to them than do poorer societies [2-5] Energy consumption is a key factor associated with the greater wealth of richer societies, which makes sense if economic production is thought of as a work process, with more economic production requiring more energy. Billions of people have no access to modern energy services and they are almost invariably poor in economic terms. If fossil fuels are increasingly problematic in cost, availability and environmental impacts, what energy resources, if any, are available to help lift these billions of humankind from their poverty?

Biofuels (liquid fuels made from plant matter) might be affordable alternatives to petroleum with a low carbon footprint and therefore appear to some investigators attractive as a petroleum alternative.

One downside is that this organic matter might have other good functions, such as maintaining soil fertility or forest biodiversity.

The only large scale petroleum alternatives currently available for liquid transportation fuels are biofuels, principally ethanol made from cane sugar or corn starch, and smaller amounts of biodiesel produced from oilseeds. At present corn-based ethanol provides for about 10% by volume of US motor “gasoline” [5], although this is clearly for gross energy and not net energy. The sustainable resource base could be expanded considerably if we were able to use cellulosic biomass as a feedstock (e.g., some portion of crop residues (although coauthor Pimentel believes that no portion of crop residues should be harvested [6], woody materials, grasses and herbaceous crops) in addition to starch and sugar feedstocks.

However, biofuels are controversial. Their environmental impacts, cost, potential scale and EROI have all been questioned. If we are to make informed and rational choices between our alternatives to petroleum, these questions must be addressed and resolved.

This article focuses on the EROI for biofuels. The different results derived from different investigators (including, perhaps especially, ourselves) have caused some prominent analysts to disparage EROI as not being useful because of the highly divergent results of different investigators [7,8.  We emphasize here corn ethanol, for which most of the EROI analyses have been done, and cellulosic ethanol, a possibly promising new alternative to petroleum gasoline. Indeed the controversy about EROI for corn-based ethanol, usually formulated as whether or not corn-based ethanol makes a positive energy gain relative to the fossil fuels used to produce them, is probably the issue by which most scientists and policy makers have encountered EROI.

It is important that we determine whether it is possible to get reliable estimates of EROI for a given fuel. The corn-based ethanol industry is mature and we can derive reasonable empirical results. A number of corn ethanol EROI (or “net energy”) studies have been performed) which are reported in metastudies by Farrell et al. [7], Hammerschlag (2005, [9]) and Chavas (2008, [10]). From among these studies, a large difference in values can be found by comparing the results of Kim and Dale [11], who give an EROI for corn-based ethanol of 1.73:1 and Pimentel and Patzek [12] (who give a value of 0.82:1).

[ My comment Although 1.73 is a positive EROI, it is not nearly enough!  Other researchers estimate that an EROI of 7, 11, or 12 to 14 might be needed to maintain civilization at its current level:

  • Charles Hall, one of the founders of EROI methodology, initially thought an EROI of 3 was enough to run modern civilization, which is like investing $1 and getting $3 back. But after decades of research, Hall concluded an EROI of 12 to 14 might be needed as illustrated in the figure below (Lambert, Jessica G., Hall Charles A. S. et al. 2014. Energy, EROI and quality of life. Energy Policy 64:153–167).
  • Murphy (2013) found that society needed at least an EROI of 11. So much net energy is provided by any energy resource with an EROI of 11 or higher, that the difference between an EROI of 11 and 100 makes little difference. But once you go below 11, there is such a large, exponential difference in the net energy provided to society by an EROI of 10 versus 5, that the net energy available to civilization appears to fall off a cliff when EROI dips below 10 (Mearns 2008).
  • Weissbach (2013) found that it is not economic to build an electricity generating power source with an EROI of less than 7. ] 

In this paper we seek the reasons for these large differences, and explore whether they are due to the measured, verifiable process-related energy consumption for individual processes or instead primarily on boundary and/or other philosophical assumptions or, perhaps, something else. If the reason is the former then indeed there may be some basis for the criticisms leveled at EROI methodology, if the second then these issues are readily accommodated within the EROI protocol format put forth in this issue by Murphy et al. [13].

Procedural/Supply Chain Issues

We use the term supply chain to refer to issues pertaining to the derivation of energy costs, measured per unit input, per unit product or per ha, associated with the various inputs to the production processes. For example if we know that to grow 60 kg (approximately 1 MJ) of maize requires, on average, about one kg of fertilizer, there are various studies that have been done that can give a fairly unambiguous and limited range of energy values associated with that production (Table 1). Similarly it is possible to derive straightforward estimates of the energy to run a tractor pulling a standard plow for one hour, and to derive the hours required per ha. It becomes more difficult to derive other factors that are not based on simple physical variables; for example, the energy that was used to make and maintain the tractor used, and even the building in which the tractor was produced. But while we do not have look up tables for the energy to make a kg or a unit of a certain tractor, we do have various estimates of energy used per dollar of product in various machinery production facilities, often gathered, when it is possible, from national aggregate statistics. Then that has to be prorated over the useful life of the tractor. We include some of these estimates and their ranges in Table 1 also.

Table 1. Energy Costs Per Physical Unit or Per Dollar of Input to Agriculture or Biorefining


Table 1. Energy Costs Per Physical Unit or Per Dollar of Input to Agriculture or Biorefining

Philosophical and Boundary Issues

A second issue relating to different energy costs among different authors pertains to boundaries and philosophies of inclusion/exclusion. It is nearly universally accepted that one should include direct (on site) energy use and basic indirect (e.g., energy used to make equipment used on site) energy inputs. However, the agreement tends to evaporate when considering whether or not to include other possible energy terms, for example; allocation to coproducts, energy for labor or finance and so on. We do not believe that there is a single acceptable boundary although one should undertake a standard assessment for fuel alone and then clearly specify procedures for each additional analysis). However, comparative studies must use the same boundaries if they are to provide useful results. This issue is addressed in the protocol paper by Murphy et al. [13] in this volume. Good arguments for including all components associated with expenditures are found in [14]. If the different published EROIs for biofuel are due principally to such philosophical issues then this would not undermine the value of EROI as a key metric for analyzing energy systems, or at least not very much. In fact the different approaches can be viewed as a means of gaining greater flexibility and hence utility for EROI by specifying the conditions of the process under consideration, especially if a standard procedure is also done [13]. In addition the different investigations highlight the importance of clearly defining the assumptions made during the EROI analysis and how allocations are handled for multiproduct energy systems.

Quality Adjustment Issues

Not all energy is of the same quality, for example liquid fuels are normally thought of as higher quality than solid fuels (hence we transform corn to alcohol). Electricity is higher quality than fossil fuels, hence we burn some three heat units of fossil fuel to generate one heat unit of electricity. Gasoline has higher energy density than alcohol and so on. We believe that these are the three main reasons that contribute to differences among different estimates of the EROI of the same fuel. The main objective of this paper is to take two very different estimates of EROI and dissect the reasons for the differences.

Methods

Our methods are very simple. We examine the importance of each of the above three factors quantitatively in Kim and Dale [11] and Pimentel and Patzek [12] by comparing each energy-related component in tabular form. Our main activity was to list energy consuming operations and to convert units, for example from Pimentel and Patzek’s kilocalories to megajoules (MJ, multiply kilocalories by 4.186/1000). In all cases energy operations were given in, or converted to, estimates of MJ/L of alcohol generated.

The second main procedure was to examine the importance of the allocation (or not) of energy costs to co-products. The energy costs of producing corn ethanol can be partially offset by allocating the energy used to various products and by-products, such as the dry distillers grains (DDG) made from dry-milling of corn. From about 10 kg of corn feedstock, about 3.3 kg of DDG with 27% protein content can be harvested [15]. This DDG is suitable for feeding cattle that are ruminants, but has only limited value for feeding hogs and chickens. In practice, this DDG is generally used as a substitute for soybean meal that contains 49% protein [15]. This allocation issue is somewhat complex. Soybean production for livestock feed requires less energy per kg than does corn production, because little nitrogen fertilizer is needed for the production of the soybean. However considerable energy is required to remove oil from soybeans and thereby produce the soybean meal that is actually fed to animals. In practice 2.1 kg of soybean protein provides the equivalent nutrient value of 3.3 kg of DDG.

In the system expansion approach used in Kim and Dale [11], the system boundaries were expanded to include corn dry milling, corn wet milling, and soybean crushing systems. Simultaneous linear equations representing the displacement scenarios for co-products of each system were solved as recommended by the International Standards Organization [16]. The underlying assumption is that coproducts that deliver an equivalent function (DDG as an animal feed, in this case) from different product systems displace each other. The fraction of energy allocated to co-products (26%) was then estimated through system expansion. Pimentel and Patzek [12], in contrast, assume that 7% of the overall energy inputs will be allocated to co-products. Consequently, we examined the effect of allocating zero, 7% (coauthor Pimentel’s value) or 26% of the energy used (coauthor Dale’s value) to produce ethanol to DDG (see the Results section).

Results. Since the methods and the results for the corn based ethanol EROI and the cellulosic ethanol EROI are quite different we give first the results for corn-based ethanol, then we include additional methods and new results for cellulosic ethanol.

Results for Corn-Based Ethanol.   The two procedures gave a very different EROI for corn based ethanol, 1.73:1 from Kim and Dale [11] and 0.82:1 from Pimentel and Patzek [12]. Obviously Kim and Dale estimate that a positive energy balance can be generated by turning inputs into ethanol. Pimentel and Patzek [12] conclude that investing fossil energy to make ethanol from corn is senseless because the process of generating ethanol consumes more energy than is derived from the product ethanol.

The principal reason for the large difference between the EROIs derived from these two papers was the difference in the allocation approaches used for coproducts. Kim and Dale used the “system expansion” approach to estimate that only 74% of the total energy costs should be allocated to generating the ethanol and the remainder to the co-product, the protein rich DDG. In brief, the system expansion allocation employed by Kim and Dale assigned the energy “cost” of producing soy bean meal, the major commodity with which DDG competes in the market, to DDG. About a half (approximately, depending on assumption used) of the difference between the EROI given in the Pimentel and Patzek and the Kim and Dale papers was due to co-product allocation issues (i.e., philosophical and boundary issues). About a third was due to differences in estimates of the energy intensity of the inputs (i.e., supply chain issues), and about 15% was due to the greater inclusivity of costs by Pimentel and Patzek. These results are considered in greater detail next.

Supply Chain Issues: Energy per Unit Inputs.  Table 1 gives the energy intensities per unit used in their analyses by the two sets of authors. The inputs are listed side by side in Table 1 so that they can be compared easily. The per unit values used in making subsequent calculations are almost universally within 10 or at most 20% of one another (Table 1). The values used by Pimentel and Patzek tend to be often, but not always, higher than those of Kim and Dale. For example, the former give diesel fuel as 42.6 and the latter 47.5 MJ/L. Since Pimentel and Patzek include the energy required to refine the fuels, which is about 10% of the output value [17], and Kim and Dale do not, this seems to be the reason for the difference.

Exceptions to the general similarities are the energy costs per ton of potassium fertilizer, which differ by 30%, and transport energy which differ by 70%. Neither of these energy inputs is especially large, so we do not think that differing per unit energy costs are likely to contribute in any important way to the final results with the exception of items included by one study but not the other.

Energy Cost Entity Units Kim & Dale. Since there was no consistent pattern of one or the other authors using higher or lower estimates the energy input estimates tend to “come out in the wash”. The estimates of the total energy used to generate a liter of ethanol differ more because of the inclusion or not of different costs.

Pimentel and Patzek include more categories of inputs and hence estimate the total energy input to generating a liter of ethanol as 28.1 MJ, while Kim and Dale estimate 16. 7 MJ, which is 59% of Pimentel and Patzek’s value. If one assigns additional energy costs (based on Pimentel and Patzek’s numbers) for the factors used by Pimentel and Patzek but not by Kim and Dale the latter’s energy costs would be 19.5 MG/L, 69% of the former’s value.

Sensitivity Analysis.  Both Kim and Dale [11] and Pimentel and Patzek [12] allocate some energy costs to coproducts. For the Kim and Dale this is 26% (about 445 kcal or 1. 86 MJ) per liter, while for Pimentel and Patzel it is 7% (about 120 kcal or 0.5 MJ) per liter. In the case of Pimentel and Patzek factoring this credit for a non-fuel source in the production of ethanol reduces the negative energy balance from 46% to 39% (See tables). For Kim and Dale it increases the positive value by about 18%. Some scientists, such as Shapouri et al. [18], would give an even larger credit for DDG of 4, 400 kcal (18.4 MJ) / kg and thereby further increase the positive value of EROI relative to Kim and Dale. Shapouri’s values are based on surveys of operating corn ethanol plants.

Procedural/Metric Issues: Total Energy Costs. The estimated total energy costs to generate ethanol from corn derived by Kim and Dale are about 16.6 MJ/L, and about 28.1 MJ/L as derived by Pimentel and Patzek. Thus Pimentel and Patzek’s estimates are about 170% of those of Kim and Dale (2005). About 2.65 MJ/L of the 11.6 MJ/L difference between the two estimates, or 23%, is due to what might be considered boundary (or perhaps more accurately inclusionary) issues (i.e. Pimentel and Patzek include more categories, such as the energy cost of seeds), and the rest due to the frequently somewhat higher estimates of energy costs at each step by Pimentel and Patzek. For most of the items the estimates of energy costs are similar, again within 10-20%, although usually higher in Pimentel and Patzek’s work. The largest differences are for fuels used in the field for production and for fertilizer plus herbicides/pesticides. The difference of energy used for fuels is mostly Pimentel and Patzek’s inclusion of the energy cost of refining in the cost of oil. Fertilizer energy inputs are also a significant source of difference, with Kim and Dale estimating fertilizer energy inputs at about 1.4 MJ/L ethanol less than Pimentel and Patzek, or about 8% (0.93/11.6) of the difference in total energy inputs between the two sets of authors.

Allocation Issues. Pimentel agrees with Dale that it may be appropriate under some circumstances to include adjustments for co-products. For example the energy and dollar costs of producing corn ethanol can be partially offset by allocating some of the energy used to generate by-products, like the DDG made from dry-milling of corn.

Estimating EROI for Cellulosic Ethanol.  Due to the inherent problems with corn ethanol, including as both Dale and Pimentel acknowledge its low or negative EROI and hence low profitability if and as subsidies are removed, there is a growing interest in using cellulosic biomass from non-food biological material to produce ethanol. However, such cellulosic biomass materials have fewer carbohydrates and more complex matrices of lignin and hemicellulose, thus complicating the ethanol conversion processes. In terms of biomass energy produced per hectare (not liquid fuel), switchgrass and willow are more productive and, of importance here, more efficient than corn in terms of fossil energy inputs versus biomass energy output [12]. The problem is that they are also more difficult to turn into liquid fuel. This analysis focuses on the potential of cellulosic biomass to serve as a liquid fuel.

Willow for cellulose: Heller et al. 2003 (Bruce Dale) Heller’s study used strict life cycle analysis methodologies to evaluate the environmental and energetic performance of willow biomass crop production in the state of New York for electricity generation. The base case analysis was founded on field data from establishment of a 65 hectare willow plantation in western NY under current (as of 2000) silvicultural practices in that state. Overall the system produced 55 units of biomass energy output (raw wood) per unit of fossil energy input over a 23 year lifetime of the willow plantation, or an EROI of 55:1 at the farm gate. As with the Schmer et al. study described above, fertilizer nitrogen and diesel fuel for farm operations were the largest single energy inputs for willow production according to Heller et al. (37% and 46%, respectively of total direct energy inputs, see Figure 3 of their paper) for willow production. EROI for liquid fuel production was not calculated by Heller et al.

Estimates of Energy Costs of Processing Cellulosic Biomass (Bruce Dale). Cellulosic biomass consists of three major components, cellulose, hemicellulose and lignin, in a roughly 40:30:20 mass ratio, depending on the species, plus a host of other components such as ash, protein, etc. Cellulose and hemicellulose are structural carbohydrates composed of sugars that can be fermented to ethanol, at least potentially. The lignin is a complex aromatic polymer and cannot be fermented using current technology. In practice, not all the sugars in cellulose and hemicellulose are fermented. So at the end of the fermentation the residual material contains the lignin plus the residual carbohydrates that were not successfully fermented. It is often assumed that this residual material will be burned to provide all the electricity and steam required to run the processing facility.

In contrast, Pimentel and Patzek believe that at this time the technology to generate cellulosic ethanol at a commercial scale is quite unproven, and even speculative. They assume that if the cellulosic ethanol technology can be made to scale (which they think is very speculative) then all the energy needed for distillation steam will have to come from fossil fuels [25].

[ My note: it is now June 2016 and Commercial scale cellulosic ethanol is still not happening – why?  ]

Bruce Dale bases his EROI estimates for cellulosic ethanol from switchgrass on the work of Schmer et al., who, in addition to estimates of the energy used in the field to grow switchgrass, used modeling to explore the crop conversion (biorefining) portion of the system. Schmer’s calculations were based on models for the biorefinery and the overall system derived by the Energy and Resources Group Biofuel Analysis Meta-Model (EBAMM, University of California-Berkeley). EBAMM assumes that all energy used by the biorefinery will come from residual biomass (i.e., that portion not converted to ethanol). This residue is burned to produced electricity and to generate steam to run the biorefinery, i.e., to distill the alcohol from the mash. EBAMM also estimates an electricity export of 4.79 MJ/L of ethanol produced in the biorefinery. Thus Schmer estimates that the overall energy output is 21.2 MJ/L of ethanol plus (3 (a factor for the quality of electricity) × 4.79 equals 14.4) MJ of electricity for a total of 35.8 MJ/L of ethanol. To check the EBAMM model, Dale used the Schmer data to calculate the energy used for the agricultural system and the Laser et al. [26] modeling information (see Figure 1 in the Laser paper) to describe the conversion (biorefinery) part of the system. Assuming the only energy input to the biorefinery is the energy contained in the biomass, he multiplied the EROI of the agricultural system by the overall thermal energy efficiency of the biorefinery (correcting for electricity quality) and then subtracted the energy costs of biomass transport to the biorefinery to get the system EROI.

Figure 1 from the Laser et al. paper provides an estimate of 43.3% overall thermal efficiency of conversion of feedstock cellulosic biomass (39.5% ethanol and 3.8% surplus electricity) for mature cellulosic ethanol based on biochemical conversion to ethanol combined with electricity generation. (In effect, this means that 43.3 MJ of useful energy products are derived from 100 MJ of feedstock energy delivered to the biorefinery.) Transport energy was estimated from the Heller et al paper as 0.1 kJ per MJ of delivered biomass over a 96 km average transport distance. Using these data, an EROI for cellulosic ethanol from switchgrass is estimated to be 18.1:1, similar to the value of 17.8:1 calculated in Table 3.

There is obviously a substantial difference in the EROI of cellulosic biofuels between Pimentel and Patzek (0.78:1) and Dale (this work) (17.8:1). There are various reasons for this difference. Most importantly, Pimentel and Patzek use 25.5 MJ/L of energy derived from fossil or other outside fuel sources to distill the ethanol from the fermentation residue while Dale assumes that this energy can be derived from the fermentation residue itself. This accounts for 90% (25.5/27.7) of the difference in energy costs and correspondingly most of the difference in the EROIs. The second largest difference is that Dale estimates that there will be 4.79 MJ/L of surplus electricity derived from the process. This is based on the assumption that the residual biomass will be enough to not only distill the ethanol but also to generate some residual electricity. This electricity is weighted by a factor of three representing its quality. Thus Dale’s overall energy output is 21.2 MJ/L of ethanol plus 14.4 MJ of electricity for a total of 35.6 MJ/L of ethanol. These data for energy inputs and outputs for switchgrass ethanol are summarized in Table 3. Table 3. Comparing Different EROI Calculations for Switchgrass.

Discussion: Cellulosic Ethanol

Pimentel believes that since cellulosic biomass, like straw and wood, clearly have very few of the simple starches found in corn, this means that 2 to 3 times more cellulosic material must be produced and processed to obtain a similar amount of cellulosic ethanol as corn (Patzek [27]). Dale responds that corn grain has about 80% carbohydrate (starch), and it is the starch that is converted to ethanol. Switchgrass has about 70% carbohydrate (almost all cellulose and hemicellulose, but very little starch), and these are the carbohydrates that are converted to ethanol. Dale believes that it is incorrect to assert that 2 to 3 times more cellulosic material must be processed to make a similar amount of ethanol.

Current ethanol yields from corn grain are about 2.7 gallons per bushel, or approximately 470 L per MG dry grain. Depending on the species used for biomass and conversion technology, current ethanol yields from cellulosic biomass are about 240–350 L per dry MG of biomass ([28-30], with a rough upper limit at about 400 L per dry MG as the technology improves. The upper limit of the current ethanol yield range quoted above (350 L/MG) was obtained by DDCE, LLC (DuPont Danisco Cellulosic Ethanol, LLC) at their 250, 000 gallon per year cellulosic ethanol demonstration plant in Vonore, Tennessee [30].

At the yields obtained by DDCE, LLC Dale estimates that it takes about 1.3 tons of cellulosic biomass to provide the same amount of ethanol as a ton of grain, not 2 to 3 times as much, as Pimentel suggests and that eventually it may take only about 10% more cellulosic biomass to provide the same amount of ethanol. Actually, since the residual (unfermented) biomass will be burned to produce electricity, for the sake of a higher EROI we may not want to push the ethanol yield any higher than it is right now.

The 3 to 1 multiplier for the quality of the electricity generated from the biomass residual above that required for distillation will push the EROI higher than it would be if more of the carbohydrate were converted to ethanol. The key seems to be getting the right balance of ethanol and electricity to meet our society’s needs for both liquid fuels and electricity at sufficiently high EROI.

Potential Scale of Cellulosic Ethanol Industry

While David Pimentel certainly hopes that the proposal to convert cellulosic biomass into liquid fuel will achieve the goal of generating a significant amount of net energy, he is not optimistic that even if this were possible it could make a sufficient difference. Green plants collect and convert less than 0.1% of the incident sunlight into plant matter [12,31,32]. In the United States all green plants collectively produce biomass equivalent to about 53 exajoules of energy per year from sunlight, only about half of our total fossil energy use. Hence even if we were able to use all agricultural, forest , grassland and aquatic plants, with no production of food or fiber, at an impossible 100% efficiency this would be barely enough energy to displace oil.

Bruce Dale responds that the biofuel industry is not trying to replace all energy used in the United States, but only a portion of our liquid fuel, most of which is currently derived from petroleum. He does agree that a high EROI by itself is not sufficient to give us a useful alternative to petroleum— scale also matters. The latest Department of Energy study indicates that around 1.3 billion metric tons of cellulosic biomass can be sustainably produced each year in the U.S.  2011 https://bioenergykdf.net/content/billiontonupdate . This much biomass is equivalent to about 20 exajoules (or 20 quadrillion BTUs, or 20 × 10 to the 15th power BTUs), roughly 20% of total U.S. energy consumption). Even if only half of the energy content of biomass can be converted to liquid fuel that would still give us a lot of energy. Relatively simple agricultural changes such as double cropping (growing a winter annual grass following corn) could increase the amount of biofuel produced still further [33] as could increasing the yield of energy crops such as switchgrass and willow. David Pimentel believes that the DOE claim that 1.3 billion tons of cellulosic biomass can be harvested sustainably cannot possibly be true based on data that he and his graduate students have gathered. This would mean harvesting 72% of total U.S. biomass production per year including all food, grass, and forests. Food crops and grass alone total 92%.

Estimates of Energy Cost of Cellulosic Feedstock Production (Schmer vs. Sampson). While David Pimentel believes that Schmer’s data on costs and gains of switchgrass production are generally

believable, he points out that there have been several criticisms of that report [21,22,31,32]. Pimentel prefers the assessment of Roger Samson who has more than 15 years of field experience with switchgrass and has a business producing pelletized switchgrass. Samson et al. [21] report that they were able to produce nearly 15 kcal of switchgrass output per 1 kcal of fossil energy input . The main problem David Pimentel has with Schmer et al.’s report is their statement that “Switchgrass produced 540% more renewable energy than nonrenewable energy consumed”. They achieve this projection by using an extraordinary high estimated yield of ethanol from switchgrass processing of 0.38 L/kg (or 380 L per ton). This is the same yield of ethanol produced from 1 kg of corn grain, a much more fermentable feedstock. Pimentel believes that no one else in the world has achieved even a small portion of the return reported by Schmer et al. from switchgrass. Bruce Dale responds that, on the contrary, the current yield of ethanol from corn grain is about 0.47 L/kg of dry corn grain and that many laboratories and commercial operations have already gotten yields approaching 0.35 L/kg of cellulosic biomass, as referenced above. Coauthor Hall wishes to remain neutral in this and other discussions but believe that his coauthors are setting up some very researchable questions for a more mature biofuels industry.

David Pimentel and his collaborator Tad Patzek give several additional arguments about the, in their view, inadvisability of large scale production of fuel from switchgrass in addition to their calculation that it was likely to have an EROI of less than one for one. Patzek in 2010 reported that even if the entire total 140 million hectares of U.S. cropland were planted to switchgrass and converted to ethanol, the gross yield would be only 20% of U.S. gasoline consumption. Also, Smith [34] reported that the cost of producing a liter of ethanol from cellulosic feedstock is ¢54/L ($3.09/gal). Bruce Dale responds that the values of switchgrass productivity and ethanol yield assumed by Patzek are unjustifiably low, since we are already able to produce about 10% (by volume) of our gasoline consumption from about one third of our corn grain, which is about one sixth of the total mass of corn grain and corn residue produced on about 36 million hectares of cropland. Bruce Dale agrees that the Sampson and Schmer data are not that different in terms of the farm level operations. Sampson’s data gives an EROI of about 23:1 for solid biomass delivered to the farm gate while the corresponding farm gate EROI for Schmer is about 38:1. (Interestingly, the Heller et al. data give an EROI of 55:1 at the farm gate, but that is for wood from trees.) These differences can be reasonably attributed to the different yields and agronomic practices employed in the Sampson study (eastern Canada) versus the Schmer study (midwestern US). As with Schmer, Sampson shows that the energy inputs from the fertilizer and the harvesting operations represent the greatest farm level energy inputs, 58% and 29%, respectively, of the overall energy required to grow, harvest and transport switchgrass to the fuel production facility.

Where Dale and Pimentel disagree strongly is on the ethanol yield from switchgrass. Dale notes that, in fact, DDCE and other firms have already achieved ethanol yields similar to or greater than those used by Schmer. Dale notes that over 100 years ago the Germans developed a wood to ethanol process based on sulfuric acid that achieved about 0.21 L/kg. During World War II, the US used this process to produce cellulosic ethanol for conversion to butadiene to produce synthetic rubber. The Vulcan Copper and Supply Company was contracted to construct and operate a plant to convert sawdust into ethanol. This plant achieved an ethanol yield of about 0.21 L/kg over several years but was not profitable in an era of cheap oil and was closed after the war [35]. Bruce Dale notes that there are a number of smaller (e.g., Mascoma, Gevo, KL Energy, Coskata) and larger (e.g., Shell, BP, DuPont, Chevron, ConocoPhillips) firms that are actively developing cellulosic ethanol and other biofuels from different materials including corn stover, wheat straw, mixed hardwood chips, sugar cane bagasse, etc. [36]. Although process data are generally confidential, these firms are working to increase these yields and seem to be making real progress. Some of them are already operating large demonstration plants. For example, DDCE, a cellulosic ethanol firm owned by DuPont, publicly states that they are achieving 85 gallons per ton (350 L per dry MG or 0.35 L/kg) at their demonstration plant in Vonore, Tennessee [30].

Large Differences in Distillation Energy. Finally, there is a clear difference in opinion on whether or not we will be able to use residuals for fuel for distillation, and this is the main reason that the EROI estimates are so different. Of course because the technology is barely operational at a commercial scale we cannot check which assumption is correct. Coauthor Dale believes that many different estimates by the National Renewable Energy Laboratory (NREL) and others have shown that more than enough energy is contained in the biomass to run the biorefinery and even have enough left over to export surplus electricity [26,37,38]. The NREL calculations in particular have been extensively vetted by industry and the latest NREL report is coauthored by six practicing engineers from the Harris Group, a large, diversified engineering services and design firm [39]. Also, if the residuals are not burned to provide process heat and electricity, they will have to be disposed of in some way, probably by landfilling. It does not seem reasonable to suppose that industry will not use the ready source of fuel available but will instead opt to pay for its disposal. Furthermore, the Kraft pulp and paper industry is powered largely by its biomass residuals and newer sugar cane to sugar-ethanol-electricity system is completely powered by its residue, sugar cane bagasse, while exporting surplus electricity [40]. Both of these are highly developed, well-established industries. So we have the example of two very large scale industries that show that it is indeed possible to use biomass residuals to provide most or all of the energy needed for biofuel production, presumably including cellulosic biomass.

Pimentel, on the other hand, believes that only some of the residual can be burned. Much of the lignin cannot be extracted and burned. According to the website Lignoworks [41] “Most schemes propose to use the separated lignin as a fuel to run the plant. However, a process that converts all of the input biomass to fuel is unlikely to be economically feasible”. Further support for the statement that only a small portion of the lignin can supply energy comes from specialists in paper production in Alabama [42]. They stated that separating the lignin from the water was too costly in terms of both energy and dollars. What they do is spray the water-lignin mixture into the boilers. They claim only a little net energy from this. The same would be true for cellulosic ethanol production.

Coauthor David Pimentel further states that “There is no evidence that the suggested potential improvements in cellulosic ethanol are possible. Examine the multi-billion dollars that have been spent for the past 5 years with no result.” [43,44]). He also believes that the GREET model is very optimistic, and generates high yield estimates that have not been verified in the field.

Conclusions and Summary

An important objective of this paper has been realized. The coauthors agree that the EROI concept is valuable and can provide important insights about the desirability of particular energy systems. The reasons for the published differences between coauthors Dale and Pimentel with regard to corn ethanol’s EROI have been dissected and are shown to be primarily due to allocation issues, not to inherent problems with the underlying concept of EROI.

These results highlight the importance of performing EROI using transparent methodologies and allocation approaches, clearly defined system boundaries, and using the best data possible.

Lack of crucial data for operating cellulosic ethanol systems makes these EROI calculations inherently more speculative than those for corn ethanol. However, farm level EROI’s are relatively high for cellulosic biomass production (ranging from 10:1 to about 50:1 in this analysis). Therefore it is the efficiency of energy conversion in the biorefinery, in particular the practicality of using residual biomass to power the biorefinery, which will determine whether cellulosic ethanol systems can reach the very attractive EROIs that seem possible.

Acknowledgments

The first author greatly appreciates the good will of the second and third author to attempt to deal with their differences in an open and friendly manner through a joint publication. It was not easy for anyone.

References and Notes

  1. US Energy Information Agency. International Energy Outlook. www.eia.doe.gov/oiaf/ieo/ index.html
  2. Oh, W.; Lee, K. Causal relationship between energy consumption and GDP revisited: The case of Korea 1970- 1999. Energy Econ. 2004, 26, 51-59.
  3. Skov, A.M. National health, wealth and energy use. J. Pet. Technol. 1999, 51, 48-60.
  4. Hall, C.A.S.; Klitgaard, K.A. Energy and the Wealth of Nations: Understanding the Biophysical Economy; Springer: New York, NY, USA, 2011.
  5. US Energy Information Agency. Short Term Energy Outlook; US Energy Information Agency: Washington, DC, USA, 2011.
  6. Lal, R.; Pimentel, D. Soil erosion: A carbon sink or source? Science 2008, 318, 1040-1042.
  7. Farrell, A.E.; Plevin, R.J.; Turner, B.T.; Jones, A.D.; O’Hare, M.; Kammen, D.M. Ethanol can contribute to energy and environmental goals. Science 2006, 311, 506-508.
  8. Patzek, T. Thermodynamics of the corn-ethanol biofuel cycle. Crit. Rev. Plant Sci. 2004, 23, 519-567.
  9. The conclusions of some of these papers on corn ethanol’s EROI have been subject to debate (e.g., see responses to that article in Science 2006, 312:1746). Kammen, an important contributor to the basically positive view given in Farrell et al., seems to have become less positive as seen in an article in Time magazine (7 June 2007).
  10. Hammerschlag, R. Ethanol’s energy return on investment: A survey of the literature 1990– present. Environ. Sci. Technol. 2006, 40, 1744-1750.
  11. Kim, S.; Dale, B.E. Life cycle assessment of various cropping systems utilized for producing biofuels: Bioethanol and biodiesel. Biomass Bioenergy 2005, 29, 426-439.
  12. Pimentel, D.; Patzek, T. Ethanol production using corn, switchgrass and wood; biodiesel production using soybean. In Biofuels, Solar and Wind as Renewable Energy Systems: Benefits and Risks; Pimentel, D., Ed.; Springer Science+Business Media B.V.: Dordrecht, the Netherlands, 2008; pp. 357-394.
  13. Murphy, D.J.; Hall, C.A.S.; Dale, M.; Cleveland, C. Order from chaos: A preliminary protocol for determining the EROI of fuels. Sustainability 2011, 3, 1888-1190.
  14. Henshaw, P.; King, C.; Zarnikau, J. System Energy Assessment (SEA), defining a standard measure of EROI for energy businesses as whole systems. Sustainability 2011, 3, 1908-1943.
  15. Stanton, T.L. Feed composition for cattle and sheep. Colorado State University. Cooperative Extension. 1999, Report No. 1.615. 7 pages.
  16. International Organization for Standardization (ISO). International Organization for Standardization 14041: Environmental Management – Life Cycle Assessment – Goal and Scope Definition and Inventory Analysis; ISO: Geneva, Switzerland, 1998.
  17. Szklo, A.; Schaeffer, R. Fuel specification, energy consumption and CO2 emission in oil refineries. Energy 2007, 32, 1075-1092.
  18. Shapouri, H.; Duffield, J.A.; Wang, M. The energy balance of corn ethanol: An update. Agricultural Economic Report 813, US Department of Agriculture: Washington, DC, USA. 2002.
  1. Patzek, T.W. Thermodynamics of the corn-energy biofuel cycle. Crit. Rev. Plant Sci. 2004, 23, 519-567.
  2. Hermans, J.; Reinemann, D. Integrating bio-fuel production with Wisconsin dairy feed requirements. ASABE J. 2006, Paper number 066036.
  3. Samson, R.; Duxbury, P.; Drisdale, M.; Lapointe, C. Assessment of pelletized Biofuels. PERD Program, Natural Resources Canada, 2000, Contract 23348-8- 3145/001SQ.
  4. Samson, R.; Duxbury, P.; Mulkins, L. Research and development of fibre crops in cool season regions of Canada. Resource Efficient Agricultural Production- Canada. Box 125, Sainte Anne de Bellevue, Quebec H9X 3V9, Canada, 2004.
  5. Schmer, M. R.; Vogel, K.P.; Mitchell, R.B.; Perrin, R.K. Net energy of cellulosic ethanol from switchgrass. Proc. Natl. Acad. Sci. U. S. A. 2008, 105, 464-469.
  6. Heller, M.C.; Keolian, G.A.; Volk, T.A. Life cycle assessment of a willow bioenergy cropping system. Biomass Bioenergy 2003, 25, 147-165.
  7. Arkenol. Our technology. Concentrated acid hydrolysis. http//:www.arkenol.com/ Arkenolpercent20Increch01.html
  8. Laser, M.; Larson, E.; Dale, B.; Wang, M.; Greene, N.; Lynd, L.R. Comparative analysis of efficiency, environmental impact, and process economics for mature biomass refining scenarios. Biofuels Bioprod. Biorefin. 2009, 3, 247-270.
  9. Patzek, T.W. A probabilistic analysis of the switchgrass ethanol cycle. Sustainability 2010, 2, 3158-3194.
  1. Lau, M.W.; Dale, B. Cellulosic ethanol production from AFEX-treated corn stover using Saccharomyces cerevisiae 424A(LNH-ST). Proc. Natl. Acad. Sci. U. S. A. 2009, 6, 1368-1373.
  2. Kazi, F.K.; Fortman, J.A.; Anex, R.P.; Hsu, D.D.; Aden, A.; Dutta, A.; Kothandaraman, G. Techno-economic comparison of process technologies for biochemical ethanol production from corn stover. Fuel 2010, 89, 520-528.
  3. Provine, W. DDCE, Inc. Personal communication, 2011.
  4. Pimentel, D.; Patzek, T. Editorial: Green plants, fossil fuels, and now biofuels. Bioscience 2006, 56, 875.
  5. Pimentel, D.; Trager, J.; Palmer, S.; Zhang, J.; Greenfield, B.; Nash, E.; Hartman, K.; Kirshenblatt, D.; Kroeger, A. Energy production from corn, cellulosic, and algae biomass. In Global Economic and Environmental Aspects of Biofuels; Pimentel, D., Ed.; Taylor & Francis: Boca Raton, FL, USA, 2012.
  6. Dale, B. ; Bals, B.; Kim, S.; Eranki, P. Biofuels done right: Land efficient animal feeds enable large environmental and energy benefits. Environ. Sci. Technol. 2010, 44, 8385-8389.
  7. Smith, C.H. When long cycles and depletions interest. 2008.http//:www.oftwominds.com/blogmay08/cycle-depletion.html
  1. Katzen, R.; Schell, D.J. Lignocellulosic feedstock Biorefinery: History and plant development for biomass hydrolysis. In Biorefineries—Industrial processes and Products; Kamm, B., Gruber, P.R., Kamm, M., Eds.; Wiley-VCH: Weinheim, Germany, 2006; Volume 1, pp. 129-138.
  2. Sims, R.E.H.; Mabee, W.; Saddler, J.N.; Taylor, M. An overview of second generation biofuel technologies. Bioresour. Technol. 2010, 101, 1570-1580.
  3. Laser, M.; Jin, H.; Jayawardhana, K.; Dale, B.E.; Lynd, L.R. Projected mature technology scenarios for conversion of cellulosic biomass to ethanol with coproduction of thermochemical fuels, power, and/or animal feed protein. Biofuels Bioprod. Biorefin. 2009, 3, 231-246.
  4. National Renewable Energy Laboratory (NREL). Enzymatic Hydrolysis: Current and Futuristic Scenarios; NREL: Golden, CO, USA, 1999; Report NREL/TP-580-26157.
  5. Humbird, D.; Davis, R.; Tao, L.; Kinchin, C.; Hsu, D.; Aden, A.; Schoen, P.; Lukas, J.; Olthof, B.; Worley, M.; et al. Process Design and Economics for Biochemical Conversion of Lignocellulosic Biomass to Ethanol Dilute-Acid Pretreatment and Enzymatic Hydrolysis of Corn Stover, 2011. Technical Report NREL/TP-5100-47764.
  6. Leal, M.R.L.V. Tecnological evolution of sugarcane processing for ethanol and electric power generation. In Sugarcase Bioethanol: R&D for Productivity and Sustainability; Cortez, L. A.B., Ed.; Editora Edgard Blucher Ltda.: São Paulo, SP, Brazil, 2010; pp. 561-582.
  7. Lignoworks. What is Lignin? 2011. Available online: www.lignoworks.ca/content/what- lignin
  8. Eden, M.R. et al. Auburn University. Personal communication, 21 October 2006.
  9. Abelard Organization. http://www.abelard.org/briefings/biofuels.php
  10. Ratliff, E. One Molecule Could Cure Our Addiction to Oil. Wired Magazine 2009, 15. Available online: www.wired.com/science/planetearth/magazine/15-10/ff_plant?
  11. Wang, M. Greet 1.5a–Transportation fuel-cycle model. Argonne National Laboratory, IL, USA. 2000.
  12. University of Nebraska-Lincoln.http://cropwatch.unl.edu/web/cropwatch/archive?articleID= 4585476
  1. Vogel, K.P.; Brejda, J.J.; Walters, D.T.; Buxton, D.R. Switchgrass biomass production in the Midwest USA: Harvest and nitrogen management. Agron. J. 2002, 94, 413-420.
  2. Mooney, D.F.; Roberts, R.K.; English, B.C.; Tyler, D.D.; Larson, J.A. Yield and breakeven price of ‘Alamo’ switchgrass for biofuels in Tennessee. Agron. J. 2009, 101, 1234-1242. 49.
  3. Cook, D.; Shinners, K. 227 Agricultural Engineering Building, University of Wisconsin-Madison, 460 Henry Mall Madison,


Posted in Biofuels, Biomass EROI, Charles A. S. Hall | Tagged , , , | Comments Off on Why studies come up with different Energy Returned on Invest (EROI) results: can it be fixed?

Murphy & Hall 2011 Adjusting the economy to the new energy realities of the second half of the age of oil

[ Below are excerpts from this 5 page paper, slightly rearranged, go here to see all of the text, figures, and tables.   Alice Friedemann   www.energyskeptic.com  author of “When Trucks Stop Running: Energy and the Future of Transportation, 2015, Springer]

Murphy, D.J., Hall, C.A.S.  2011. Adjusting the economy to the new energy realities of the second half of the age of oil. Ecol. Model. doi:10.1016/j.ecolmodel.2011.06.022

fig 8 peak era model of the economy

Fig 8 Peak era model of the economy

Is Growth still Possible?

Due to the depletion of conventional, and hence cheap, crude oil supplies (i.e. peak oil), increasing the supply of oil in the future would require exploiting lower quality resources (i.e. expensive),and thus will most likely occur only at high prices. This situation creates a system of feedbacks where economic growth, which requires more oil, would require high oil prices that will undermine that economic growth. We conclude that the economic growth of the past 40 years is unlikely to continue unless there is some remarkable change in how we manage our economy.

Numerous theories have been posited over the past century that have attempted to explain business cycles, or to generate some means of accelerating a return to rapid growth during slow or non-growth times. Many offer a unique explanation for the causes of and solutions to recessions. They include ideas based on: Keynesian Theory, the Monetarist Model, the Rational Expectations Model, Real Business Cycle Models, Neo- Keynesian models, etc. (Knoop, 2010).

Yet, for all the differences amongst these theories, they all share one implicit assumption: that there will be a return to a growing economy, i.e. growing GDP. Historically, there has been no reason to question this assumption as GDP, incomes, and most other measures of economic growth have in fact grown steadily over the past century.

But if we are entering the era of peak oil, then for the first time in history we may be asked to grow the economy while simultaneously decreasing oil consumption, something that has yet to occur in the U.S. for 100 years.

Oil more than any other energy source is vital to today’s economies because of its ubiquitous application as nearly the only transportation fuel, as a portable and flexible carrier and as feedstocks for manufacturing and industrial production.

Historically, spikes in the price of oil have been the primary cause of most recessions. On the other hand, expansionary periods tend to be associated with the opposite oil signature: prolonged periods of relatively low oil prices that increase aggregate demand and lower marginal production costs, all leading to, or at least associated with, economic growth.

By extension, for the economy to sustain real growth over time there must be an increase in the flow of net energy (and materials) through the economy. Quite simply economic production is a work process and work requires energy. This logic is an extension of the laws of thermodynamics, which state that: (1) energy cannot be created nor destroyed, and (2) energy is degraded during any work process so that the initial inventory of energy can do less work as time passes. As Daly and Farley (2003) describe, the first law places a theoretical limit on the supply of goods and services that the economy can provide, and the second law sets a limit on the practical availability of matter and energy. In other words, the laws of thermodynamics state that to produce goods and services, energy must be used, and once this energy is used it is degraded to a point where it can no longer be reused to power the same process again. Thus to increase production over time, i.e. to grow the economy, we must either increase the energy supply or increase the efficiency with which we use our source energy. This is called the energy-based theory of economic growth, which was advanced significantly by the work of Nicolas Georgescu-Roegen (GeorgescuRoegen, 1971), amongst many others (Costanza, 1980; Cleveland et al., 1984; Ayres, 1999; Hall et al., 2001; Daly and Farley, 2003; Ayres and Ware, 2005; Hall and Day, 2009).

An energy-based theory of economic growth

This energy-based theory of economic growth is supported by data: the consumption of every major energy source has increased with GDP since the mid-1800s at nearly the rate that the economy has expanded (Fig. 1). Throughout this growth period, however, there have been numerous oscillations between periods of growth and recessions.

Fig 1 energy production and GDP for the world from 1830 to 2000


Fig. 1. Energy production and GDP for the world from 1830 to 2000.

Cleveland et al. (2000) analyzed the causal relation between energy consumption and economic growth and their results indicate that, when they adjusted the data for quality and accounted for substitution, energy consumption caused economic growth. Other subsequent analyses that adjusted for energy quality support the hypothesis that energy consumption causes economic growth, not the converse (Stern, 1993, 2000).

In sum, our analysis indicates that about 50% of the changes in economic growth over the past 40 years are explained, at least in the statistical sense, by the changes in oil consumption alone. In addition, the work by Cleveland et al. (2000) indicates that changes in oil consumption cause changes in economic growth. These two points support the idea that energy consumption, and oil consumption in particular, is of the utmost importance for economic growth. Yet changes in oil consumption are rarely used by neoclassical economists as a means of explaining economic growth. For example, Knoop (2010) describes the 1973 recession in terms of high oil prices, high unemployment and inflation, yet omits mentioning that oil consumption declined 4% during the first year and 2% during the second year. Later in the same description, Knoop (2010) claims that the emergence from this recession in 1975 was due to a decrease in both the price of oil and inflation, and an increase in money supply. To be sure, these factors contributed to the economic expansion in 1975, but what is omitted, again, is the simple fact that lower oil prices led to increased oil consumption and hence greater physical economic output. Oil is treated by economists as a commodity, but in fact it is a more fundamental factor of production than either capital or labor (Hall et al., 2001).

Thus we present the hypothesis that higher oil prices and lower oil consumption are both precursors to, and indicative of, recessions. Likewise, economic growth requires lower oil prices and simultaneously an increasing oil supply. The data support these hypotheses: the inflation-adjusted price of oil averaged across all expansionary years from 1970 to 2008 was $37 per barrel compared to $58 per barrel averaged across recessionary years, whereas oil consumption grew by 2% on average per year during expansionary years compared to decreasing by 3% per year during recessionary years (Figs. 2 and 4). Although this analysis of recessions and expansions may seem like simple economics, i.e. high prices lead to low demand and low prices lead to high demand, the exact mechanism connecting energy, economic growth, and business cycles is rather more complicated. Hall et al. (2009) and Murphy and Hall (2010) report that when energy prices increase, expenditures are re-allocated from areas that had previously added to GDP, mainly discretionary consumption, towards simply paying for the more expensive energy. In this way, higher energy prices lead to recessions by diverting money from the economy towards energy only. The data show that recessions occur when petroleum expenditures as a percent of GDP climb above a threshold of roughly 5.5% (Fig 5).

  1. [Every] time the U.S. economy emerged from a recession over the past 40 years, there was always an increase in the use of oil while a low oil price was maintained.
  2. Oil is a finite resource.

In light of these two realities, the following two questions become particularly germane: What are the implications for economic growth if (1) oil supplies are unable to increase with demand, or (2) oil supplies increase, but at an increased price?

There is a clear trend in the literature on energy return on (energy) invested (EROI) of global oil production towards lower EROIs. Gagnon et al. (2009) report that the EROI  for global oil extraction declined from about 36:1 in the 1990s to18:1 in 2006. This  downward trend results from at least two factors: first, increasingly supplies of oil are  originating from sources that are inherently more energy-intensive to produce simply  because firms have developed cheaper resources before expensive ones. For example, in  the early 1990s fewer than 10% of oil discoveries were located in deep water areas. By  2005 the number jumped to greater than 50%.

Enhanced oil recovery techniques are being implemented increasingly in the world’s largest conventional oil fields. For example, nitrogen injection was initiated in the once supergiant Cantarell field in Mexico in 2000, which boosted production for four years, but since 2004 production from the field has declined precipitously. Although enhanced oil recovery techniques increase production in the short term, they also increase significantly the energy inputs to production, offsetting much of the energy gain for society.

Roughly 60% of the oil discoveries in 2005 were in deep water locations (Fig. 6). Based on estimates from Cambridge Energy Research Associates (CERA, 2008), the cost of developing that oil is between $60 and $85 per barrel, depending on the specific deep water province. Oil prices therefore, at a minimum, must exceed roughly $60 per barrel to support the development of even the best deep water resources. But the average price of oil during recessionary periods has been $57/bbl, so it seems that increasing oil production in the future will require oil prices that are associated with recessionary periods.

All of this data indicates that an expensive oil future is necessary if we are to expand our total use of oil. In other words, growing the economy will require oil prices that will discourage that very growth.  Indeed, it may be difficult to produce the remaining oil resources at prices the economy can afford, and, as a consequence, the economic growth witnessed by the U.S. and globe over the past 40 years may be a thing of the past.

EROI and the price of fuels

EROI is a ratio comparing the energy produced by an extraction process to that used to produce that energy (Murphy and Hall, 2010). As such it can be used as a proxy to estimate generally whether the cost of production of a particular resource will be high or low, and it also is probably a good determinant of the monetary costs of various energy resources. For example, the oil sands have an EROI of roughly 3:1, whereas the production of conventional U.S. crude oil has an average EROI of about 12:1 and Saudi crude probably much higher

The production costs for oil sands are roughly $85 per barrel compared to roughly $40 for average global oil and perhaps $20 (or less) per barrel for Saudi Arabian conventional crude (CERA, 2008). As we can see from this data there is an inverse relation between EROI and price, indicating that low EROI resources are generally more expensive to develop whereas high EROI resources are on average relatively inexpensive to develop (Fig. 7). As oil production continues, we can expect to move further towards the upper right of Fig. 7. In summary, relatively low EROI appears to translate directly into higher oil prices.

It is important to emphasize that these models assume that society will continue to pursue business-as-usual economic growth, i.e. the models assume that business persons will continue to assume that oil demand will continue to increase indefinitely in the future (whether or not they understand the role of the oil).

For the economy of the U.S. and any other growth-based economy, the prospects for future, oil-based economic growth are bleak. Taken together, it seems clear that the economic growth of the past 40 years will not continue for the next 40 years.

Summary

The main conclusions to draw from this discussion are:

  • Over the past 40 years, economic growth has required increasing oil consumption.
  • The supply of high EROI oil cannot increase much beyond current levels for a prolonged period of time.
  • The average global EROI of oil production will almost certainly continue to decline as we search for new sources of oil in the only places we have left: deep water, arctic and other hostile environments.
  • Increasing oil supply in the future will require a higher oil price because mostly only low EROI, high cost resources remain to be discovered or exploited, but these higher costs are likely to cause economic contraction.
  • Using oil-based economic growth as a solution to recessions is untenable in the long-term, as both the gross and net supplies of oil has or will begin, at some point, an irreversible decline.

Due to the depletion of high EROI oil the economic model for the peak era, i.e. roughly 1970-2020, is much different from the  pre-peak model, and can be described by the following feedbacks ( Fig. 8): (1) economic growth increases oil demand, (2) higher oil demand increases oil production from lower EROI resources, (3) increasing extraction costs leads to higher oil prices, (4) higher oil prices stall economic growth or cause economic contractions, (5) economic contraction leads to lower oil demand, and (6) lower oil demand leads to lower oil prices which spur another short bout of economic growth until this cycle repeats itself.

This system of insidious feedbacks is aptly described as a growth paradox: maintaining business as usual economic growth will require the production of new sources of oil, yet the only sources of oil remaining require high oil prices, thus hampering economic growth. This growth paradox leads to a highly volatile economy that oscillates frequently between expansion and contraction periods, and as a result, there may be numerous peaks in oil production. Campbell (2009) has referred to this as an undulating plateau. In terms of business cycles, the main difference between the pre and peak era models is that business cycles appear as oscillations around an increasing trend in the pre-peak model while during the peak-era model they appear as oscillations around a flat trend. It is important to emphasize that these models assume that society will continue to pursue business-as-usual economic growth, i.e. the models assume that businesspersons will continue to assume that oil demand will continue to increase indefinitely in the future (whether or not they understand the role of the oil).

But what if economic growth was no longer the goal? What if society began to emphasize energy conservation over energy consumption? Unlike oil supply, oil demand is not governed by depletion, and incentivizing populations to make incremental changes that decrease oil consumption can completely alter the relation between oil and the economy that was described in the aforementioned model. Decreasing oil consumption in the U.S. by even 10% would release millions of barrels of oil onto the global oil markets each day.

For the economy of the U.S. and any other growth-based economy, the prospects for future, oil-based economic growth are bleak. Taken together, it seems clear that the economic growth of the past 40 years will not continue for the next 40 years unless there is some remarkable change in how we manage our economy.

References

  • Ayres, R., Ware, B., 2005. Accounting for growth: the role of physical work. Structural Change and Economic Dynamics 16, 181–209.
  • Ayres, R.U., 1999. The second law, the fourth law, recycling and limits to growth. Ecological Economics 29, 473–483.
  • Campbell, C., 2009. Why dawn may be breaking for the second half of the age of oil. First Break 27, 53–62.
  • CERA, 2008. Ratcheting Down: Oil and the Global Credit Crisis. Cambridge Energy Research Associates.
  • Cleveland, C.J., Costanza, R., Hall, C.A.S., Kauffmann, R., 1984. Energy and the U.S. economy: a biophysical perspective. Science 225, 890–897.
  • Cleveland, C.J., Kaufmann, R.K., Stern, D.I., 2000. Aggregation and the role of energy in the economy. Ecological Economics 32, 301–317.
  • Costanza, R., 1980. Embodied energy and economic valuation. Science 210, 1219–1224.
  • Daly, H.E., Farley, J., 2003. Ecological Economics: Principles and Applications. Island Press.
  • Faber, M., Manstetten, R., Proops, J., 1996. Ecological Economics: Concepts and Methods. Edward Elgar, Cheltenham. Federal, R., 2009. St. Louis Federal Reserve.
  • Gagnon, N., Hall, C.A.S., Brinker, L., 2009. A preliminary investigation of the energy return on energy invested for global oil and gas extraction. Energies 2, 490–503.
  • Georgescu-Roegen, N., 1971. The Entropy Law and the Economic Process. Harvard University Press, Cambridge.
  • Hall, C.A., Balogh, S., Murphy, D.J., 2009. What is the minimum EROI that a sustainable society must have? Energies 2, 1–25.
  • Hall, C.A.S., Day, J.W., 2009. Revisiting the limits to growth after peak oil. American Scientist 97, 230–237.
  • Hall, C.A.S., Lindenberger, D., Kummel, R., Kroeger, T., Eichhorn, W., 2001. The need to reintegrate the natural sciences with economics. Bioscience 51, 663–673.
  • Hayward, T., 2010. BP Statistical Review of World Energy. Report, British Petroleum. Jackson, P.M., 2009. The Future of Global Oil Supply. Energy Research Associates, Cambridge.
  • Knoop, T.A., 2010. Recessions and Depressions: Understanding Business Cycles. Praeger, Santa Barbara.
  • Murphy, D.J., Hall, C.A.S., 2010. Year in review – EROI or energy return on (energy) invested. New York Annals of Science 1185, 102–118.
  • NBER, 2010. US Business Cycle Expansions and Contractions. National Bureau of Economic Research.
  • Smil, V., 2010. Energy Transitions: History, Requirements, Prospects. Praeger, Santa Barbara, CA.
  • Stern, D.I., 1993. Energy use and economic growth in the USA, a multivariate approach. Energy Economics 15, 137–150. S
  • Stern, D.I., 2000. A multivariate cointegration analysis of the role of energy in the US macroeconomy. Energy Economics 22, 267–283.
Posted in Charles A. S. Hall, EROEI Energy Returned on Energy Invested, How Much Left | Tagged , , | 2 Comments

U.S. House hearing on how to get Central Asian oil before Russia and China do, 2006

[ Make no mistake: one of the main focuses of the U.S. government is to keep crude oil flowing, because without oil, civilization as we know it collapses. This is because the transportation that matters most – heavy-duty diesel-engine trucks (tractors, harvesters, 18-wheelers, cranes, construction, logging, etc), rail, and ships, don’t run on electricity.  They run on oil. This hearing focuses on Central Asia.  As Zeno Baran, director at the Center for Eurasian Policy at the Hudson Institute notes:  “On the United States energy interests in Central Asia, I think we see Central Asia energy infrastructure and resources once again becoming a source of competition for great powers”.  

October 12, 2017: I put my notes from the following hearing below the 2006 hearing. It is full of energy independence talk. Yeah, right.

House 113–169. June 11, 2014. Assessing energy priorities in the Middle East and North Africa. House of Representatives. 41 pages.

Alice Friedemann   www.energyskeptic.com  author of “When Trucks Stop Running: Energy and the Future of Transportation”, 2015, Springer and “Crunch! Whole Grain Artisan Chips and Crackers”. Podcasts: Practical Prepping, KunstlerCast 253, KunstlerCast278, Peak Prosperity , XX2 report ]

House 109-219. July 25, 2006. Assessing energy and security issues in Central Asia. House of Representatives.   86 pages.

Ms. ROS-LEHTINEN. The developments in Central Asia are of a tremendous significance to United States energy and security interests in the region. Since gaining their independence from the Soviet Union in 1991, United States focus on Central Asia has increased dramatically, as indicated by American efforts to protect the sovereignty, freedom and democracy of these newly independent states.

Unfortunately, the region’s ability to profit from their energy resources in the past has been limited by Russia’s monopoly over transporting Central Asia’s oil and gas. By continuing to support diversification of pipelines, we will ensure a free flow of energy supplies to Western consumers and expand Central Asia’s economy through investment and development. We will ask our witnesses today to describe the range of U.S. energy concerns and energy interests in the region, in themselves, and their relationship to broader U.S. strategic objectives and needs.

Russia and China have intensified their efforts to isolate the United States politically, militarily and economically from Central Asia. Moscow and Beijing were successful in convincing the Uzbek leadership that the United States sought to overthrow their government. This resulted in the closing of an American military base in Uzbekistan last year. Though unsuccessful, similar efforts were made by Russia and China to pressure Kyrgyzstan to close a strategic United States air base in its country that is currently being used in the counter-terrorism efforts in Afghanistan.

If we allow ourselves to be marginalized by Moscow and Beijing, we could lose our influence in the region and could fail in achieving our immediate security goals and protecting our energy interests in Central Asia.

Gary Ackerman of New York.  As energy demand continues to increase globally, the strategic importance of Central Asia will become clearer than it is today. In truth, the development of the former Soviet republics into more important energy exporters is probably the only region that has received much attention, inadequate as it may be.

To understand why Central Asia hasn’t been on the radar screen in Washington political circles, I think we should recall the glib promises that were made about the abundance of Iraqi oil that were promised in a post-Saddam utopia. There is no way to deny that our misadventure in Iraq has distracted our Government from a host of issues that have not gone away, while our attention has been fixed on the bloody train wreck that amounts to Bush Administration policy in Iraq.

While Washington has been distracted, Iran and China have made greater inroads in Central Asia, seeking commercial and security agreements that ensure the flow of petroleum and natural gas to be used or refined and resold. Russia, too, has been active in trying to establish by commerce the dominance it used to enjoy by force. Russia’s appetite for control of petroleum resources in the region is barely concealed. The reality is that most Central Asia petroleum—after transit through Russia—is on its way to the West, and in light of the winter cutoff of Ukraine, this fact should give us some pause for thought. Moreover, the regimes that have emerged since the end of the Soviet Union are, broadly speaking, friendly kleptocracies. Every one of them has adopted a government model built around what is politely referred to as a ‘‘strongman,’’ a position commonly known as a dictator.

Mr. CARNAHAN.  Issues related to energy and security have become increasingly intertwined in recent years. Though we need to decrease our dependence on foreign oil, we must also make certain that investments in U.S. energy resources are protected throughout the world. Moreover, we need a firm hand to ensure that Iran does not further infiltrate Central Asia, which would have a direct impact on United States and international security.

STEVEN R. MANN, Principal deputy assistant secretary, BUREAU OF SOUTH & CENTRAL ASIAN AFFAIRS, U.S. DEPARTMENT OF STATE. This discussion of engaging Central Asian countries on energy cooperation is very timely as the world confronts tight oil markets and as we consider ways to deepen energy security nationally and globally. This hearing’s focus on Central Asia is particularly appropriate given the inauguration of the Baku-Tbilisi-Ceyhan pipeline on July 13.

U.S. policy for the development of oil and gas reserves in Central Asia is predicated on the use of best commercial standards and transparency to ensure that energy resources are developed efficiently and for the benefit of the countries concerned. In line with this, we have pursued a policy of encouraging multiple pipelines to afford the countries of the region options for export of their oil and gas. The completion of the Caspian Pipeline Consortium (CPC) pipeline from Kazakhstan to Novorossiisk on the Black Sea in Russia and the inauguration of the Baku-TbilisiCeyhan (BTC) pipeline from Azerbaijan to Turkey are signal successes of this policy. We all can be especially proud of the role that American firms have played in these endeavors. BTC in particular represents a new environmental, social, and design benchmark for energy transport worldwide. The construction of the South Caucasus Pipeline will bring Azerbaijani natural gas to European markets and, ultimately, Turkmen and Kazakhstani gas may cross the Caspian and share this route.

In line with these promising developments, the United States welcomes the June 16 signing by Azerbaijan and Kazakhstan of an agreement to facilitate access of Kazakhstani oil to the BTC pipeline. Such an agreement provides Kazakhstan additional capacity to export the large volumes of crude that will need to reach markets starting in 2009–10, when the Kashagan field is slated to come on stream.

U.S. firms are among the biggest investors in Central Asia’s energy sector, and this is a welcome development in many ways. Major U.S. oil and gas firms such as Chevron, ConocoPhillips, and ExxonMobil have extensive investments in the Tengiz, Karachaganak, and Kashagan fields. In addition, U.S. oil services companies and equipment providers such as Parker Drilling, McDermott, and Baker Hughes Services International have found promising opportunities. When speaking of oil and gas development, we must keep in mind that regionally Kazakhstan and Turkmenistan hold the largest reserves. Kyrgyzstan and Tajikistan have significant hydroelectric resources, but little oil and gas. Uzbekistan is largely closed to Western companies and has more limited potential.

The extent of Turkmenistan’s gas reserves remains unclear, and Turkmenistan is completely dependent on the Russian pipeline system to bring its gas to market. A proposed trans-Caspian pipeline foundered in 2000 when the parties could not reach an acceptable commercial agreement, and little has changed since then.

With the completion of the first phase of the East-West Energy Corridor, we must now press on with the second phase of supporting new energy routes out of Central Asia.

Countries bordering the Caspian Sea—Azerbaijan, Iran, Kazakhstan, Russia, and Turkmenistan—are significant oil and gas suppliers to world markets, and their importance is growing. The countries of the north Caspian have reached delimitation agreements, but Iran and Turkmenistan have not yet joined these agreements, among other reasons, because of Iranian insistence on its claim to one-fifth of the Sea. Lack of agreement has impeded exploration and development of hydrocarbon resources in disputed waters, and there remains the potential for conflict in the southern Caspian where promising offshore deposits of oil and gas remain to be developed.

Kazakhstan—Energy.   Given the scope of the energy supply and demand challenges we face today and in years ahead, Kazakhstan can play a very helpful role in addressing the world’s energy needs. Kazakhstan and the entire North Caspian region have tremendous resources. At Tengiz, Kashagan, and other fields, nearly 30 billion barrels of reserves are proven; there is potential for up to 100 billion barrels. Natural gas reserves generally range from 65–70 trillion cubic feet, and could be as high as 100 trillion cubic feet. We strongly support the work of U.S. energy companies and their international partners, who are now focused on ramping up production and improving transportation to markets. U.S. energy companies were among the first non-CIS foreign investors in Kazakhstan; we expect American companies to be active in the region for many years to come.

Overall, Kazakhstan produced about 1.29 million barrels of oil per day (b/d) in 2005, and exported, through CPC and other routes, about one million b/d. The Kazakhstani Government expects production to increase to about 3 million b/d by 2015, especially as the huge Kashagan field comes into production. Moreover, Kazakhstan has expanded production of natural gas in recent years, and expects to reach 570 billion cubic feet this year. A lack of export infrastructure—plus a focus on oil—has limited gas production in Kazakhstan; previously, gas had been flared or re-injected into oil wells to maintain production pressure.

The United States and Kazakhstan enjoy a vigorous strategic partnership with a constant stream of high-level visitors. Energy Secretary Bodman met with President Nazarbayev and Energy Minister Izmukhambetov in March,Vice President Cheney met with President Nazarbayev in May, Secretary Rice saw Foreign Minister Tokayev on July 6.  We have made progress on enabling countries in Central Asia to bring their energy resources to world markets. Much remains to be done, however, and continued robust U.S. engagement is required to push forward the next phase of energy development

LANA EKIMOFF, DIRECTOR, Office of Russian & Eurasian Affairs, U.S. Department of Energy.

I will focus on the opportunity that Central Asia presents for enhancing energy security by adding supply and diversity to world markets.  Data on oil and gas reserves for the Central Asia-Caspian region vary widely. The EIA indicates proven oil reserves are between 17 and 50 billion barrels [my note: the world burns 30 billion barrels a year]. The regions natural gas production is expected to nearly double from 14 bcf per day in 2005 to 24 bcf in 2010.

The countries in this region run the gamut on energy wealth. Azerbaijan, Kyrgyzstan, Turkmenistan and Uzbekistan are endowed with oil and gas resources. Tajikistan and Kyrgyzstan are resource-poor except for hydropower. These countries provide 2 million barrels of oil per day to the global market and are expected to add 4 million barrels by 2010. Their gas production is expected to increase by 60 percent in 2010. However, the full resource potential of this region is still unknown, and reserve figures vary widely. Better data will become available as more exploration takes place.

Developing resources in this region is not without obstacles. There is a lack of export outlets, and we have supported the development of new transit projects.

Our goal is to promote regional partnerships among producing and transit countries. It is important that the countries take responsibility for encouraging the development of new, commercially viable export routes and find ways together, and with commercial entities, to create a win-win situation. We also consistently support the creation of sound legal, fiscal and regulatory policies that will encourage investment in the energy sector.

The Department of Energy maintains ongoing dialogues with officials from Kazakhstan and Azerbaijan. Energy Secretary Bodman recently visited Kazakhstan, where he met with President Nazerbayev and the energy minister. He and Deputy Secretary Sell recently met separately with Azerbaijani President Aliyev in Washington and Istanbul. Their discussions focus on advancing our energy cooperation and recognizing the important role it plays in the global energy market.

The Department has formal dialogues with both countries. As these bilateral dialogues have matured, we have changed the focus from oil and gas issues and expanded our cooperation to a broad range of technologies—energy efficiency, renewable power, nuclear power and environmental concerns. It is important that these countries understand that we are not just interested in their oil and gas contribution to global markets, but also share a common goal of building an energy sector in these countries that is diversified, cost-effective and secure to support their growing economies.

What are our next steps? We will continue to work with countries in the region to facilitate the development of commercially viable oil and gas export infrastructure. We will encourage more surveys to better understand the resource potential in the region, which will help attract investment. We support the full involvement of Kazakhstan and the BTC pipeline, now that Azerbaijan and Kazakhstan have completed an intergovernmental agreement and they begin negotiations on host government agreements with the companies.

We also plan to hold formal energy dialogues this fall in Kazakhstan and Azerbaijan to broaden and deepen our energy cooperation.

Ms. BERKLEY. This is a part of the world that, until recently, I knew so little about and now realize how strategically important it is to our country and, I believe, security in many very sensitive parts of the world. I have also come recently to appreciate how vast their oil and gas reserves are, and how extraordinarily important that is to our economic well-being and security needs. Can you give me some idea of where we fit into this? What would their natural inclination be as a region? Would they gravitate toward Muslim countries? Would they be more interested in coming into the American orb and being stronger allies of ours? Are these issues being determined by their governments on pure economic basis? Are they factoring in other security needs, religious needs? Give me some idea of what is happening there and what is the best-case scenario for the United States and how we can go about achieving that scenario. Because, lately, we are not doing well achieving any best-case scenario anywhere in the world.

Ambassador MANN. Kazakhstan is a good friend of the United States. Overall, there is a powerful Soviet imprint. The countries were Soviet republics for 70 years. Russian, in those years, was the language of the educated, the language of the elites. There is a powerful Soviet legacy, also an infrastructure, not just in oil and gas pipelines, but the rail routes, the air routes, telecommunications, so much of it still links through Moscow and the Russian heartland. That is a fact that just exists in Central Asia. Now, what the countries have said to us in so many ways is: we have greater opportunities now. We want not merely to be a part of the USSR as we were, we want to link to the global economy. The United States, in so many ways, has done this; not to create a sphere of our own, we reject that approach. But what we believe very strongly in is working with the governments and the people to strengthen their independence, strengthen their decision-making autonomy, strengthening their sovereignty and assisting in a process of stable development. One of the other aspects of this Soviet legacy was a forced atheism on the countries that had been Muslim for so many centuries. What we have now in Central Asia, fundamentally, are secular governments. So I think that is what they are left with after those Soviet years.

Ms. ROS-LEHTINEN. What goes on in Kazakhstan stays. Let me ask you about your thoughts on continued military assistance in Kazakhstan and Azerbaijan. Do you believe that it is a priority to help these two countries strengthen their capabilities so that they can independently defend the Caspian Sea energy platforms and interest? In my last question, I wanted to ask you about Iranian influence. You had talked about how close geographically these countries are. To what extent do you believe that the embrace of the Iranian regime in Shanghai implies a degree of legitimacy for and a Russian and Chinese acceptance of Tehran’s current policy? So, Iranian influence and also the United States military assistance to Kazakhstan and Azerbaijan.

Ambassador MANN. In each of those two countries, I think we have a good program of military cooperation and training; and a good part of that is strengthened at precisely that issue you have identified, Caspian security. It is not Central Asia per se, but I will say that I know it is a concern for Azerbaijan, which, in the summer of 2001, had oil field workers chased off of the Alov deposit by an Iranian gunboat. So it is a lively concern for the Azerbaijanis.

ZENYO BARAN, Director, Center for Eurasian Policy, Hudson Institute. On the United States energy interests in Central Asia, I think we see Central Asia energy infrastructure and resources once again becoming a source of competition for great powers. In this new rush, the two most important regional players are China and Russia. Energy-hungry China is actively working to reach long-term oil and gas agreements, and has billions of dollars to spend in order to obtain them. Russia is also spending considerable sums in the region in order to ensure it can maintain its monopoly over Caspian gas transportation to Western markets.

The U.S., however, is missing in action. In the 1990s, the United States had a very successful Caspian energy policy and identified the region as an important non-OPEC source of oil. The United States policy also correctly identified the direct transportation of Central Asian gas to new markets, rather than via the Russian monopoly Gazprom network or through a potential Iranian pipeline, as the best strategy for the region’s energy transportation future. To this end, the United States has already supported several non-Russian and non-Iranian oil and gas pipelines from the Caspian Sea, one of which, as we just heard, the Baku-Tbilisi-Ceyhan oil pipeline, was just recently inaugurated. Securing the East-West flow of Caspian gas has been much more difficult and, so far, efforts have not been successful.

Russia clearly won the first round of Central Asian gas competition. While the United States backed a trans-Caspian gas pipeline to transport Turkmen gas via an undersea pipeline to Azerbaijan and, from there, via Georgia, Turkey and onwards to European markets, Russia was able to finalize a gas pipeline agreement with Turkey to send its gas via Turkey via the Blue Stream gas pipeline underneath the Black Sea.

In part, because of the authoritarian rule of Turkmen President Niyazov until recently, the United States had abandoned its Central Asian gas strategy. The standard arguments were that the U.S. should not engage in energy dialogue with Niyazov until and unless he made improvements to the democracy of the human rights situation in the country. Given that he is not likely to do so, it was deemed best to wait him out and begin energy talks with his successor, no matter how far in the future. This policy was clearly not working. In fact, while the United States waited, we see the Chinese and the Russians have moved in to fill the vacuum. More recently, the trans-Caspian gas pipeline idea was revived by the United States Administration, but this time starting with Kazakhstan.

According to the new strategy, Turkmen gas will be added only later if at all. The logic is that there is already plenty of flared gas in Kazakhstan that could be transported to Western markets. Given Kazakhstan’s pragmatic energy development policy and demonstrated interest in the East-West corridor, this option seems to be a good way forward. Yet, this too may not materialize unless the United States is seriously committed to changing the energy dynamics in Eurasia, which ultimately means confrontation with Russia’s regional energy strategy. To come up with a coherent and pragmatic strategy, it is necessary to look at the broader Eurasian energy picture, specifically at the activities and plans of Gazprom.

While many have wanted to turn a blind eye to the possibility that United States and Russia may not have a win-win option in Central Asian energy, it is clear that Russia is playing it all.

For the United States to ensure its energy and security interests in Central Asia a new framework is needed. In the short term the U.S. will not have much influence in the democratic reform process in the region. The carrots the United States and EU can offer the Central Asians will simply not be attractive enough for them to bite, while the sticks the West can use will not be painful to induce change. We need to recognize also that

There is no win-win strategy possible with Russia and Central Asia regarding energy given the Kremlin’s use of energy as a political weapon and Gazprom’s need to obtain as much of the Central Asian gas as it can to keep Russian domestic gas prices low and to provide uninterrupted gas supply to its European consumers. The United States has two options, it can either give up, which is not advisable, or it can become directly engaged at the top levels on this issue.,

Anti-American developments.   These sentiments are a by-product of two factors, first, competition for energy resources with China and Russia, competition with Russia over the construction of new pipelines, and second, the perceived American promotion of democratic revolutions throughout the region. While its partners all have shared security concerns about the so-called three evils of separatism, terrorism and radicalism, it is of course ironic that Russia and China seem to disregard the longer term impact of their anti-American stand in Central Asia. By opposing the U.S. the way they do, they are effectively bolstering the position of the Islamists.

STEVEN BLANK, PH.D., Research Professor of National Security Affairs,  U.S. ARMY War college.

Today American interests in Central Asia, a region of growing strategic importance, are under attack from three sources: Russia, China, the authoritarian misrule of the Central Asian rulers themselves in many cases, and thirdly from the resurgence of the Taliban in Afghanistan.  Victory in Afghanistan there is the only option for us. If we lose then we will be facing another terrorist upsurge like we did 5, 7 years ago which will threaten all of Central Asia.

Because the security of Central Asia has become connected to the vital security interests of the United States, our presence in Central Asia in all of its dimensions, economic, military, political and so on, is regarded by Moscow and Beijing and to a lesser degree Tehran as a threat to their vital interests and they have spared no effort to try to oust us from Central Asia.

Russia, as has been noted here, has attempted to create a gas monopoly. They failed to create an oil pipeline monopoly, but the gas monopoly is vital to Russian politics in general.

At the same time the Russians have their own military bloc, the CSTO, which I alluded to, and they are also trying to exclude us from the Caspian by creating what they call a CASFOR, a naval force under Russian domination that would exclude non-littoral states from any participation in the defense of the area, defense of world platforms, counter-proliferation and counter-smuggling operations.

We need a broader economic policy than simply ensuring energy access. While we have been successful in energy access with regard to oil in Kazakhstan, we have failed with gas.

Secretary Rice’s initiative with regard to linking up South Asian and Central Asian electricity networks is a commendable example of what needs to be done, but it needs to be thought of in terms of a comprehensive economic policy involving not just the United States Government but the EU and international financial institutions. Similarly, military assistance and training through the Partnership for Peace and getting our allies’ support in Afghanistan, and the situation in Afghanistan is quite critical at the moment, is also an essential aspect of policy because if we fail in Afghanistan we put the whole of Central Asia at risk.

In conclusion I would say that we are facing a coordinated attack on our policies in energy with regard to democratization, with regard to defense and security in Central Asia from Moscow, Beijing and to a lesser degree Tehran, as well as from the Taliban in Afghanistan and their supporters, and also facing obstacles due to the authoritarian misrule or fragility of several, if not all, of the Central Asian Governments.

This makes the obstacles to our policy quite considerable in their extent and scope, but because of the fact that Central Asia is so important strategically and in energy terms, it is essential that we find and devise policy mechanisms and frameworks which will enable us to overcome those challenges in the near and long-term future.

Since 9/11/2001 a second vital interest for the United States has appeared, namely defense of the United States and of Europe from Islamic terrorism personified by Bin Laden and expressed by the Taliban and their allies. Consequently victory in Afghanistan is an unconditional vital interest which must be achieved just as much if not more than as in Iraq. The other important interests of the United States apply first of all to what might be called an open door or equal access for U.S. firms in regard to energy exploration, refining, and marketing. To the extent that these states’ large energy holdings are restricted to Russia due to the dearth of pipelines or oil and gas, they will not be able to exercise effective economic or foreign policy independence.

Today all these interests are under attack and the U.S. policy in Central Asia is embattled and under siege. Moscow and Beijing, as well as to a lesser degree Tehran, view our political and strategic presence in Central Asia with unfeigned alarm. Despite their protestations of support for the U.S. war on terrorism, in fact they wish to exclude us from the area and fear that we mean to stay there militarily as well as in all other ways indefinitely.

Russia has also waged a stubborn campaign to prevent Central Asian states from affiliating either with the U.S. or Western militaries. It seeks to gain exclusive control of the entire Caspian Sea and be the sole or supreme military power there while states like Kazakhstan and Azerbaijan rely upon Western, and especially American assistance to help them develop forces that could protect their coastlines, exploration rigs, and territories, from terrorists, proliferation operations, and contraband of all sorts. Second, Russia has formed the Collective Security Treaty Organization (CSTO) to prevent local states from aligning with NATO or getting too involved with its Partnership for Peace (PfP) program. Another purpose of the CSTO is to create legal-political grounds for permanently stationing Russian forces and bases in Kyrgyzstan, Tajikistan, and possibly Uzbekistan ostensibly to defend these regimes against terrorism. And the CSTO, under Russian leadership is constantly seeking to augment the scope of its missions in Central Asia in order to cement a Russian dominated security equation there. So in reality these forces are there to defend Russian interests and/or keep the current authoritarian regimes in power. Despite Russia’s relative military weakness and unbroken military decline in 1991–2000, Russia now has bases in 12 of the former Soviet republics and the expansion of its capability to project power into these areas if not beyond is one of the leading drives of current Russian military policy. Similarly another key drive of Russian military policy is the effort to develop, sustain, and project the land, sea (Caspian), and air capabilities needed to prevent local governments from either receiving U.S. weapons and assistance or allowing U.S. military bases in their territories. For example this program is the driving force behind Russia’s proposals for a Caspian Sea Force (CASFOR). The practical outcome of so exclusive a force made up only of littoral states would be to confirm the littoral states as dependencies of Russia, put Iran in a subordinate position in the Caspian, and exclude foreign military or energy presence there.

Simultaneously, Moscow and Beijing have also waged an unrelenting campaign beginning in 2002 to impose limits on the duration and scope of America’s presence in Central Asian bases and more generally in the region. They succeeded in Uzbekistan thanks to our misconceived policies there and are constantly bringing enormous pressure on Kyrgyzstan to force us out of the base at Manas. Probably the combination of our deep pockets, high-level intervention by Secretaries Rice and Rumsfeld, and renewed fighting in Afghanistan has allowed us to stay at Manas on condition of paying ever higher rents for its use. Russia has also sought to forestall these states from buying Western equipment by selling them Russian weapons at subsidized prices. And in return for their debts it has sought to restore the Soviet defense industrial complex by buying equity in strategic defense firms located there. Russia and China have also engaged in training programs for Central Asian officers.

Most significantly Moscow and Beijing have utilized the Shanghai Cooperation Organization (SCO) as a platform for a collective security operation in Central Asia, sponsoring both bilateral and multilateral Russian and Chinese exercises with local regimes and with each other on an annual and expanding basis since 2003. The SCO’s utility to Moscow and Beijing does not end here. While there are significant differences between Russia and China and among the other members and observers (India, Pakistan, Iran, Mongolia) as to what the SCO’s primary purpose and function ought to be, i.e. whether its main function should be promotion of trade and economic development; or to be a provider of hard security and another energy forum that Russia would dominate; or to be a genuine basis for regional cooperation as Kazakhstan and the smaller states would prefer, it clearly has been envisioned by Beijing and Moscow as a basis for attempting to unite Central Asian governments in an anti-American regional security organization. There are also divisions among the members as to whether its membership should expand to include the new observer states of Iran, Pakistan, India, and Mongolia. Nevertheless, Beijing openly and consistently proclaims the SCO to be a model for what it is trying to do in regard to Asian security in Southeast Asia and beyond, i.e. replace the U.S.-led alliance system in Asia with one of its own creation that is attuned to its rather than to our and our allies’ stated values and interests. Therefore we should take this organization and its development seriously as a template for China’s and Russia’s, if not Iran’s broader foreign policy objectives.

Thus U.S. policies in regard to security, energy access, and democratization are all under attack in Central Asia from the local dictators, Presidents Putin, and Hu Jintao, and their governments. Adding to the difficulties are the facts that we face a resurgent Taliban, backed up with enormous drug revenues, Pakistani support, and an inconsistent international effort to rebuild Afghanistan while its government remains weak and unsure of itself. As a result, we have lost the base at Karshi Khanabad, face constant pressure in Kyrgyzstan and elsewhere, and are fighting a revived and strengthened Taliban under conditions that are in many ways less favorable than in 2001.

The State Department emphasizes democracy as its main priority.   While such statements make powerful rhetoric; in Central Asia, according to expert observers, they are empty and irrelevant. Moreover, they contribute to the undermining of our security objectives because they feed the belief that we are seeking to unseat reigning rulers, and second, since they believe that the only real opposition is Islamic terrorists, our position fuels their belief that we neither understand the region nor their interests. If democratization is our first priority here than we have given the region over to Russia and China for we have convinced local leaders that these aforementioned beliefs of theirs are correct whatever the real truth might be.

Our utter lack of a viable information policy that is tailored to this region’s mores, cultures, and special needs, has reinforced all those previous negative feelings while also leaving the Russians and Chinese to operate with total freedom in support of retrogressive rulers or corrupt dictators.

We have failed to foresee what might happen in states that are so misgoverned that violence is likely, either through economic distress, or through a succession crisis. Thus our reactions have been uncoordinated and haphazard with resulting negative consequences for U.S. policy that we can all see today. Uzbekistan and Turkmenistan are likely to be failed states when the present rulers leave the scene and in Uzbekistan we have already seen, as has the Uzbek government, that it is vulnerable to both violent incitement and to outbreaks of pubic violence.

NATO’s continuing dilatoriness about sending troops to Afghanistan and giving them sufficiently robust rules of engagement has slowed our ability to counter the Taliban resurgence, especially as we are reducing the number of troops there. Since it appears that more troops might be needed, this is again a wrong sign. Eighth, we have failed to press the international community sufficiently strongly to make good its pledges to Afghanistan, without which reconstruction there will be greatly prolonged if it even is successful.

The State Department’s office of Reconstruction and Stabilization, under Ambassador Herbst, must be directed, if it not already doing so, to begin planning for contingencies having to do with the real possibility of state failure in Central Asia, particularly Uzbekistan and Turkmenistan. If and when that occurs it will usher in violent responses to that condition of state failure. And we cannot allow this chaos to go on in uncontrolled fashion or to abdicate our real interests in the region. Adequate forecasting, and rapid response policies, not only military ones either, must be thought through and implemented so that we are ready to move here on a moment’s notice if necessary.

ARIEL COHEN, PH.D., SENIOR RESEARCH FELLOW, HERITAGE FOUNDATION.  In the last 5 years real and present danger to U.S. national security, especially Islamist terrorism and threats to energy supply, have affected United States policy in Central Asia.  What is needed in Central Asia is a policy that allows the United States to continue to diversify its energy supplies, station its military forces in close proximity to most immediate threats, Afghanistan,

The aim of this testimony is to outline Central Asia’s strategic importance, particularly in terms of energy security, and to assess how our energy issues fit into wider United States strategic interests in the region.

The hydrocarbon reserves are concentrated in the Caspian region. As such, a discussion of Central Asian hydrocarbon resources would be incomplete without including Azerbaijan, which has considerable oil and gas resources in its own right and is central to non-Russian energy transit from Central Asia to points west.

The bulk of Central Asian Caspian hydrocarbons are located in Kazakhstan, Azerbaijan, and to a lesser degree Uzbekistan with a lot of gas in Turkmenistan. Both Tajikistan and the Kyrgyz Republic have limited reserves of oil and gas, but in amounts that thus far have not warranted much attention from foreign investors.

The outlook for Western investment in Central Asia is mixed. Especially the gas sector, investment was low. The leaders of the biggest gas producing countries are not friendly to the United States and their investment climates can be characterized as abysmal.

The Central Asian national gas sector has seen very little outside investments until recently and Russia continues to benefit from the bulk of gas exports from Central Asia as it buys Central Asian gas at prices as low as one-quarter to one-third of market prices in Europe, then resells at market rates. To put things in perspective, it must be noted that Caspian Sea production levels even in their peak will be much smaller than the OPEC, Organization of Petroleum Exporting Countries, combined output. Production levels are expected to reach 4 million barrels a day in 2015 compared to 45 million barrel a day for OPEC countries in that year. Clearly Central Asia is not the largest source of oil and gas nor it’s most successful.

Despite all these difficulties, investors and governments are rushing to lay claim to hydrocarbon reserves of Central Asia.

Geopolitical location is a keen concern as Central Asia continues to evolve as a highly important strategic area, especially for Russia, United States, China, Iran and India. Political instability in other major oil and gas production locations is very much in the news, the Middle East, Venezuela, where President Hugo Chavez just visited Belarus and is signing a $1 billion arms agreement with Russia, including the sale of sophisticated Soho 30 fighter bombers and building of a Kalashnikov machine gun factory in Venezuela.

All these factors of instability are fueling the drive to claim a share of Central Asian resources.

The role of the United States focusing on numerous factors that I mentioned before is also preventing the United States from being a hegemonistic power in the region. The more we are involved, the more Russia and China and Iran are resisting our presence there.

Even if the U.S. has the capacity to limit the presence of other large powers in the region, to do so would be an error, just as it was a mistake for the United States to support an oil and steel embargo on Japan in the 1930s, triggering its southern expansion of the Pacific. The U.S. and other great powers share the goals of stability, economic development and preventive religious radicalization of terrorism.

The United States does not want to openly antagonize China, Russia or India over their involvement in Central Asia but is likely to derive benefits from regional cooperation with them in the region.

Mr. COHEN. If Iran joins SCO or, even without that, if Iran and Russia get together to create what they call a gas OPEC, that will be a step in the wrong direction because they will be controlling together massive production capacity. I do not remember off the top the top of my head after Russia, which is number one, which one is number two in terms of reserves. Either Qatar or Iran. It is Iran. So if you think about a number one and number two producers of gas getting together, it is like Russia and Saudi Arabia getting together. That says it all. In terms of Iran being part of SCO, I think also it is going to be geopolitically a step in a wrong direction, directly affecting American interests if you take Russia and China and Iran to the west, to the east, and to the south because it will be a step to creating a geopolitical bloc essentially aimed at the United States. So we need to fight that.

House 113–169. June 11, 2014. Assessing energy priorities in the Middle East and North Africa. House of Representatives. 

Ileana Ros-Lehtinen, Florida. The Middle East and North Africa region produces over 35% of the world’s oil supply and over 20% of the global natural gas production. We know that energy resources are vital for the region, and as such, they play an important role in the shaping of the geopolitical landscape that impacts our foreign policy.  We also know that the Middle East and North Africa is one of the world’s most volatile regions, prone to unrest, instability, political upheaval, and conflict. In Libya, we saw armed groups occupying many of the strategically important oil fields and export terminals for nearly a year until a partial agreement was reached in April. And in Iraq, we have only recently begun to see that country tap the potential of its proven oil reserves, which is the source of 90% of its budget. But now that Iraq’s second-largest city, Mosul, fell this week to al-Qaeda-affiliated Islamic State of Iraq and the Levant, ISIL, and the increased deterioration of the security situation in that country, there is no telling what the future has in store for its energy sector.

But that just highlights the problem. Most of these countries rely heavily on the sale of oil or gas as their main driver for their economies, and anything that upsets the delicate balance can be extremely detrimental to their economic outlook and has the potential to upend the global energy market.

The instability in Egypt over the last few years, coupled with the large energy subsidies provided to Egyptians, has seen overconsumption in Egypt and has harmed its energy outlook. Both Israel and Jordan had been reliant on gas from Egypt, but now that Israel has the potential to export large sums of gas that Jordan needs, this could be an opportunity for those nations to strengthen their ties.

Israel’s potential could also transform its relationship with Egypt and other Middle Eastern countries as they look for regional solutions to their energy needs. Yet Israel’s natural gas boon hasn’t just affected its relationship in the Middle East and North Africa region, it has also seen a promising and expanding relationship with Greece and Cyprus. The recent discoveries of large hydrocarbons in the Eastern Mediterranean has helped forge an emerging and strategic relationship between these three countries, and this relationship has the potential to completely alter the political, economic, and security situation in the region. Their cooperation has the potential to increase the global supply of energy from friendly, more stable nations, and reduce the world’s dependence on some of these rogue regimes.

And by rogue regimes, we always mean Iran.

Theodore E.  Deutch, Florida.   For decades oil was synonymous with the Middle East. Energy resources and needs have long had a significant impact on the state of play in the region. According to OPEC, its member countries control 81% of the world’s proven oil reserves, with 66% of that coming from the Middle East. But developments over the past several years have dramatically altered the world’s energy supply. For many years, critics of American foreign policy accused the United States of being beholden to certain Middle East oil producers because of our reliance on imports for our energy needs. The discovery of significant energy finds here in our own country have set us on the course toward energy independence. The International Energy Agency predicts the U.S. will be oil independent by 2035.

To help offset the reduction in Iranian oil, Saudi Arabia has increased its production, pledging to make up the difference to avoid a shock to oil prices. The Saudis sit on 25% of the world’s oil reserves and produce roughly 8 billion barrels per day. We hope to see a return to prewar levels in Libya’s output, yet continued fighting and instability has production levels at 10 percent of capacity.

In a stunning development, Israel, long dependent on imports, has found itself sitting on a tremendous amount of hydrocarbons. For years, Israel received most of its gas from the Egyptian pipeline in the Sinai. As a result of the turmoil in Egypt, the pipeline has been attacked 15 times since 2011. The finds in the Tamar and Leviathan offshore fields now stand to make Israel energy independent within 20 years. Last year, the Israeli Government voted to mark 40% of Israel’s gas lines for export. Now, it is Israel that finds itself in the position of being the supplier to its more vulnerable neighbors. Israel and Jordan recently signed a deal for Jordan to receive $500 million worth of gas over 15 years from the Tamar field, which started producing last year. Jordan has faced a serious energy crisis, compounded by the state of affairs in its biggest supplier, Egypt, and the increased strain placed on resources by the influx of over 600,000 Syrian refugees. Jordan is set to begin receiving Israeli gas in 2016. The Leviathan field, which has yet to come on line, is said to be twice as big as Tamar.

Steve Chabot, OhioPolitical unrest and unstable energy supplies in the Middle East and North Africa will have a serious impact global energy markets. This is only intensified by an enormous growing demand for energy in Asia and an uncertain supply of energy in Europe. I hope this hearing will address the changing energy sector in the Middle East and its effect on U.S. policy in the region. I am particularly interested in how the administration plans to improve Iraq’s reliability in the production of oil, especially with some of the political instability going on there. Secondly, what progress has been made in resolving the maritime disputes between Lebanon and Israel and the energy claims in the East Mediterranean. And thirdly, Iran is limited to a million barrels of production of oil a day under the Joint Plan of Action. They are producing 1.3.

Mr. CONNOLLY.   The shift going on here in the United States toward energy independence, really, we are going to rival Saudi Arabia as a producer, what impact does that have on the region? How does that change U.S. foreign policy from being dependent on Middle East oil to now being a net exporter potentially ourselves. And what are we doing to help our allies identify alternative supplies and suppliers? You look at Turkey, 65% of its crude oil comes from 3 countries, Iran, Iraq, and Saudi Arabia; 74% of its natural gas comes from Russia and Iran. How are we helping allies like Turkey look toward alternative sourcing for political stability purposes?

Amos J. Hochstein, Deputy Assistant secretary for Energy Diplomacy, Bureau of Energy Resources,  U.S. Department of State. Energy resources play a critical role in the Middle East and North Africa. As you have mentioned, for decades the fortunes of governments and societies in the region have been closely tied to the availability of energy resources and their ability to bring them to market. Today we find ourselves living in a transformational era for energy markets and the geopolitics of energy, and the capacity of any country to be dynamic and play in this changing global context will determine its success going forward.

I would like to address how countries in the Middle East and North Africa fit into this global energy puzzle and how the United States, in particular the State Department, is working to encourage the development of global LNG markets, build energy linkages in the Eastern Mediterranean, stabilize Libya’s oil and gas sector, and support commercial opportunities in countries such as Algeria.

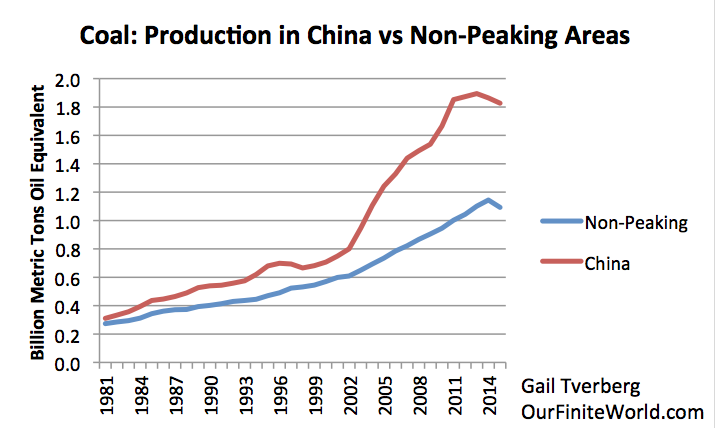
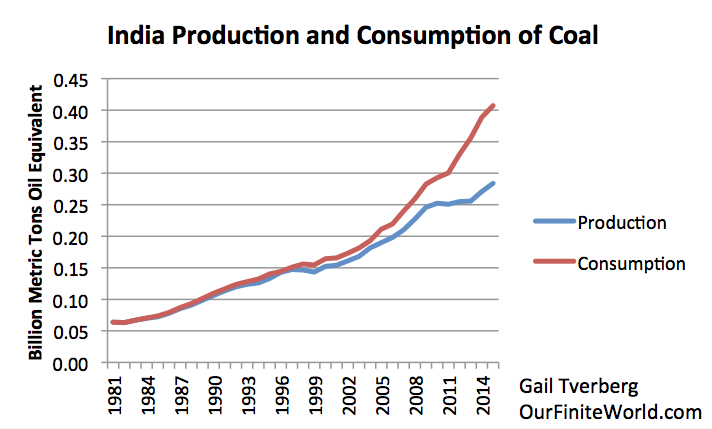
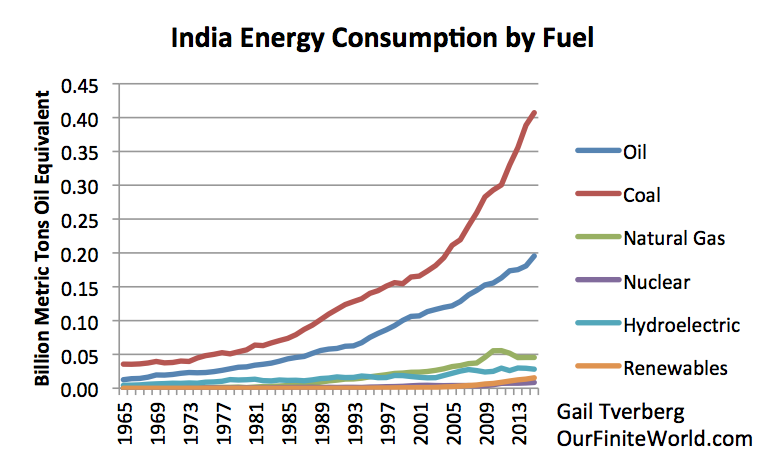
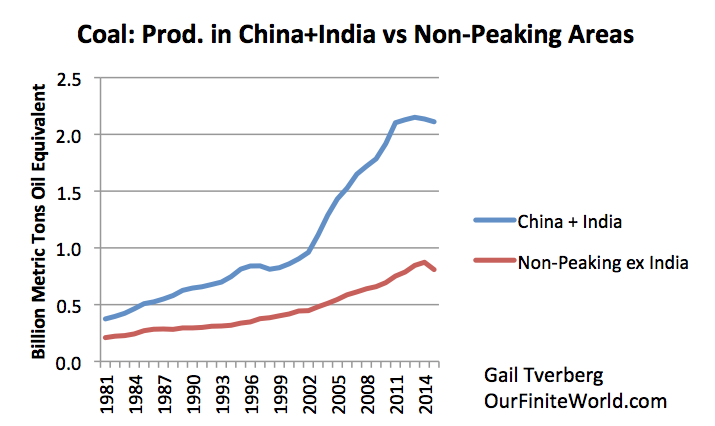
Energy demand around the world is changing rapidly. Consumption growth has shifted away from the traditional OECD markets and consuming countries and moved increasingly toward the world’s emerging economies. Even as Europe, North America, and the advanced economies in Asia reach increasing levels of efficiency in use of energy, high growth rates in China and India and elsewhere have led to rises in energy consumption. Increasingly, we are in a world where prices and commodity flows are driven by the demands of emerging non-OECD consumers. Around the world new energy suppliers are entering the market. We are moving from a world with a small number of well-defined producers, many of them in OPEC, to a world that welcomes new supplies and production increases from North America, Africa, Asia, and South America. New technology and improved production methods have unlocked previously inaccessible energy resources, fundamentally altering the energy landscape. North America has seen major increases in oil production, as has West Africa, and recent discoveries in East Africa and the Mediterranean are frontier areas with bountiful new energy and gas resources. New suppliers are emerging, including countries such as Israel, that were until very recently assumed to be bereft of energy resources. As all of you keenly are aware, the United States is in the heart of this supply shift around the world. We have added 2 million barrels a day of oil production just in the last 2 years, an amount greater than Nigeria’s crude oil production in total. We have become the world’s largest producer of natural gas and now anticipate that we will become a net exporter of LNG in 2016 and an overall net exporter of natural gas by 2018.

Our relations and interests in the Middle East have always been and will continue to be strong, multifaceted, deep, complex, and strategic. We live in an international global economy with interdependent energy markets, and even if all products we at home consume would originate beneath our own soil and oceans, we would still not be ‘‘independent.’’ A disruption anywhere in the world would have consequences everywhere, including here at home. The American economy is intricately linked to the global market, and we are dependent on the prosperity of others, as they are on us.

Developing frontier resources is a risky and capital-intensive undertaking, and companies will be deterred from making necessary investments if they believe that risk is too high. When investments can be made in places like North Dakota with little or no political risk, it becomes very difficult to convince boards of directors to approve investment in high-risk areas. In North Africa, Algeria is pursuing the next phase of development in its oil and gas fields and producing from its offshore and unconventional resources, but it has to get that investment climate right for that to work and to encourage companies to come and invest.

Mr. HOCHSTEIN. From an economic perspective, two LNG facilities in Egypt that are basically running dry at the moment because Egypt has taken all its gas destined for exports and using it for domestic, it makes sense, if you have the infrastructure already built and the capital investment is there, to use that. Can the geopolitics manage it is the next question. On Turkey, there are only two ways to get a pipeline from offshore Israel to Turkey. One would have to go through the EEZ of Lebanon and Syria, which is less than likely at the moment, or go through the EEZ of Cyprus. So for that there are other geopolitical hurdles that have to be reached. I think we have to sometimes take a step back from enormous amount of statements and conferences and books that are being written about the potential and agree on one thing. The cooperation in the Eastern Mediterranean, energy is a huge boost for that, and that is the way that this region will monetize and capitalize on these new resources. But it is going to take a lot of work and it is going to take a lot of effort and creative thinking to be able to get there.

Condensates are not oil, they are not crude oil, and that is why we don’t count them together. They are a liquid product that you get when you extract natural gas. Some countries are importers of condensate only and they don’t import crude oil, and they use it because they need it for the refining in gasoline, to create gasoline, when they are using crude oil from something else. Some countries develop gas that is very dry gas. Israel is a good example. Their gas doesn’t include much condensate. The United States has a lot of condensate in our gas.

Mr. HOCHSTEIN. Unfortunately, as I said in my testimony, I think that the term ‘‘independent’’ that is used often, in my opinion misused often, in natural gas we are becoming self-reliant and we have become a net exporter. In oil, we are still an importer. But even if we were not, if there was a crisis anywhere in the world that created a major disruption, whether it was a national security disruption, such as a closure of a strait, or a natural one, if Macondo in the Gulf Coast happened in the Persian Gulf, that would have a significant impact on the global markets. Any impact such as those on the global markets will have the same impact here at home. Even if we are producing all that we consume here, you will still have a price shock in the United States. We are an integrated market, and oil and gas are commodities.

Mr. YOHO. Is there a way to mitigate that or soften that if we were to team up with Canada more and Mexico to where we could supply this region that would be more isolated from a world market? And I understand we are all tied together, but it seems like it would soften that more. Because every time we see a spike in gas prices diesel goals up, everything on the shelves of the grocery stores goes up. Is there were a way, if we were to team and have a consortium between Canada and Mexico, the North Americas, to where we supplied the demand for our continent, in this region, we would be less affected by Middle Eastern conflicts.

Mr. HOCHSTEIN.  Condensates are not a crude oil or a product of crude oil. They are a product of natural gas. They are a liquid product of natural gas. They are exported mostly separately and occasionally they are exported together with crude oil. That does not make them the same product.

Mr. WEBER. Coming from Texas, LNG, lots of Petro-Tex Chemical in my district. Liquid gas, ethanes, propanes, propylenes, methanes, products that are used to produce plastic products. And that has ramifications for plastic explosives, by the way.

Mr. CONNOLLY. Could you talk a little bit about how does the growing independence, the growing self-reliance, because of a huge exponential increase in domestic production here in the United States, how does that shift affect your job? I mean, when we look down the road, how will U.S. energy policy in the Middle East be different, say, 15 years from now, 10 years from now than it is today? Clearly, that has got to have some impact in our relations in the region with respect to energy policy.

Mr. HOCHSTEIN. Without a doubt, we are in a new world, not only around the world, but in the United States. And as we look to transition from a major consumer to an exporter, that changes not only the dynamic of our own energy economy at home, but the position that we have broadly and globally.

I think that people are drawing the wrong conclusions from that, as you have heard around in the media and even today in this hearing, that we are somehow changing or reducing our engagement in the Middle East. As I said before, nothing could be further from the truth. We have very complex and strong relations in the Middle East and they will continue. But that is true globally. What we can do, what we are in the position to do today, in the years to come as we become an exporter, is think about how that provides part of the answer to some of the questions that we are seeing playing out. We would like to see a world where no country is reliant on a single source of energy. And if we can be helpful in diversifying the energy mix for countries and sources, I think that will benefit not only those countries, but our own national security and global economic security. And that is true whether we are talking about Europe or whether we are talking about nearer to home in Central America and the Caribbean. The reliance on a single source creates great political difficulties, as we have seen played out over the last 3 months, and the United States is going to be part of that as we start exporting.

Mr. CONNOLLY. Okay. A noble goal, and I am thinking of Turkey as an example as I think I said in my opening statement. But, so what does that mean? Does that mean the United States is going to try to help build alternative pipelines? Does it mean the United States is going to find alternative shipments, LNG, or whatever it may be to try to assist these countries to diversify and lessen their reliance on sole or primary sources of energy?

Mr. HOCHSTEIN. We have and will continue to strengthen our work with countries to identify what other kind of infrastructure and mechanisms within their own regulatory systems that would allow and to ease that pressure and to make them more secure.

Mr. WEBER.   In Texas we have lots of LNG and lots of oil obviously. Things are just bigger and better in Texas, and so we are very honed in and keen on energy and the kinds of benefits that it gives to our country and I would say internationally. With the current prevailing attitude that somehow fossil fuels are bad, and I want to make the distinction that I understand the difference between petroleum products, as I kind of laid out, and natural gas products. We see natural gas products, as you know, in plastic bags, plastic bottles, as I say even plastic explosives they have raifications.


Mr. WEBER. But they do make money by exporting things, those liquids, those ethanes, methanes, propylenes, propanes, everything that we named, they are able to make money when they export that stuff to help underpin their economy. True or not?

Mr. HOCHSTEIN. No.

Mr. WEBER. How is that? They sell those products and they don’t get paid for them?

Mr. HOCHSTEIN. They get paid into accounts that are in banks in foreign countries.

Mr. WEBER. The assets are frozen?

Mr. HOCHSTEIN. The assets then can only be used in very restricted ways and cannot underpin their economy.

Mr. WEBER. Do you think that if America becomes totally energy independent, self-sufficient, it makes for better international security around the world?

Mr. HOCHSTEIN.   I do think it would enhance security, yes.


Posted in U.S. Congress Energy Dependence, U.S. Congress Energy Independence, U.S. Congress Energy Policy | Tagged , | Comments Off on U.S. House hearing on how to get Central Asian oil before Russia and China do, 2006

The electromagnetic pulse EMP Threat: House of Representatives hearing 2005

[ Related articles:

Alice Friedemann   www.energyskeptic.com  author of “When Trucks Stop Running: Energy and the Future of Transportation”, 2015, Springer and “Crunch! Whole Grain Artisan Chips and Crackers”. Podcasts: Practical Prepping, KunstlerCast 253, KunstlerCast278, Peak Prosperity , XX2 report ]

Some notable statements from the hearing:

George Baker, Professor Emeritus, James Madison University:

  • I’ve been to some EMP meetings in Britain, where they actually are protecting their grid. I heard a member of Parliament say it’s 3 days to total anarchy once you lose the electricity.
  • “The long-term term effects without the electric power grid, we’re talking about certainly within a year, you would lose at least half the American population. I have seen estimates as high as 90% of the American population would be at risk over a projected 1-year period”.
  • “Although EMP does not affect every system, widespread failure of limited numbers of systems will cause large-scale cascading failures of critical infrastructure systems and system networks because of the interdependencies among the failed subsystems and the interlinked electrical/electronic systems not directly affected by the EMP”

PETER VINCENT PRY, Executive Director, Task force on National and Homeland Security:

  • What we must understand about the threat is that it is not merely theoretical, it is a real [asymmetrical] threat. The military doctrines of Russia, China, North Korea and Iran call for a Blitzkrieg combining nuclear weapons, cyber-attack, and physical sabotage.  Failed states like Iran or North Korea [or terrorists] could theoretically defeat and destroy a highly advanced society like our own [in such an asymmetric attack].
  • “There are 2,000 extra high voltage transformers that are basically the technological foundation of our electronic civilization. They are vulnerable to EMP. They should be protected. We don’t even make them in this country anymore”.

Mike Caruso, Director of Government and Specialty Business Development ETS-Lindgren.

“It is my sincere belief that we, as a nation will someday, in the not too distant future, face an EMP attack.  I have lectured and given workshops in both South Korea and Israel where they are certain that they will face an EMP attack and they are taking very active steps towards protection. I urge you to consider and pass legislation to address the EMP threat that I believe has been overlooked for far too long”.

Alice Friedemann   www.energyskeptic.com  author of “When Trucks Stop Running: Energy and the Future of Transportation”, 2015, Springer and “Crunch! Whole Grain Artisan Chips and Crackers”. Podcasts: Practical Prepping, KunstlerCast 253, KunstlerCast278, Peak Prosperity , XX2 report ]

House 114-42. May 13, 2015. The EMP Threat:  the state of preparedness against the threat of an electromagnetic pulse (EMP) event.  House of Representatives. 94 pages.

Ron DeSantis, Florida, Chariman subcommittee on National Security. The state of preparedness against the threat of an electromagnetic pulse is the subject of today’s hearing. An electromagnetic pulse could be created through an attack from a missile, nuclear weapon, radio frequency weapon, or geomagnetic storm caused by the sun. Fallout from an EMP event, either man-made or natural, could be extremely significant ranging from the loss of electrical power for months, which would deplete energy sources of power such as emergency batteries and backup generators have cascading consequences for supplying basic necessities such as food and water, and result in loss of life.

The electrical grid is necessary to support critical infrastructure, supply and distribution of food, water, and fuel, communications, transportation, financial transactions and emergency and government services. Significant damage to the electrical grid during an EMP event would quickly and significantly degrade the supply of these basic necessities.

EMPs can also be caused by solar storms, also referred to as geomagnetic disturbances, which are basically an everyday occurrence, they just doesn’t always hit the Earth. Two significant storms that did enter the earth’s atmosphere occurred in 1859 and 1921, respectively. Given the limited use of electricity in the mid-19th and early 20th centuries, the impact on society was relatively minimal. Today however, society depends heavily on a variety of technologies that are vulnerable to the effects of intense solar storms.

Scientists predict that these storms impact the Earth once every 100 to 150 years. So it’s not a question of if, but a question of when.

The occurrence today on an event like the 1921 storm could result in large scale and prolonged blackouts affecting more than 100 million people. The National Academy of Sciences estimates the cost of damage from the most extreme solar weather at $1 to $2 trillion with a recovery time of 4 to 10 years. The cost from even short-term blackouts are significant.

In July of 1977, a blackout in New York that lasted only one day resulted in widespread looting and the breakdown of law through many New York neighborhoods. The blackout cost approximately $346 million and nearly 3,000 people were arrested during a 26-hour period. In August of 2003, more than 200 power plants shut down as a result of the electricity cut off caused by cascading failure. The blackout affected Ohio, New York, Maryland, Pennsylvania, Michigan and parts of Canada. Although relatively short in duration, the blackout’s economic cost was between $7 billion and $10 billion due to food spoilage, lost production, overtime wages and other related costs.

The Department of Defense recently decided to move the North American Aerospace Defense Command, NORAD back inside Cheyenne Mountain in Colorado because the mountain is EMP hardened and would allow the military to sustain communications and homeland defense operations despite an EMP event.

Not only is the Federal Government still operating under sequestration, but unfortunately, Congress recently passed a budget blueprint that contemplates cutting non-defense spending, including our Homeland Security budget that could be helpful on this issue by nearly $500 billion below sequestration level spending caps.

While government officials, scientists and other experts may disagree on the imminence of Electromagnetic Pulse event, the EMP Commission established by Congress in 2001 to assess the threat of an EMP attack reported that our national electric grid and other U.S. Critical infrastructure could be significantly disrupted by a sudden and high-intensity energy field burst. Now as the chairman noted, this could be large in scale and produced by nuclear explosion, it could also be created through the use of batteries, reactive chemicals and other nonnuclear devices, or be the product of a natural magnetic storm.

Dr. George Baker, Professor Emeritus at James Madison University and CEO of BAYCOR.  I see three reasons why we are not making progress at present on these. The first is there are many misconceptions about EMP and GMD threats.

  • Only major nuclear powers, such as Russia and China with high- yield thermonuclear devices could effectively execute an EMP attack. In fact, low yield devices obtained by emerging nuclear powers such as North Korea and Iran can produce catastrophic EMP effects.
  • A nuclear EMP attack would burn out every exposed electronic system. In fact, based on government tests, we know that smaller self-contained, self-powered systems such as vehicles, handheld radios, disconnected portable generators are often not affected.
  • EMP effects on critical infrastructure will be limited to non-severe, nuisance-type effects. In fact, wide area failure of just a few systems, could cause cascading infrastructure collapse, in highly interconnected networks. One example is the 2003 electric blackout of the northeast was precipitated by a single high-voltage line touching a tree, and then proceeded to cascade to the entire northeast.

So, when you extend this concept to a wide area of failures and infrastructure networks, including the Internet, you can see that EMP is an existential threat that we must take very seriously.

A recent cost study by the Foundation for Resilient Society shows that significant EMP protection could be achieved for an investment in the range of $10 to $30 billion.

But we aren’t making progress because the stakeholders are in a state of denial. Concerns about cost makes stakeholders, the government and the private sector reluctant to admit EMP vulnerabilities. Actions to date have been limited and ineffective. An example is the joint effort of the Federal Energy Regulatory Commission, that is, FERC, and the North American Electric Reliability Corporation, that is NERC, to set reliability standards for wide area electromagnetic impacts on the electric grid.

The NERC-developed and FERC-approved standards that we have exclude nuclear EMP, despite the opportunity to protect against both GMD and EMP using the same equipment. NERC standards rely on operational procedures that require no physical protection of the electric grid. The largest measured storms are a factor of 10 higher than their benchmark for protection. A sceptic might suspect that NERC’s main objective was to avert liability rather than to protect the American public.

Another reason we aren’t making progress is there is no one in charge. There’s no single point of responsibility to develop and implement a national protection plan. When I ask NERC officials about EMP protection, they informed me we don’t do EMP, that’s DOD’s responsibility. The Department of Defense tells me, EMP protection for civilian infrastructure is DHS’s responsibility. And then when I talk to DHS, I get answers that the protection should be done by the Department of Energy, since they are the infrastructure’s sector-specific agency. So we have EMP and GMD protection as finger-pointing exercises at present.

PETER VINCENT PRY, Executive Director, Taskforce on National and Homeland Security.

Also see Pry’s full testimony here: The EMP Commission estimates a nationwide blackout lasting one year could kill up to 9 of 10 Americans through starvation, disease, and societal collapse

What we must understand about the threat is that it is not merely theoretical, it is a real threat. In the military doctrines of Russia, China, North Korea and Iran, they plan to make a nuclear EMP attack against the United States. We have seen North Korea and Iran exercise this, including by launching ballistic missiles off of a freighter at sea, which would enable the possibility of an anonymous EMP attack.

During the nuclear crisis we had with North Korea in 2013, it was the worst nuclear crisis we ever had with Kim Jong Un was threatening to make nuclear missile strikes against the United States in the aftermath of their third illegal nuclear test.  In the midst of that crisis North Korea orbited a satellite over the south pole that passed over the territory of the United States on the optimum trajectory and altitude to both evade our national missile defenses, and, had that been a nuclear warhead, to place an EMP field over all 48 contiguous United States that would have had catastrophic consequences. That was the KSM 3 satellite; that satellite stills passes over us, it’s still in orbit and passes over us with regularity.

Another thing that must be understood is that EMP is part of their military doctrine that they consider a revolution in military affairs, a combined arms operation with cyber-attacks, physical sabotage, nonnuclear EMP weapons, and nuclear EMP weapons all used together and coordinated in a new Blitzkrieg, except one that’s waged in cyberspace to basically bring a civilization down to its knees so that a failed state like an Iran or North Korea could theoretically defeat and destroy a highly advanced society like our own.

This would be unprecedented in history where you would have a situation where a state like Iran or North Korea or even a sub national actor like a terrorist group if they could get hold of that one nuclear bomb and do it in combination with cyber-attacks and physical sabotage to crash our critical infrastructures, especially the electric grid and basically destroy our civilization. But they write about it; they exercise it; they are serious about it. And we actually see this being practiced in real life in some countries back in June of last year while ISIS was sweeping over northern Iraq, al Qaeda and the Arabian Peninsula blacked out the entire electric grid in the state of Yemen, put 18 cities and 24 million people into the dark.

That is the first time in history that a terrorist group has blacked out a whole country. And it so destabilized Yemen that look what happened to them. They have gone from being a U.S. ally, so now we have lost one of our most important allies in the Middle East already to this kind of an attack.

On January 25, 2016 a terrorist group blacked out 80% of the grid in Pakistan. We don’t know what they are up to, but Pakistan is a nuclear weapons State. So the idea that 80% of the grid could be blocked out in Pakistan for purposes unknown is extremely disturbing.   Was it an attempt to get their hands on nuclear weapons in Pakistan?

About a week before the Washington blackout happened, 80 percent of Turkey was put into blackout by a cyber-attack by Iran. These were not EMP attacks, but they are experiments of the doctrine to combine all these things and we have seen in the case of North Korea and Iran experiments with the nuclear EMP option as well.

The greatest progress we made in this country was when the EMP Commission was around and, you know, with the absence of the Commission, well we have seen that no progress has been made.

And last, the NERC/FERC relationship, I completely agree with Dr. Baker. It’s extremely dysfunctional, it doesn’t work. It needs to be reformed. I’m not sure that you can actually reform those institutions. I would actually advocate abolishing both FERC and NERC and starting with something else, a different kind of institution, something similar to the Nuclear Regulatory Commission that has real regulatory power, and that understands that its stakeholder, its customer is not the electric power industry first, but it’s the American people first. And the responsibility is first not to the profits of the utilities, but it’s to America’s national security.

George Baker, Professor Emeritus, James Madison University, CEO of Baycor.

I’ve been to some EMP meetings in Britain, where they actually are protecting their grid. I heard a member of Parliament say it’s 3 days to total anarchy once you lose the electricity.

Although EMP does not affect every system, widespread failure of limited numbers of systems will cause large-scale cascading failures of critical infrastructure systems and system networks because of the interdependencies among the failed subsystems and the interlinked electrical/electronic systems not directly affected by the EMP.

The electric grid is the foundation for all other infrastructures. DHS has listed 16 critical infrastructure sectors, and the one sector that drives everything else is the electric power. The other thing about the electric power, it is the most critical infrastructure, and yet the most vulnerable to EMP because you measure EMP in volts per meter, so the longer the line, the larger the voltage it will be induced on the line. So it is ironic that our most critical infrastructure is also the most vulnerable, and that’s why we have to be so serious about protecting the grid. But without the electric grid, basic life services: The ability to pump drinking water, the ability to heat and cool our homes

I’ve been to some EMP meetings in Britain, where they actually are protecting their grid. I heard a member of Parliament say it’s 3 days to total anarchy once you lose the electricity.

Although EMP does not affect every system, widespread failure of limited numbers of systems will cause large-scale cascading failures of critical infrastructure systems and system networks because of the interdependencies among the failed subsystems and the interlinked electrical/electronic systems not directly affected by the EMP.

Moreover, for many systems, especially computer controlled machinery and unmanned systems, upset is tantamount to permanent damage ¡V and may cause permanent damage including structural damage in some cases, to systems due to interruption of control. Examples include:

  • Upset of generator controls in electric power plants
  • Upset of robotic machine process controllers in manufacturing plants
  • Lockup (and need for reboot) of long-haul communication repeaters
  • Upset of remote pipeline pressure control SCADA system


Mr. DESANTIS. And in terms of the some of the casualties, because people have surmised  that if terrorists can get their hands on a nuclear device, detonate an American city, obviously that would be very devastating. And someone said, yes it would be, but their best bet to do the most damage would be to try to launch it over the country and explode it and create an EMP. And the casualty estimates I’ve seen are really, really high if they were able to cripple our entire electrical grid. Is that your understanding that you are talking about potentially millions of people?

Mr. BAKER. That’s my understanding. The long-term term effects without the electric power grid, we’re talking about certainly within a year, you would lose at least half the American population. I have seen estimates as high as 90 percent of the American population would be at risk over a projected 1-year period.


Mike Caruso, Director of Government and Specialty Business Development ETS-Lindgren.

It is my sincere belief that we, as a nation will someday, in the not too distant future, face an EMP attack.

I have lectured and given workshops in both South Korea and Israel where they are certain that they will face an EMP attack and they are taking very active steps towards protection. I urge you to consider and pass legislation to address the EMP threat that I believe has been overlooked for far too long.

In addition to critical infrastructure, I’ve hardened military and government facilities for 32 years.  What’s required to harden a facility is to create a 6-sided electromagnetic shield around the equipment that’s intended to be protected. The six-sided metal shield has to be constructed so it basically has no openings in it except those that are absolutely necessary to have. And all of those openings are technically considered to be points of entry. So you start out by building a six-sided metal box with no openings, and then you start adding openings for things like the electrical power, communications and air exchanges and cooling systems. And all of those points of entries are handled in a very, very special and particular way in order to ensure that you are attenuating any EMP signal that might be broadcast in the atmosphere, but also any signals that are being brought in, conducted on the electrical lines or communication lines. A surge protector on steroids.

Eighteen states have ongoing initiatives to require electric utilities to address the protection of the electrical grid from the dangers of an EMP or a solar storm. Electromagnetic energy from an EMP can disrupt Supervisory Control and Data Acquisition (SCADA) systems on which the electrical grid relies. The States currently taking a proactive stand are: Alaska, Arizona, Florida, Kentucky, Maine, New Hampshire, New York, North Carolina, Colorado, Indiana, Louisiana, New Mexico Oklahoma, South Carolina, Texas, Utah, Virginia and Washington. I have recently testified at the Texas State House in support of Bills introduced by State Representative Tan Parker, State Representative Tony Tinderholt and State Senator Bob Hall. Texas is aggressively pursuing passage of EMP Legislation including a State appropriation to get Critical Infrastructure Segments started in the evaluation process. To my knowledge, there are only three Electric Utilities in the U.S. that have taken steps in hardening their Operational Control Centers and Substation Control Buildings. I am prohibited by non-disclosure agreements, from directly identifying their names or locations. However, I can discuss the hardening process and costs of a recently completed facility.


Mr. DESANTIS. What percentage of the electrical grid is prepared for an EMP threat?

Mr. CARUSO. Currently, there’s only one control center in the entire country that I’m aware of that is protected.


Stephen F. Lynch, Massachusetts. What we’re saying here is that because of the interconnectivity of our society today, the great reliance and connectivity to the Internet, so much of every aspect of our lives is wired now, that that fact will actually amplify the impact of a EMP event. Is that basically what you’re saying, Mr. Baker?

Mr. BAKER. That’s right.  The only substantive response to the EMP recommendations has been within the Department of Defense, where they are actually providing an annual report to Congress on the steps they are taking to meet the EMP Commission recommendations. But as far as the civilian infrastructure, I’m not aware of any progress.


Mr. PRY.  There are 2,000 extra high voltage transformers that are basically the technological foundation of our electronic civilization. They are vulnerable to EMP. They should be protected. We don’t even make them in this country anymore.  The Commission had a rather long list of recommendations, basically a plan that could be implemented to protect the civilian critical infrastructure at affordable cost. It’s not hard to do, the technology isn’t the problem, the money isn’t the problem, it doesn’t cost that much to do it, it’s the politics that has been the problem. As George Baker has said, nobody has responsibility for doing this, those you would think would have responsibility,  such as the Department of Defense, for example. When you talk about it, DOD will say they have no jurisdiction over the civilian critical infrastructure, or that it could be caused by a geomagnetic storm and that’s not their department’s responsibility.  It’s a foreign threats, so that’s the Department of Homeland Security’s job. But DHS will say it is a nuclear weapon, that’s the DOD’s job. In the end, nobody has been in charge.

And then, where it counts the most, there is a very dysfunctional relationship between the NERC, the North American Electric Liability Corporation that represents the 3,000 utilities that is supposed to partner with U.S. FERC in providing for grid security. But the political reality is that that relationship is dysfunctional and it has not resulted in not only in increasing our security where EMP is concerned, but even against tree branch problems, for instance. It took NERC a decade to come up with a vegetation management plan to better manage tree branches so that we won’t have a repeat of the great Northeast Blackout of 2003. They are falling down on job on very pedestrian threats, let alone cyber threats and EMP attacks and the like. It’s just the system isn’t working, and that needs to be fixed by somebody.

CYNTHIA M.  LUMMIS, Wyoming, Chairman of the subcommittee on the Interior.   Dr. Pry [you say] the relationship between NERC and FERC is dysfunctional. You mention the possibility of doing away with both. So if you were dictator for a day, and you could do exactly that, either combine NERC and FERC or do away with them and replace them with something else that would solve the dysfunction you’ve identified, as well as address this electromagnetic pulse issue responsibly, what would that look like?

Mr. PRY. That would look like the kind of relationship that the Federal Aviation Administration has with the airline industry. What I think isn’t understood is that the electric power industry is the only critical infrastructure that still operates basically in something that’s close to a 19th century regulatory environment. The Federal Aviation Administration has the power and has independent inspectors. If they find metal fatigue in the wings of an airline, they can ground that whole fleet and order the airline industry to not fly those planes until they are fixed. When there is a disaster and an airplane crashes, the industry doesn’t get to investigate and figure out what went wrong, not by themselves. It’s the Federal Aviation Administration that drags those things into a hangar. And why do we do that? Because we want an objective actor whose first priority is public safety, because hundreds of lives are at stake when airplanes fly and so we don’t take lightly the lives of the American people when it comes to that. If we go to the Food and Drug Administration or any other industry, I would like that same kind of regulatory relationship with the electric power industry.

Let me describe to you a little bit about what the current regulatory environment is like, because it’s not really what we would consider a regulatory environment. The U.S. FERC does not have the power to tell NERC — the industry — what they shall do to protect the grid. It can order them to come up with a plan and then NERC can take as much time as it likes to come up with a proposed plan. And then if the U.S. FERC has objections that plan, the whole plan has to be scrapped, and the process starts all over again.

That’s why it took 10 years to get a plan for vegetation management so we wouldn’t have a repeat of the great Northeast Blackout of 2003. Industry takes its time dragging its feet and can use the process to escape doing what it’s supposed to do. NERC is supposed to partner with the U.S. FERC in providing for the security of the American people, but it doesn’t.

And I don’t think combining them or keeping the same will work.  There are some good people in these institutions, where George and I have served on NERC’s Geomagnetic Disturbance Task Force.  But while we were there, we saw them engage in junk science, dishonest practices in terms of the science to try to mislead people. In my written testimony, I describe a very disturbing example of where the NERC came up with a hollow standard for the natural EMP created by the sun.  They were dragged, kicking and screaming and resisted for years said that the threat from the sun does not affect the electric grid, which was completely untrue. Eventually they were forced to come up with a standard, but the standard is so low that it doesn’t provide any real protection.


BRENDA L. LAWRENCE, MICHIGAN.  This issue is one of great importance to me and to our country. The congressional EMP Commission issued a report in 2008 identifying 16 segments of our infrastructure that could suffer severe damage if not protected. Today, 7 years later, the testimony continues to echo those concerns. Has anything changed since this last report regarding the protection of the grid?

Mr. CARUSO. I don’t believe anything significant has changed.   I have worked with several financial institutions, including insurance companies. I’ve worked with electric utilities and have done some work counseling, the gas and electric industry as well, but other than that, nothing real significant has happened. My recommendation really falls in line with those of Dr. Pry and Dr. Baker in that someone needs to be in charge, and especially as it’s related to the 16 critical infrastructure segments in terms of providing real protection, and at least addressing the issue to ask the question what if, what happens if we lose the electrical power?  I like to use the example of the waste treatment systems. You would not only lose the electrical power, but the control systems that control the wastewater filtration and pumping stations throughout an area. If that goes down in a major city, you have 2 or 3 days before the city is just on its knees.


JODY B. HICE, GEORGIA. Dr. Pry, what Federal agency do you believe is best suited to lead a preparedness effort for this? Is it Homeland Security? Is it Energy?

Mr. PRY. I think the Department of Homeland Security, that it naturally falls under their jurisdiction because they’re supposed to be responsible for critical infrastructure protection in the first place.  Since DHS and the Department of Defense are also supposed to have a cooperative relationship when it comes to providing for homeland security, DHS should have the lead, but there’s a lot of expertise in the Department of Defense. And the Department of Defense is also dependent on the civilian critical infrastructure.


TED LIEU, CALIFORNIA.  Let’s say an EMP device was exploded over the U.S. What is the geographic area that it would affect? Is it the size of D.C.? Of Maryland? Of Virginia? Smaller? Larger?

Mr. BAKER. A low-yield weapon, if it’s detonated at the optimum altitude would affect a circle with a diameter of 1,200 miles.

Mr. LIEU. And then, based on the way our electrical power grid is constructed in the U.S., could you take power from another part of the country and route it through the affected area?

Mr. BAKER. That would depend upon the size of the circular diameter. It would be difficult to do that because you’re looking at areas that are crossing, you know, State boundaries and the boundaries of the different power companies.  It could be difficult. And we don’t have grid control centers in most cases that span that large of an area.


Mr. LIEU.  To harden the United States to a place you think is sufficient, are we talking about $50 million, $50 billion, $500 billion?

Mr. PRY. It depends on how much protection you want to buy.  It’s sort of like asking how much will it cost to buy fire protection for my house. Some plans are very inexpensive. It can be as simple as buying a smoke alarm which would cost you very little. Others might want to put a fire extinguisher in every room and put a sprinkler system in, which is going to cost a lot.

John Kappenman, who was on our commission, had a plan, that would cost $200 million that would protect the 200 most important extra-high-voltage transformers, the ones that service the major metropolitan areas.   John wouldn’t say this was adequate, but would give you a fighting chance of saving millions of people from starving to death, because the transformers would be saved.

The EMP Commission had a more ambitious plan that cost about $2 billion to protect all of the transformers and generators.  It was a much better plan and would give you much greater resiliency and confidence in being able to recover society quickly from an EMP.

George Baker had an even better plan that went beyond that.

It sort of depends on how much do you want to put into prevention. Just like in protecting your house, you can spend more money to protect your house and be safer, or you can decide to spend less money and be less safe.


Mr. DUNCAN. I’m glad to hear that some States are taking individual initiatives. I hope that keeps growing.

Mr. PRY. But it is harder to do when NERC claims they’ve adopted a GMD standard and not to worry about it, they’re on top of the problem, which they also say about cyber and things like that, which is not true. And that takes away the incentive for States to protect themselves when NERC convinces them that they are already solving the problem. And I’d like to make one last statement, because you asked if are we getting more vulnerable. We are getting more vulnerable all the time because of the advance of technology.  Just as our semiconductor technology gets better and faster and runs on lower voltages, it becomes more and more vulnerable to the EMP effect, which is why we’re so vulnerable now.

Back in 1962, Starfish Prime test, when that happened, the vacuum tube technology of the day was 1 million times less vulnerable to EMP. Still, the lights went out in Hawaii even though they were 1 million times less vulnerable. About every 10 years we have a 10-fold increase in the capabilities of our semiconductor technology. That makes us 10-fold more vulnerable to EMP. So this problem is getting worse and worse. It’s not just standing still while we do nothing.


Mr. DUNCAN.  We over sensationalize a lot of these threats because of a 24-hour news cycle and because so many people in companies make money off of threats that are exaggerated. But, in my opinion, this is one that’s not being exaggerated and that we need to do a little bit more. And I appreciate what you all are trying to do.


Mike Caruso. In 2014, ETS-Lindgren was part of a multi-disciplinary team that successfully completed construction of the first large, private-sector SCADA facility in the United States that includes EMP protection. The building is a new-construction, 2-Story 105,000 square foot concrete tilt-up building with:

  • 44,000 square feet of EMP protected space
  • Emergency generators and cooling systems protected
  • Approximately 40 to 60 occupants in the protected space „h Approximately $50MM building construction cost (building only)
  • Total project cost approximately $100MM (including equipment)
  • Approximate EMP Protection cost $8MM (including additional subcontract costs)
  • EMP protection was1-year on-site (concurrent with general construction)
  • Average additional ¡§total project costs¡¨ of 8% ($182.00/sqft)
  • 2 million homes and businesses served
  • 5,000 square-mile service area
  • Less than $1.00 per year per customer (spread over 5-years)
  • Performance certified by Little Mountain Test Facility (U.S. Air Force, Hill AFB)

While the optimum scenario is to include EMP protection in a new building, retrofitting existing buildings for EMP protection is somewhat more complicated and costly, but certainly achievable. I recently led a five-man team in an evaluation of two control centers (primary and back-up) for an electric utility in a major U.S. City. I am prohibited, by non-disclosure agreements, from directly identifying their names or locations. As you might imagine, existing facilities have legacy equipment and systems that were never intended to be EMP protected. This condition makes these facilities tremendously vulnerable to EMP. The existing interconnecting wiring, conduits and mechanical systems provide excellent pathways to conduct the EMP directly to the critical equipment. Therefore, a comprehensive evaluation of the facility must first be conducted to identify the “must have” functionality and equipment in the case of an EMP event. As an example, in this case, it was determined that the large system display board did not have to remain operational because the individual operators would be able to see their sector status on their individual monitors. Therefore it was only necessary to address the protection of the individual stations and a cost savings could be realized. The most critical equipment must be grouped and isolated in individual interconnected enclosures to accommodate functionality. In addition, the existing back-up power systems, cooling systems and communication systems that support the critical equipment must be protected. In some cases this will involve creating new dedicated support systems due to the complexity of the existing systems.

The estimated Rough Order of Magnitude (ROM) costs for retrofitting an existing facility of a similar size as the previously discussed new-building is:

  • 44,000 square feet of EMP protected space
  • Emergency generators and cooling systems protected
  • Approximately 40 to 60 occupants in the protected space
  • Approximately $10MM building construction cost (building only)
  • Total project cost approximately $26MM (including equipment)
  • Approximate EMP Protection cost $16MM (including additional subcontract costs)
  • EMP protection 18 to 24 months on-site (concurrent with general construction)
  • Average additional “total project costs” ($364.00/sq ft)
  • 2 million homes and businesses served
  • 5,000 square-mile service area
  • Less than $2.00 per year per customer (spread over 5-years)

While, in my opinion, EMP protection of electric utilities is the primary concern, due to the survival dependency we have on electrical power, all other segments of our nation’s critical infrastructure must be addressed. Some proactive forward thinking electric utilities have either instituted EMP protection programs or have at least begun to consider implementing protection. However, critical infrastructure segments such as; financial, waste water, drinking water, transportation, food distribution, healthcare and emergency services have not.


George Baker, Professor Emeritus, James Madison University, CEO of Baycor

The costs to protect roughly the transmission and distribution system and half of the U.S. generation capacity are provided in the table below:

Resilient Societies Cost Projections

  • Electric Generation Plants $23,0000M
  • Electricity Transmission & Distribution $2,300M
  • Electric Grid Control Centers $1,390.M
  • Telecommunications $1,480M
  • Natural Gas System $640M
  • Railroads $1,380M
  • Blackstart Plant Resiliency $80M

TOTAL $30,270M

Using the $30,270 bottom line EMP and GMD protection cost estimate and a levelized annual revenue requirement of 20% ($6B), assuming there are ~150 million rate payers in the United States, the estimated annual cost per rate payer would be $3.30 per month. There are strong arguments for protecting selected subsets of the grid. For example, a top priority to ensure situational awareness following a GMD or EMP event would be to protect major grid control centers. Estimates to protect these are in the $1.4 billion ballpark. If a Phase 1 EMP/GMD program operated in 2016-2020 at a five year cost of $1.4 billion, or $280 million per year, and all the extra costs were passed through to retail customers, the extra cost would be approximately $0.16 per electric customer per month.

We also might put priority on ensuring the survivability of major grid components that would take months to replace –or years if large numbers suffer damage. A primary example would be high voltage transformers which are known to irreparably fail during major solar storms and are thus also vulnerable to failure during an EMP event. Protection of these large transformers would save valuable time in restoring the grid and the life-support services it enables. The unit cost for HV transformer protection is estimated to be $350,000. The total number of susceptible units range from 300 – 3000 (further assessment is required to establish an exact number.) Doing the math, the protected cost for protecting 3000 of these longest replacement lead-time components of the grid is $ 1 billion – a small fraction of the value of losses (Lloyds of London estimates are in the trillions of dollars2 for GMD alone) and long-term recovery costs should they fail.

Stakeholder Reluctance.

Concern about costs and liabilities makes stakeholders in government and the private sector reluctant to admit vulnerabilities. A major impediment to action on protecting the grid against GMD and EMP effects has been that government and industry are (understandably) swayed by the familiar, the convenient, and the bottom line. Like it or not, familiarity and profitability are the touchstones of acceptability – strategic advantage goes to the convenient. Thus, the tendency exists to downplay the likelihood of EMP and GMD and their associated consequences. The prevalent misconceptions (factor 1) have also contributed to stakeholders’ ability to downplay the seriousness of EMP and GMD effects to avoid action.

In cases where stakeholders have decided to take action to improve infrastructure survivability, the actions have been limited and ineffective. A primary case in point is the NERC effort to set reliability standards for wide-area electromagnetic effects. Responding to FERC’s inquiries for protection standards, the NERC formed a GMD task force. When several task force participants asked why EMP could not be part of the task force deliberations, NERC leadership explained that EMP was a national defense concern and therefore not their responsibility – rather that DoD should take the lead.

The standards ultimately developed by NERC include a set of operational procedures requiring no physical protection of the electric grid and a scientifically-flawed benchmark GMD threat description that enables most U.S. utilities to avert installing physical protection based on their own paper modeling studies. The benchmark GMD threat description is based on solar storm statistics over the last 25 years during which there were no “Carrington Class” 100-year solar superstorms. The Carrington-class storm GMD levels are an order of magnitude higher than the largest storms in the NERC 25 year data window. NERC’s benchmark event is admissible only if we assume that all eleven-year solar cycles are the same, an assumption known to be incorrect. A skeptic might suspect that the NERC standard’s main objective was to avert liability rather than protect the public from serious GMD consequences.

The outcome of the NERC operational procedures standard, now approved by FERC, is that the public will not be protected from EMP and the industry will deal with GMD effects using operational work-around procedures such as shedding load and spinning up reserve generation capacity. The operational procedure-based solutions that have been offered by NERC in their recently adopted EOP-010-01-1 standard are ineffective for a number of reasons. A non-exhaustive list of ten pitfalls accompanying reliance on operational procedures to protect the electric power grid follows.

  1. GMD operating procedures are based on the premise that operators can and will prevent large-scale grid collapse by shedding load. Due to insurance rules, grid operators will be reluctant to shed load to customers, even though load-shedding procedures reduce the probability of grid collapse and damage to EHV transformers. Utility companies know that if customer electric power is lost due to geomagnetic disturbance (GMD), they will not be liable for losses; but if customer power is lost due to intentional human action to deenergize the grid or portions of it, power companies can be held liable. (Reference the Lloyds of London report on GMD effects and liabilities and statements by insurance company representatives at 2012 Electric Infrastructure Security Summit at UK Parliament).
  1. The 15-45 minute warning time earlier provided by the Advanced Composition Explorer (ACE) satellite and now supported by the Deep Space Climate Observatory (DSCOVR) successor will be inadequate for grid operators to confer while executing required operational procedures. Participants in the 2011 National Defense University-Johns Hopkins University GMD response exercise indicated that they would be hard-pressed even to get all the players to the table within such a short time interval. And, once hit, the grid would fail quickly. We note that, in 1989, during a moderate solar storm GMD, the electric power grid of the entire Province of Quebec went dark in 92 seconds. The August 2003 Northeast Blackout evolved much more slowly (1:31pm – 4:10pm) with much more time available to take action. Nonetheless, even with a span of hours available, power companies were unable to react fast enough to prevent grid collapse.
  1. Grid operators will not have adequate information on the state of the grid to implement correct operational procedures. Because most of the grid is not monitored for Geomagnetically Induced Currents (GIC), operators will be “flying blind” with respect to the state of the grid. Operators will not know which portions need remedial action and what actions will be optimal. Information gaps will exist as in August 2003 – where operators were unaware of the initiating tree contact. Sensors needed to monitor GMD/EMP stressors on critical grid components were not required by NERC standards and have not been installed. And this lack of visibility has led and will lead to errors in executing operational procedures.
  2. There is no control center with large enough visibility to control operational procedure response on a national scale. Lack of information on neighboring interconnections impairs proper procedural response. A national control/coordination center does not exist. And in the Eastern Interconnection, there is no single authority over the nine American regional Reliability Coordinators. Because the geographic coverage of solar storm GMD and nuclear EMP can be continental in scale, super-regional control visibility and authority are necessary. At this point, only the federal government, using Presidential authority, can fulfill this role.
  1. Operational procedures have not been adequate to address the much simpler causes of previous large-scale blackouts. For instance, operational procedures proved ineffective in preventing the 2003 Northeast blackout that was precipitated by a single failure point – tree contact with a transmission line. Recent grid models indicate that GMD and EMP will cause hundreds to thousands of failure points. The complexity and rapidity of grid failure during a Carrington-class event will overwhelm the ability of electric utilities to respond and to prevent grid failure using any suite of operational procedures, no matter how wellconceived and practiced. During Hurricane Sandy, grid physical damage outstripped the effectiveness of procedural protection efforts. Physical damage to grid components will be a factor in GMD/EMP events as well.
  1. Unforeseen grid equipment malfunctions have greatly impaired grid operators’ ability to respond during major blackouts in the past. Operational procedures during the 2003 Northeast blackout were greatly impaired by computer control system malfunctions and software problems. Critical grid state monitoring, logging and alarm equipment failed. The control area’s SCADA and emergency management systems malfunctioned. The shut-down of hundreds of generators over multiple states was unanticipated as was the failure of tens of transmission lines. Confusion and inoperative control systems led to many frantic phone calls. As these events, show, any early failure of major grid components caused by the GMD or EMP environment will impede implementation of subsequent operational procedures.
  1. EMP and GMD will affect the communication systems necessary for coordination of operational procedures. Long-line internet and telecommunications networks will experience large overvoltages from GMD and EMP E1/E3 environments, likely causing their debilitation. GMD and EMP also impede signal propagation of HF/VHF/UHF radio systems and GPS systems. Thus grid communication and control systems necessary to execute operational procedures cannot be relied on – just when they will be needed the most.
  1. It is not possible to anticipate all grid failure point combinations and time sequences during GMD/EMP events in order to adequately plan, exercise, and test GMD/EMP operational procedures. Normal grid failures are not indicative of GMD/EMP failures. Operators are familiar with commonly occurring single equipment failures but when multiple points fail near simultaneously under GMD/EMP stress, and the failures interact and cascade, operators will have difficulty understanding and responding to prevent further damage. In most complex human-machine systems, the interactions literally cannot be seen. Prof. Charles Perrow of Yale defines ‘normal accidents’ in complex infrastructure systems as involving system interactions that are not only unexpected, but are incomprehensible for some critical period of time. For example, it took an expert NERC investigation team three months to determine the exact combination and sequence of system failures that led to the 2003 Northeast blackout.
  1. In the Eastern Interconnection, Regional Transmission Organizations (RTOs) and Independent System Operators (ISO’s) don’t have cross-jurisdictional authority to enforce shutdown of neighboring grids, sometimes required to avoid large scale blackouts, as in the August 2003 Northeast Blackout. There is no overall supervisor for the Eastern Interconnection. During the 2003 Northeast blackout, First Energy was asked to shed load by its neighboring grid operators but First Energy declined. According to the NERC afteraction report, load shedding would have prevented the ensuing Northeast blackout.
  1. Draft NERC GMD operational procedures recently approved by FERC (Order No. 797, June 2014) are not comprehensive and not specific. The plans generator operators and load balancing authorities from mitigation responsibilities. The NERC operational procedures also exempt portions of the grid operating below 200kV. In the August 2003 blackout, failure of 125 kV lines played a major role in the collapse of the Northeast grid.

The GMD operational procedures and solar storm benchmark event approved by FERC are ineffective and allow the electric power industry to continue with no significant upgrades to their physical assets, leaving the grid vulnerable to 100 year solar superstorms and EMP. It is worth noting that while GMD fields are more intense at northern latitudes, E3 fields increase at more southerly latitudes relative to the locus of a high altitude EMP event. Utilities that require no protection against GMD because of their southerly latitude under the newly operative standard would be experience higher E3 fields in the event of an EMP event than their northerly counterparts. The bifurcated “stove-pipe” threat approach being pursued to protect the electric power grid is cost- and outcome-ineffective. We need to develop a unified, all-threat approach to this challenge which leads to the third and final impediment to progress:


Posted in Blackouts, Blackouts Electric Grid, Electric Grid & EMP Electromagnetic Pulse, Nuclear spent fuel fire | Tagged , , , , | 1 Comment

The Devil’s Scenario – near miss at Fukushima is a warning for U.S.

[ The most likely event to trigger a loss of power long enough to cause a spent fuel pool zirconium fire meltdown and release of radioactive particles into the atmosphere is a nuclear or natural geomagnetic storm electromagnetic pulse (see Dr. Pry’s testimony at the U.S. House of Representatives on May 13, 2015 at a hearing titled “The EMP Threat:  the state of preparedness against the threat of an electromagnetic pulse (EMP) event”.  The EMP Commission estimates a nationwide blackout lasting one year could kill up to 9 of 10 Americans through starvation, disease, and societal collapse.

Dr. Pry states that “Seven days after the commencement of blackout, emergency generators at nuclear reactors would run out of fuel. The reactors and nuclear fuel rods in cooling ponds would meltdown and catch fire, as happened in the nuclear disaster at Fukushima, Japan. The 104 U.S. nuclear reactors, located mostly among the populous eastern half of the United States, could cover vast swaths of the nation with dangerous plumes of radioactivity“.

Alice Friedemann  www.energyskeptic.com  Author of Life After Fossil Fuels: A Reality Check on Alternative Energy; When Trucks Stop Running: Energy and the Future of Transportation”, Barriers to Making Algal Biofuels, & “Crunch! Whole Grain Artisan Chips and Crackers”.  Women in ecology  Podcasts: WGBH, Jore, Planet: Critical, Crazy Town, Collapse Chronicles, Derrick Jensen, Practical Prepping, Kunstler 253 &278, Peak Prosperity,  Index of best energyskeptic posts

***

Stone, R. May 27, 2016. Near miss at Fukushima is a warning for U.S. Science  Vol. 352, Issue 6289, pp. 1039-1040 

Japan’s chief cabinet secretary called it “the devil’s scenario.” Two weeks after the 11 March 2011 earthquake and tsunami devastated the Fukushima Daiichi Nuclear Power Plant, causing three nuclear reactors to melt down and release radioactive plumes, officials were bracing for even worse. They feared that spent fuel stored in pools in the reactor halls would catch fire and send radioactive smoke across a much wider swath of eastern Japan, including Tokyo.

Thanks to a lucky break detailed in a report released last week by the U.S. National Academies of Sciences, Engineering, and Medicine, Japan dodged that bullet. But the report warns that spent fuel accumulating at U.S. nuclear plants is also vulnerable. The near calamity “should serve as a wake-up call for the industry,” says Joseph Shepherd, a mechanical engineer at the California Institute of Technology in Pasadena who chaired the academies committee that produced the report.

A major spent fuel fire at a U.S. nuclear plant “could dwarf the horrific consequences of the Fukushima accident,” says Edwin Lyman, a physicist at the Union of Concerned Scientists, a nonprofit in Washington, D.C., who was not on the panel. Unpublished modeling from one panel member presents chilling scenarios for a hypothetical spent fuel fire at the Peach Bottom nuclear power plant in Pennsylvania. “We’re talking about trillion-dollar consequences,” says Frank von Hippel, a nuclear security expert at Princeton University, who led the modeling.

After spent fuel is removed from a reactor core, the radioactive fission products continue to decay, generating heat. All nuclear power plants store the fuel in deep pools for at least 4 years while it cools. To keep it safe, the academies panel recommends that the U.S. Nuclear Regulatory Commission (NRC) and plant operators beef up systems for monitoring the pools and topping up water in case a facility is damaged. The panel also says plants should be ready to tighten security after a disaster. “Disruptions create opportunities for malevolent acts,” Shepherd says.

At Fukushima, the earthquake and tsunami cut power to pumps that circulated coolant through the reactors and cooled the water in the spent fuel pools. The pump failures led to the meltdowns; in the pools, located in all six of Fukushima’s reactor halls, they allowed water temperatures to rise dangerously. Of preeminent concern were the pools in reactor units 1 through 4: Explosions had heavily damaged three of those buildings in the days after the tsunami.

The “devil’s scenario” nearly played out in Unit 4, where the reactor was shut down for maintenance. The entire reactor core—all 548 fuel assemblies—was resting in the Unit 4 pool along with another 783 assemblies, shedding vast amounts of heat. When an explosion blew off Unit 4’s roof on 15 March, operators assumed the cause was hydrogen—and they feared it had come from fuel in the pool that had been exposed to air.

Confirmation was impossible because the power loss on 11 March had disabled the pool’s water level indicators. (Analysts now concur that the hydrogen had come not from exposed spent fuel, but from the melted reactor core in the adjacent Unit 3.) Concerns abated after a helicopter overflight on 16 March captured video of sunlight glinting off water in the pool. But the crisis was actually worsening: The water was evaporating away because of the hot fuel. As the level fell perilously close to the top of the fuel assemblies, something “fortuitous” happened, Shepherd says. As part of routine maintenance, workers had flooded Unit 4’s reactor well, where the core normally sits. Separating the well and the spent fuel pool is a gate through which fuel assemblies are transferred. The gate leaked, allowing water from the well to partly refill the pool.

Without that leakage, the panel’s modeling predicts that the tops of the fuel assemblies would have been exposed by early April 2011, and the odds of the assemblies’ zirconium cladding catching fire would have skyrocketed. Only good fortune and makeshift measures to pump water into all the spent fuel pools averted that disaster, the academies panel notes.

A similar scenario could play out at a U.S. nuclear plant if a pool lost water via evaporation or leakage. At most plants, spent fuel is densely packed in pools, heightening the fire risk. NRC has estimated that a major fire at the Peach Bottom nuclear plant’s pool would displace 3.46 million people from 31,000 square kilometers of contaminated land, an area larger than New Jersey. But Von Hippel and others think that NRC has grossly underestimated the scale and societal costs of such a fire.

nightmare scenario pennsylvania contamination cs-137

Figure 1 nightmare scenarios.  Models of a hypothetical spent fuel fire at a pennsylvania nuclear plant.  Depending on weather the Cs-137 plume displaces up to 41 million people (1 July) and contaminates up to 274,000 square kilometers (1 October)

NRC used a program called MACCS2 for modeling the dispersal and deposition of radioactivity from a Peach Bottom fire. Princeton’s Michael Schoeppner and Von Hippel instead used HYSPLIT, a program able to craft more sophisticated scenarios based on historical weather data for the whole region.

In their simulations, the Princeton duo focused on Cs-137, a radioisotope with a 30-year half-life that has made large tracts around Chernobyl and Fukushima uninhabitable. They assumed a release of 1600 petabecquerels, which is the average amount of Cs-137 that NRC estimates would be released from a fire at a densely packed pool, and approximately 100 times the Cs-137 spewed at Fukushima. They simulated such a release on the first day of each month in 2015.

The contamination from such a fire on U.S. soil “would be an unprecedented peacetime catastrophe,” the Princeton researchers conclude in a paper to be submitted to the journal Science & Global Security. For a fire on 1 January 2015, with the winds blowing due east, the radioactive plume would sweep over Philadelphia, Pennsylvania, and nearby cities (Figure 1 nightmare scenarios). For a fire on 1 July 2015, shifting winds would deposit Cs-137 over much of the mid-Atlantic. Averaged over 12 monthly calculations, the area of heavy contamination—exceeding 1 megabecquerel per square meter, the level that would trigger a relocation—is 101,000 square kilometers. That’s more than three times NRC’s estimate and would force the relocation of 18.1 million people on average, about five times NRC’s estimates.

NRC’s first look at the academies report “did not identify any safety or security issues that would require immediate action,” says spokesperson Scott Burnell in Washington, D.C. The agency has long mulled whether to compel the nuclear industry to move most of the cooled spent fuel in densely packed pools to concrete containers called dry casks, which would reduce the consequences and likelihood of a spent fuel fire. As recently as 2013, NRC concluded that the projected benefits do not justify the roughly $4 billion cost of a wholesale transfer. But the benefits of expedited transfer to dry casks are fivefold greater than NRC has calculated, the academies found. “NRC’s policies have underplayed the risk of a spent fuel fire,” Lyman says.

The academies panel recommends that NRC “assess the risks and potential benefits of expedited transfer.” Burnell says that NRC’s technical staff “will take an in-depth look” at the issue and report to NRC commissioners later this year.

Posted in Nuclear Power Collapse, Nuclear spent fuel fire, Nuclear Waste, Scientists Warnings to Humanity | Tagged , , , , , | 1 Comment

After collapse: plunder or feudalism?


IWW poster “Pyramid of Capitalist System” (c. 1911), depicting an anti-capitalist perspective on statist/capitalist social structures

Preface. In this post an anonymous author looks at what will happen if society collapses and we have to suddenly go back to pre-industrial agriculture, and most likely, nomadic groups will plunder the countryside. That’s what happened when Rome fell.

But I vote for feudalism. The National guard will prevent mass migrations and those who get through will encounter local checkpoints that stop them. Bill Gates, the Microsoft co-founder and a billionaire, is the biggest private farmland owner in the country and other billionaires are buying farmland too. Some will staff them with well paid armed guards and enslaved farmers in exchange for their lives (the ultimate form of capitalism).

This really angers me, my biggest hope of preparing for peak oil and everything else was a government sponsored back to the land movement where young folks under 30 would be recruited to become organic farmers on their own land. Instead we’ll likely get feudalism, check out this NYT article:

Qiu L (2022) Farmland Values Hit Record Highs, Pricing Out Farmers. Small farmers are now going up against deep-pocketed investors, including private equity firms and real estate developers. New York Times.

In South Dakota farmland values surged 18.7% from 2021 to 2022,and nationwide, values increased by 12.4% to $3,800 an acre, the highest since 1970, with cropland at $5,050 an acre and pastureland at $1,650 an acre. High prices for commodity crops like corn, soybeans and wheat; a robust housing market; low interest rates until recently; and an abundance of government subsidies — have converged to create a “perfect storm” for farmland values. As a result, small farmers are going up against deep-pocketed investors, including private equity firms, pension funds, and real estate developers.

Young farmers named finding affordable land for purchase the top challenge in 2022 in a September survey by the National Young Farmers Coalition, a nonprofit group.

Already, the supply of land is limited. About 40% of farmland in the United States is rented, most of it owned by landlords who are not actively involved in farming. And the amount of land available for purchase is extremely scant, with less than 1% of farmland sold on the open market annually.

The booming housing market has bolstered the value of farmland, particularly in areas close to growing city centers, which ripples out to land farther and farther away. Government subsidies to farmers have also soared in recent years, amounting to nearly 39% of net farm income in 2020. On top of traditional programs like crop insurance payments, the Agriculture Department distributed $23 billion to farmers hurt by President Donald J. Trump’s trade war from 2018 to 2020 and $45.3 billion in pandemic-related assistance in 2020 and 2021. Those payments, or even the very promise of additional assistance, increase farmland values as they create a safety net and signal that agricultural land is a safe bet, research shows.

What’s happening now is “digital feudalism” for aspiring working farmers who can’t afford to buy their own farms as wealthy landowners drive up prices, and then hire them to work the farms they wanted to buy, locking would-be farmers int a new kind of serfdom where they work land that will never be theirs.

Alice Friedemann  www.energyskeptic.com  Author of Life After Fossil Fuels: A Reality Check on Alternative Energy; When Trucks Stop Running: Energy and the Future of Transportation”, Barriers to Making Algal Biofuels, & “Crunch! Whole Grain Artisan Chips and Crackers”.  Women in ecology  Podcasts: WGBH, Jore, Planet: Critical, Crazy Town, Collapse Chronicles, Derrick Jensen, Practical Prepping, Kunstler 253 &278, Peak Prosperity,  Index of best energyskeptic posts

***

Author unknown. March 3, 2016. The Neopaleolithic: Hunter-Gatherers of the 21st century. thesenecaeffect.wordpress.com

The Seneca Effect: Decline is faster than growth.

There’s a common perception that as our society reaches a peak to the degree of complexity it can sustain, we will gradually return to a lower level of complexity that preceded it.  However, for us to be able to return to a lower level of complexity typically requires us to have maintained the technologies that enabled the previous level of complexity, as well as relevant knowledge of the skills we utilized to sustain the previous level of complexity.

Population.  One major problem we face is that most people simply don’t live in places where food is grown to feed them. Saudi Arabia imports 80% of its food, Kuwait 91%, Qatar 97%. Japan’s caloric self-sufficiency is estimated at 39%. It’s simply not possible, without mass migration across continents, for people to live in those places where their food is produced and participate in food production. This would require mass migration to Australia, New Zealand, Canada and Russia.

Urbanization.  An estimated 49% of people lived in cities in 2005, up from 13% in 1900. This figure continues to rise. It’s questionable whether people are better off in cities or outside of them. It might seem self-evident that the countryside would be preferable, but it’s likely that critical infrastructure in cities can be sustained longer than it can be in more rural places.
Economic decline so far seems to lead to a rise in urbanization, rather than the opposite, as rural places become increasingly expensive to inhabit. What causes urbanization is a reduction in dependence on physical labor in agriculture. So far there seems to be no reversal in this trend.

The Dutch Method: Greenhouses

The Dutch method of food production is characterized by its complete unsustainability. The Netherlands produces 17% of its own need for grains, but a massive 241% of its own need for vegetables. Incredibly, this country produces 290% of its own need for tomatoes, a tropical crop native to central America, where it grows as a perennial. The vast majority of this (80+%) is exported to other countries

How is all of this achieved? Through the use of greenhouses. In the Netherlands yield per hectare of greenhouses lies almost ten times higher than in similar greenhouses in Spain, allowing this country to be a world-leading food producer, despite its lack of farmland.

Various unsustainable technological methods are used in this process.

Rest-heat and captured CO2 from fossil fuel based power plants is routed to the greenhouses, to keep tropical crops like the tomato at the temperature needed for optimal growth. At least 90% of greenhouses are artificially heated.  Other greenhouses burn their own fuel, raising temperatures and creating an environment of elevated carbon dioxide in the greenhouse, typically of 1000 parts per million, to further stimulate growth beyond what heat alone can accomplish. An estimated 7% of natural gas use in the Netherlands is used directly by greenhouses to deliver carbon and heat to plants. A fuel crisis, whether through logistical problems or fossil fuel depletion, thus inevitably also means a food crisis.

Other nations are heavily dependent on greenhouses too, though few of these greenhouses are as completely dependent on modern technology as the Dutch ones. Globally, 473,466 hectares of greenhouses are used, out of which slightly more than 10,000 hectare is found in the Netherlands. A stagnation in greenhouse production is visible in the Netherlands, whereas on a global scale growth continues very rapidly.

Even the windows of the greenhouses are dependent on petroleum. An estimated 90% of greenhouses in the Mediterranean don’t use glass but transparent plastic instead that allows the desired wavelengths to pass through the greenhouse.

Pesticide dependence.  Individual studies tend to find a relatively small decrease in yield for farmers who don’t use pesticides. These estimates can’t be reliably extrapolated however, as such farmers inevitably benefit indirectly from other farmers who do use pesticides on their crops, thereby never allowing pests to gain a foothold in the first place.  Because of the international scale of modern agriculture and our industrial food system as well as a drastic reduction in biodiversity in our plants, a variety of plant pathogens have managed to spread to different species and continents. This has necessitated a growing cocktail of a wide variety of different pesticides, the health effects of which are largely unknown.  Growing plants in greenhouses in particular is nearly impossible without pesticides, due to a variety of factors. Ultraviolet light, which is blocked by glass, harms certain pathogens, but also causes plants to produce compounds that reduce their sensitivity to pathogens. The reduced day-night temperature variation and relatively high humidity also makes greenhouse plants more vulnerable to a variety of pathogens than traditional food production systems.

Irrigation.  Places like Israel depend on desalination for water, which is only accomplished by use of high amounts of energy. Israel also depends on water that is relatively high in salt, so to avoid salt building up in the soil, sprinkler installations are used that require very little water to effectively treat the plants.  Using pre-industrial methods instead, like building irrigation canals, would cause salt to build up in the soil due to evaporation, whereas a lack of irrigation would drastically reduce yields and require a switch to completely different crops.

Nitrogen and Phosphorus.  The two main nutrients we use as fertilizer are nitrogen and phosphorus. Nitrogen is removed from the atmosphere through the Habers-Bosch process, which consists for 80% of nitrogen. This requires the use of natural gas, an estimated 3-5% of global natural gas production is used for this purpose alone. Nearly 80% of nitrogen found in our body originates from this process.

Phosphate is mined from phosphate rock. Because the world’s grasslands are losing phosphorus through various processes, it’s estimated that phosphate application on grassland will have to quadruple between 2005 and 2050, to increase production by the 80% expected to be necessary over that time period.

In total, it’s thought that phosphorus production will have to more than double by 2050 compared to 2005, just to keep up with demand. It’s not clear how much further phosphate rock production can grow. Some estimates are that phosphate rock production will peak by 2027, even as depletion of our soils will merely get worse.

Because rising CO2 concentrations increase the growth rate of plants, places that are currently in phosphorus balance may become gradually depleted as a result and ultimately dependent on phosphorus application by humans. This happens to peripheral regions, where the fertility of land is extracted as the land is valued less than in regions that are highly populated and seen as economically valuable.

While many regions witness phosphorus depletion, places like the Netherlands are victim to over nourishment. Crops are shipped from marginal lands in places like Brazil to factory farm animals in the Netherlands, where animals defecate and the phosphorus is released in excessive amounts into our soils and waters. This is enabled by industrial agriculture’s international orientation, without which minerals like phosphorus would be recycled in a local ecosystem in a more sustainable fashion.

Peak farmland

Today we have less fertile land around the world, due to factors like those outlined above. Some places that used to be farmed have become burdened by too many heavy metals and other pollutants to still be capable of reliably producing food. In China, 19.4% of arable land is estimated to be contaminated with heavy metals. This share will continue to rise in the coming years, as well as the degree of contamination.

It is estimated that the world lost a third of its arable land between 1975 and 2015. Factors that are important here are not just chemical contamination, but also erosion of fertile soils by wind and water, as well as the covering of fertile farmland with human infrastructure. Climate change also contributes to making soils more vulnerable to erosion.  Thus today we find ourselves having to feed more people, with less arable land. What proved possible for our ancestors won’t be possible for us, simply because you can’t go back to farming arable land that no longer exists.

Soil compaction is a harmful process that damages the fertility of our soils. Depending on the depth at which the compaction takes place, the compaction is often practically irreversible.  Unfortunately, governments have a tendency to use poor metrics to estimate soil compaction. It’s estimated for example, that individual humans lead to greater soil compaction than large machinery, simply because the weight of such machinery can be spread out further across the soil through use of big wide tires.

The difference here however, is that topsoil compaction is far less harmless than subsoil compaction. The impact of humans and other animals takes place mostly at the topsoil, because humans and other animals put high pressure at small locations.

Heavy machinery like tractors on the other hand, execute far higher pressure when measured over a broader area. The average tractor has increased in weight from 2 tons in 1950 to 7 tons today, which is more than the largest elephants. The broad tires of the machinery might lead to less harm to the topsoil, but causes greater harm to the subsoil.
The topsoil is quite rapidly restored by earthworms, moles and other lifeforms, who dig through the ground and loosen the soil, allowing roots to penetrate the soil again. The subsoil on the other hand takes much longer to recover when compacted, because the subsoil is home to comparatively few lifeforms.

This prohibits roots from growing into the subsoil and redistributing scarce nutrients up into the higher soils, as well as preventing the subsoil from retaining water, often creating puddles of water above the soil that end up damaging the plants.

In the short term (up to around six years), yields are greatly reduced by subsoil compaction, but there are also smaller more persistent effects that linger for decades. One study estimated a permanent reduction in yield for wheat of 1.5% and 6% for two different fields respectively, as a result of the use of heavy machinery.

Effects are likely to be worse today, due to the even heavier machinery now in use. In addition, plants that naturally root deeper than wheat, like many edible nut species, would have even worse effectively permanent reductions in yield than wheat. Subsoil compaction represents a long-term reduction in the diversity of life that a plot of land could harbor otherwise.

Irreversible transitions.  The problems seen above are a consequence of the general rule of thumb with most technologies that it’s easier to adapt to them than to let go of them again. Our innovations in agriculture are no exception, they’re schoolbook examples.  This transition to modern technology in agriculture produces long-term consequences, that can be concealed in the short-term through use of more new technologies. For example, rising CO2 concentrations make plants more vulnerable to pathogens, but farmers who happily spray pesticides probably don’t realize this until they suddenly have to return to growing crops without pesticides.

Land consolidation.  The number of farms in existence today has decreased drastically, as many people have quit the farming business due to scale advantages that effectively allowed just a few farm business to survive. Whereas formerly people would have guarded the crops growing in their backyard, today farmland is often in the hands of nameless corporations. In the event of a food shortage, the theft of food crops will thus be increasingly difficult to prohibit.

A scenario for the future: Marauding 21st century Hunter-Gatherers

Ownership and control over food producing resources will probably prove difficult to enforce in many places. Even people who own small plots of land will have difficulty growing crops and keeping the harvest for themselves if they do not live on the land.

A scenario where people grow their own food appears to be far less likely than a scenario where nomadic groups of people begin to plunder the countryside. This is what effectively seems to have happened in the Roman empire, where nomadic tribes invaded and local bands of Roman citizens known as Bagaudae began pillaging the countryside.

Eventually, as food that can be plundered from homes and fields begins to run out, people would be forced to depend solely on whatever grows in the countryside. Our changing climate means that this may prove to be a more viable strategy than we might expect.

In Europe, some Middle Eastern refugees already appear to be adapting to a migratory lifestyle, incorporating wild foods into their diet. A spike in mushroom poisoning cases has been seen in Germany as a consequence of refugees eating wild mushrooms.

It seems to me that we should expect to see a lot more of this in the years ahead. Our food production system has evolved in a fashion that is difficult to roll back even when it becomes necessary. It appears more likely to cease working altogether than to become less complex.

Posted in Farming & Ranching, Peak Food, Peak Phosphorus, Soil, Where are the rich going | Tagged , , , , , | 6 Comments

Why railroads are against running locomotives on natural gas

Since oil is finite, natural gas was seen as a fuel that could extend how long oil lasted by being a “bridge” fuel.  Since natural gas is finite also, and would lead to dependence on unstable foreign nations, the plan was that this would “bridge” us to hydrogen fuel cells. Needless to say, that’s never going to happen.

Railroads are adamantly against being pushed towards using natural gas driven locomotives.  Here are a few of the reasons why:

  1. Railroads have experimented with alternative fuels since 1935 and they haven’t worked out
  2. Natural gas emissions are much worse than emissions from a diesel locomotive
  3. LNG locomotives are more expensive than diesel equipment to operate, and a completely new fueling infrastructure would be needed.
  4. Since only one locomotive is sold for every 211 Class 8 trucks, manufacturers are unlikely to do the necessary research required to build an LNG locomotive
  5. Line-haul locomotives need a tremendous amount of fuel – 10 times more than the switch locomotives that re-arrange rail cars in yards.  LNG line-haul locomotives would not go as far, not have enough power, and require a huge amount of on-board fuel storage, which is very impractical and expensive.
  6. In a derailment or accident, LNG is likely to be far more dangerous than diesel

Building LNG locomotives would be really stupid given that fracked natural gas production in America will peak roughly 2016-2020 and decline at an alarming rate, given the 60% per year decline rate of fracked natural gas wells (conventional natural gas reserves have been declining for over a decade), and we have few LNG import terminals.

If railroads stopped running, within a month or two coal electric power plants would shut down, due to lack of coal deliveries, since trains deliver over two-thirds of coal, and refineries would be impacted by trains unable to deliver 759,000 barrels per day (Chase 2014), 8% of USA oil production.

I’ve got two documents below about why railroads do not want to use natural gas fueled locomotives.

Alice Friedemann   www.energyskeptic.com  author of “When Trucks Stop Running: Energy and the Future of Transportation, 2015, Springer

BNSF, et al. 2007. An Evaluation of Natural Gas-fueled Locomotives. BNSF & Union Pacific RR, Assoc of American railroads, California Env  Assoc.  94 pages.

New locomotives must meet a wide range of railroad company, customer, and community requirements, including:

  • safety
  • exhaust emissions performance
  • extensive range
  • high horsepower
  • high tractive effort
  • fuel economy
  • reliability

The principal line-haul locomotive builders, General Electric (GE) and Electro-Motive Diesel, Inc. (EMD), continue to meet these requirements through clean diesel engine enhancements, not through the commercialization of natural gas-fueled locomotives.

The Railroads’ position on natural gas

Some members of the regulatory, engine supply, and fuel supply communities believe the railroads have an opportunity to use natural gas as a locomotive fuel to help meet emissions and performance goals. Except for some potential niche applications, the Railroads disagree. Decades of research and development activities and over-the-rail locomotive prototype demonstrations have given the Railroads a great deal of information about the practicality of using natural gas-fueled locomotives.

Locomotives use a diesel-electric drive system where the output from a combustion engine is used to generate electric power. That electric power is then used to drive an electric motor to provide the high torque required for the locomotive. Locomotives are rated based on tractive horsepower available to drive the wheels of the locomotive.

The emission standards are based on the brake horsepower developed by the combustion engine on the locomotive. Unless stated otherwise, all references in this report to horsepower refer to the tractive horsepower of the locomotive.

A “gen-set” is a self-contained modular package of power generating equipment consisting of a diesel or gas engine coupled to an electrical generator.

Green Goats for both Railroads have been returned to the manufacturer for modification to resolve an equipment malfunction that causes engine fires. One Green Goat for UP is already back in limited service, and the remaining UP Green Goats should be back by the end of the year. BNSF’s Green Goats are still with the manufacturer.

Figure 1 timeline of railroad research activities

Figure 1: Timeline of Railroad Research Activities

The Railroads currently know of one commercially available, proven and tested natural gas-fueled line-haul locomotive product available for the North American locomotive market. It is available only as a retrofit or conversion product. It would convert an approximately 25-year-old, EMD645-E3 3,000 hp diesel locomotive to run on natural gas. Comparing the exhaust emissions of this converted locomotive with those of EPA certified Tier 2 compliant diesel locomotives shows that the new diesel locomotives outperform the natural gas-fueled locomotive on emissions (see Table 1).

Table 1 comparing natural gas-fueled line-haul locomotive converstion and certified tier 2 diesel


Table 1– Comparing Natural Gas-fueled Line-haul Locomotive Conversion and Certified Tier 2 Diesel Line-haul Locomotives

There is no NOx benefit from using this natural gas-fueled locomotive, and all other criteria pollutant emissions are higher—including particulates, which are four to five times greater.

Compared to the operation of the same locomotive on diesel fuel, natural gas is less energy efficient and produces more greenhouse gas emissions (CO2 equivalent). Also, a locomotive using this natural gas conversion kit will likely have higher emissions of some toxic air contaminants, especially formaldehyde.

Niche opportunities may exist There may be niche opportunities to use natural gas in certain locomotive applications, such as the liquefied natural gas (LNG) rail yard switch locomotives in service in Los Angeles

However, because of the relatively small amount of fuel consumed by yard switchers and the possible use of diesel particulate filters on gen sets, there may be little improvement in emissions by using natural gas as a fuel in these engines, and it begs the question as to what advantage there would be in using natural gas given the requisite infrastructure costs that accompany it.

Cost Savings Claims

Claims that natural gas-fueled locomotives will be less expensive to operate than diesel equipment are unfounded.

Moreover, support of natural gas-fueled locomotives will require significant investments in new fueling infrastructure that are duplicative to established diesel based infrastructure. These infrastructure investments and their associated operating costs must be accounted for in any evaluation of cost effectiveness.

Given the small size of the locomotive market (approximately one locomotive is sold for every 211 Class 8 trucks) and given manufacturers’ personnel and financial constraints, it is highly doubtful the builders can simultaneously pursue further improvements in diesel locomotive technology and natural gas-fueled locomotive development.

The following factors should be considered when evaluating natural gas-fueled locomotives:

Locomotive Type. There are significant differences between switch and line-haul locomotives. The differences include: the size and horsepower of the engine that powers the locomotive, the amount of tractive effort the locomotive produces, the duty cycle of the locomotive, the fueling infrastructure requirements, and the range of operations. Switch locomotives spend their time in one location (such as a rail yard), whereas line-haul locomotives crisscross North America and often operate interchangeably on different rail company lines. Due to its greater power rating and higher load factor, a line-haul locomotive will burn up to ten times the fuel compared to a switch locomotive.

What is sensible for one locomotive type may not be for another. For example, spark ignited LNG-fueled locomotives are inhibited by low fuel storage capacity, range, and power density, thus making them impractical for line-haul use, but they could be potentially practical for switch duty if the locomotive can stay close to a fueling source and if high power output is less important.

High locomotive utilization is critical to ensure that the locomotive asset provides an adequate economic return. To achieve this requirement, high horsepower line-haul locomotives must be interchangeable with other railroad fleets (other railroads must be able to fuel, maintain, and operate these locomotives); be highly reliable so as to minimize maintenance requirements and avoid breakdown events; and have the ability to operate over a long range to minimize refueling events. With the possible exception of switch locomotives, creating captive fleets of unique locomotives serving small geographic regions works against these requirements and will decrease locomotive asset utilization and greatly impair the economic competitiveness of the rail industry. This in turn would alter the competitive landscape within the goods movement system, drive additional cargo to heavy-duty trucks, and worsen air quality.

The duty cycle of the locomotive refers to the percentage of time it is operated at different power settings. Locomotives have eight power settings called “notches”. There are also settings for idling and dynamic braking.

The growing practice of run through trains where locomotives interchange from one company’s system to another increases locomotive asset utilization. UPRR, for example, reports that up to 12% of the locomotives operating on its system at any given time are locomotives owned by other railroad companies. This level and frequency of interchange and degree of interoperability keeps the nation’s railroads operating efficiently. New engine and locomotive technology that cannot integrate into this operations paradigm will drive up costs, create emissions inefficiencies, and impair goods movement on rail.

This fact increases the importance of uniformly applied federal emission standards. The devolution of locomotive emissions standards into separate regional or state programs would most certainly lead to higher costs and program inefficiencies to the extent that they presume static and increasingly outdated assumptions about locomotive asset ownership and operational patterns.

A run through train is a train that travels from one company’s track to another without changing locomotives.

When the Tier 3 and Tier 4 standards are adopted, the railroads expect this will make LNG locomotive technologies less favorable to new clean diesel locomotives, not more.

Care must also be taken in reviewing emission benefits for specific projects using natural gas locomotives where the benefits do not come from the fuel change, but come from switching freight to rail. For example, railroads have consistently noted the environmental benefits of replacing truck freight by rail freight. Here the appropriate comparison is the difference between two scenarios: 1) the emissions from truck freight, and 2) the emissions from carrying the same amount of freight by rail. Statements from a California consortium evaluating the use of natural gas-fueled locomotives to replace diesel-fueled trucks provides an example where this type of scenario comparison is both useful and, at the same time, potentially misleading. The consortium’s website indicates that the planned conversion of four EMD SD40-2 locomotive engines to natural gas using the ECI 1SDT dual-fuel, low pressure injection conversion package result in emission reductions of 68.7 tons of NOx and 3,434 pounds of PM annually.” According to materials on file with the SCAQMD, the cause of this reduction appears to be both the replacement of truck freight by rail freight and the potential use of natural gas-fueled locomotives.

As shown in Figure 2, the locomotive builders sell a total of around 1,000 new locomotives to the North American market per year.

Can the natural gas engine technology be packaged into the space constraints of a modern locomotive? (See Figure 3)

  • Can the natural gas engine technology “scale” to meet broad operational requirements?25
  • Can a locomotive with the natural gas engine match the power delivery requirements of newer diesel engine locomotives?
  • Is the natural gas-fueled locomotive sufficiently reliable and durable?
  • What is the fuel economy? How is this measured? How does this fuel economy compare to diesel?
  • Are there fuel supply reliability considerations?

Applications

  • Is the natural gas engine technology applicable to new locomotives, existing locomotives, or both?
  • What is the expected use (e.g., switch, local service, passenger, or freight line-haul) and how does the application-specific duty cycle affect emissions?
  • Are there safety-related issues associated with the natural gas engine locomotives, the fueling stations and infrastructure, or with the fuel delivery process?

Scale relates to how the technology is deployed in practice versus how it performs in limited test or demonstration modes. An example is the current method of fueling the LNG switch locomotives operating in the Los Angeles area. These locomotives are fueled by tanker trucks dispatched from an Arizona processing facility. This fueling method would not reasonably scale to meet broad operational requirements because the volume of fuel required would be too great. There could be similar issues around track and facility space requirements where scaling to meet broad operational requirements is impossible.

The existence of natural gas engines in a variety of stationary and on-road applications identified [by the report authors] does not, however, mean that LNG technology: (a) can be transferred to a variety of locomotive classes operating in all types of service conditions, (b) can meet NOx and other criteria pollutant emission reduction requirements and (c) can meet the railroads’ operating requirements for high horsepower, reliability, and overall fuel efficiency.

This section explains the basic approach to using natural gas as a locomotive fuel. The 1995 EF&EE Report correctly pointed out that there are three methods of burning natural gas in large-bore, heavy-duty engines: spark-ignited, low pressure, and high-pressure injection with diesel pilot ignition (where the fuel is ignited by compression ignition of a small quantity of diesel fuel introduced into the cylinder).

Burlington Northern CNG Effort (1983-1987) In 1983, the Burlington Northern Railroad tested a modified EMD GP-9 locomotive (a 1954-era 1,750 HP switch-sized locomotive with a two-stroke, 16-cylinder 567C model engine) to run the locomotive diesel engine on CNG in a spark-ignited mode. The CNG fuel was stored in compressed gas cylinders mounted on an over-the-road truck trailer placed on a flat car coupled to the experimental GP9 locomotive. The Burlington Northern performed on-the-rail tests for two years in the upper Midwest. It concluded that the low energy density of the CNG made it impractical for wide scale railroad use because of its low range between fueling events.

This effort showed that the energy content of CNG vs. LNG vs. diesel is an important consideration in the evaluation of each fuel. Because of the differences in energy content for each fuel, locomotives utilizing these fuels will have different ranges for a given volume of fuel storage.

For a given fuel volume. an LNG-fueled locomotive will have 2.4 times the range of a CNG-fueled locomotive. Assuming equal engine efficiencies, the diesel-fueled locomotive will have 4.3 times the range as a CNG-fueled locomotive and 1.75 times the range of the LNG-fueled locomotive for equivalent volumes of fuel storage.

Figure 7: Fuel Energy Densities. Energy Content – Btu/gal: CNG 30,100    LNG 73,100    Diesel No. 2 128,100

In addition to the requirement for a new fueling infrastructure, the lower CNG or LNG energy densities would require new fueling infrastructure and operational strategies for locomotives. This includes the use of fuel tender cars and the creation of captive locomotive fleets whose operational ranges are restricted to specific geographic regions. The use of tender cars reduces the number of revenue freight cars and increases the train weight, thus increasing the cost of moving freight. Also, fuel tenders and the locomotives they supply must be kept coupled together increasing equipment asset utilization and difficulties. An LNG locomotive consist (i.e. several locomotives coupled and controlled as a unit) would require one to two LNG tenders at approximately $1 million each.

Other important questions that should be considered for this and other similar projects in the future include:

  • How reliable are the locomotives? For example, should the locomotives experience an in-route break down, diesel locomotives will have to be dispatched to help complete the train movement and bring the non-functioning locomotive to a repair shop. This would impact emissions.
  • Where will the locomotives be maintained and by whom?
  • Where will the locomotives be inspected for Federal Railroad Administration safety inspections?
  • What company will provide the train crews?
  • Over whose tracks will the locomotives operate?
  • Will these locomotives and the revenue service contribute towards the upkeep of the rail infrastructure?
  • How will safety issues be addressed in the event of a derailment?

Answers to these questions and others go to the heart of understanding the Railroads’ arguments about the critical importance of maintaining locomotive interoperability throughout the North American rail network system. While a technology may be effective in a pilot program or small scale, it must be able to be “scaled up” to operate seamlessly within the existing national rail system to maintain operating efficiencies. The Class I railroad companies cannot be competitive operating small fleets of locomotives that are captive to specific regions.

The comparative costs of natural gas and diesel fuel play a large role in determining the potential feasibility of deploying natural gas-fueled locomotives and the cost-effectiveness of any resulting air quality emission reductions. All else being equal (i.e. emissions, thermal efficiency, reliability, etc.), the delivered cost of natural gas would have to be much less expensive than diesel fuel to justify a conversion to its use due to the significant investment required in new and/or retrofit locomotives, duplicative fueling infrastructure, and related operational support costs.

Presently the four LNG switch locomotives that the BNSF leases and operates in Southern California are fueled by LNG that is refined and liquefied in Arizona and is delivered to the locomotive along the right-of-way by truck. According to a BNSF representative, the fuel is delivered “every few days” and each locomotive’s 1,300 gallon fuel tanks are topped off during each refueling. While this is practical for these four locomotives, any appreciable sized fleet of locomotives that use LNG would require a nearby, sizeable, and reliable source of LNG.108 By the end of 2005, California had 40 LNG fueling facilities scattered throughout the state and primarily located near major thoroughfares and serving on-the-road vehicle operators.109 These facilities are not sized or located to support Railroad operations. Furthermore, how this infrastructure might be expanded is unknown.

Decades of research and development activities and over-the-rail locomotive prototype demonstrations have given the Railroads a great deal of information about the practicality of using natural gas-fueled locomotives. Figure 16 below highlights the main Western Class I Railroad research efforts since 1935.

Below is from http://www.siliconinvestor.com/readmsg.aspx?msgid=29524960

  • Freight railroads and the basic economics of fuel choice Major U.S. railroads, known commonly as Class 1 railroads, are defined as line-haul freight railroads with certain minimum annual operating revenue. Currently, that classification is based on 2011 operating revenue of $433.2 million or more [1]. While there are 561 freight railroads operating in the United States, only seven are defined as Class 1 railroads. The Class 1 railroads account for 94% of total freight rail revenue [2]. They haul large amounts of tonnage over long distances, and in the process they consume significant quantities of diesel fuel. In 2012, the seven Class 1 railroads consumed more than 3.6 billion gallons (gal) of diesel fuel [3], amounting to 10 million gal/day and representing 7% of all diesel fuel consumed in the United States. The two largest consumers of diesel fuel among the Class 1 railroads—Burlington Northern Santa Fe (BNSF) and Union Pacific—consumed more than 1 billion gal each in 2012. The cost to Class 1 railroads of consuming such large quantities of diesel fuel was more than $11 billion in 2012, representing 23% of their total operating expense (Table IF3-1).Table IF3-1. Class 1 railroad diesel fuel consumption, fuel cost, and fuel cost share of operating expense, 2012column 1 Class 1 railroad (2012)
  • column 2 Diesel fuel consumption (gallons)
  • column 3 Fuel cost thousand 2012 dollars)
  • column 4 Percent fuel cost share of total operating expense
Burlington Northern Santa Fe 1,335,417,552 $4,273,779 29%
Union Pacific 1,108,029,359 $3,505,671 24%
CSX Transportation 490,902,017 $1,542,747 18%
Norfolk Southern 462,466,433 $1,437,178 18%
Canadian National Grand Trunk 101,555,124 $326,303 16%
Canadian Pacific Soo 71,575,774 $231,211 16%
Kansas City Southern 64,078,412 $195,428 22%
Total 3,634,024,671 $11,512,317 23%
Source: Class 1 Railroad diesel fuel consumption, fuel cost, and fuel cost share of operating expense, 2012: U.S. Departmentof Transportation, Surface Transportation Board, “Annual Report Financial Data,” stb.dot.gov.


Challenges for liquefied natural gas (LNG) as a freight rail fuel (Chase 2014)

While simple economic calculations involving the comparison of fuel cost savings to additional upfront cost are relatively straightforward, other factors, including operational, financial, regulatory, and mechanical challenges, also affect fuel choices by railroads. One of the most challenging factors raised by the switch to LNG locomotives by Class 1 railroads is the effect on operations. Switching from diesel fuel to LNG would require a new delivery infrastructure for locomotive fuel. Natural gas would need to be delivered to fuel depots, either by truck in smaller quantities, as LNG [4],or perhaps by pipeline. Larger quantities of natural gas would require liquefaction before delivery to tender cars for use in locomotives. Building the new infrastructure would require a large financial investment in addition to the large investments made in locomotives and tender cars.

The building of LNG refueling infrastructure could also complicate the inter-operability of the rail network, depending on how quickly modifications could be made to accommodate refueling at multiple points around the nation. Impeding the ability of the rail network system to move goods because of a lack of fuel availability could drive up costs and lead to reductions in network flexibility and operational efficiency [5]. In addition, operations could be further affected by fuel switching because of the cost of training staff at refueling depots and in maintenance shops, updating maintenance facilities to handle LNG locomotives and tenders, and managing more extensive logistics [6]. Further, LNG locomotives and tender cars could require more maintenance than their diesel counterparts. All of these operational changes would create a duplicative infrastructure [7], because many diesel-fueled locomotives still would be in service at least for some significant period, and compression-ignited LNG locomotives still require at least some diesel fuel for combustion ignition.

Replacing the current stock of diesel locomotives with LNG locomotives and tender cars would represent a significant financial investment by Class 1 railroads. In 2012, there were 25,174 locomotives in the service of Class 1 railroads, the vast majority of which were line-haul locomotives [8]. A new diesel line-haul locomotive costs about $2 million [9], and rebuilt locomotives cost about half that amount. With a new LNG locomotive and tender costing about $1 million more than a diesel counterpart, the cost to replace the entire diesel locomotive stock with LNG locomotives and tenders would be tens of billions of dollars, not including additional infrastructure, training, logistics, and a potential increase in maintenance costs. Moreover, much of the cost of the transition, such as purchases of locomotives and tender cars, potentially would occur over a much shorter time period than a fuel payback period.

The financing requirement of large capital expenditures complicates the rather straightforward calculation of locomotive fuel economics. The amount of capital available to Class 1 railroads, either on hand or raised in capital markets, is an important factor in determining whether, or to what extent, railroads can take advantage of fuel cost savings over time. The decision to switch from diesel fuel to LNG is also influenced by the facts that railroads are a highly capital-intensive industry [10] with complete responsibility for maintaining the physical rail network, that they face many competing needs for financial investment, and that they must ensure adequate return on investment for their shareholders.

On the regulatory side, LNG rail cargos currently are not permitted without a waiver from the Federal Railroad Administration (FRA) under Federal Emergency Management Agency (FEMA) rules. The development of standard LNG tenders and regulations is underway, with issues related to safety, crashworthiness, and environmental impact, including methane leakage, under consideration [11].

Finally, LNG locomotives currently are undergoing extensive testing and demonstration to determine their fuel consumption, emissions, operational performance, and range under real-world conditions. Locomotives and tenders will be evaluated to ensure mechanical performance of such components as connections between tender and locomotive. Several Class 1 railroads are planning to start LNG locomotive demonstration projects to provide better understanding of the obstacles to an LNG fuel switch.

Chase, N. April 14, 2014. Potential of liquefied natural gas use as a railroad fuel. United States Energy Information Administration.

Posted in LNG Liquified Natural Gas, Natural Gas Vehicles, Railroads | Tagged , , , | 2 Comments

EROI explained and defended by Charles Hall, Pedro Prieto, and others

[ If you found this post interesting, the following posts are even better (more detailed and in-depth):

Alice Friedemann   www.energyskeptic.com  author of “When Trucks Stop Running: Energy and the Future of Transportation”, 2015, Springer and “Crunch! Whole Grain Artisan Chips and Crackers”. Podcasts: Practical Prepping, KunstlerCast 253, KunstlerCast278, Peak Prosperity , XX2 report ]

Questions about EROI at researchgate.net 2015-2017

Khalid Abdulla, University of Melbourne asks:  Why is quality of life limited by EROI with renewable Energy? There are many articles explaining that the Energy Return on (Energy) Invested (EROI, or EROEI) of the sources of energy which a society uses sets an upper limit on the quality of life (or complexity of a society) which can be enjoyed (for example this one).  I understand the arguments made, however I fail to understand why any energy extraction process which has an external EROI greater than 1.0 cannot be “stacked” to enable greater effective EROI.  For example if EROI for solar PV is 3.0, surely one can get an effective EROI of 9.0 by feeding all output energy produced from one solar project as the input energy of a second? There is obviously an initial energy investment required, but provided the EROI figure includes all installation and decommissioning energy requirements I don’t understand why this wouldn’t work. Also I realise there are various material constraints which would come into play; but why does this not work from an energy point of view?

Charles A. S. Hall replies:  As the person who came up with the term  EROI in the 1970s (but not the concept: that belongs to Leslie White, Fred Cotrell, Nicolas Georgescu Roegan and Howard Odum) let me add my two cents to the existing mostly good posts.  The problem with the “stacked” idea is that if you do that you do not deliver energy to society with the first (or second or third) investment — it all has to go to the “food chain” with only the final delivering energy to society.  So stack two EROI 2:1 technologies and you get 4:2, or the same ratio when you are done.

The second problem is that you do not need just 1.1:1 EROI to operate society.  We (Hall, Balogh and Murphy 2009) studied how much oil would need to be extracted to drive a truck including the energy to USE the energy.  So we added in the energy to get, refine and deliver the oil (about 10% at each step) and then the energy to build and maintain the roads, bridges, vehicles and so on.  We found you needed to extract 3 liters at the well head to use 1 liter in the gas tank to drive the truck, i.e. an EROI of 3:1 was needed.

But even this did not include the energy to put something in the truck (say grow some grain)  and also, although we had accounted for the energy for the depreciation of the truck and roads,  but not the depreciation of the truck driver, mechanic, street mender, farmer etc.: i.e. to pay for domestic needs, schooling, health care etc. of their replacement.    Pretty soon it looked like we needed an EROI of at least 10:1 to take care of the minimum requirements of society, and maybe 15:1 (numbers are very approximate) for a modern civilization. You can see that plus implications in Lambert 2014.

I think this and incipient “peak oil” (Hallock et al.)  is behind what is causing most Western economies to slow or stop  their energy and economic growth.   Low EROI means more expensive oil (etc) and lower net energy means growth is harder as there is less left over after necessary “maintenance metabolism”. This is explored in more depth in Hall and Klitgaard book  “Energy and the wealth of Nations” (Springer).

Khalid Abdulla asks: I’m still struggling a little bit with gaining an intuition of why it is not possible to stack/compound EROI. If I understand your response correctly part of the problem is that while society is waiting around for energy from one project to be fed into a second project (etc.) society needs to continue to operate (otherwise it’d all be a bit pointless!) and this has a high energy overhead.  I understand that with oil it is possible to achieve higher external EROI by using some of the oil as the main source of energy for extraction/processing. Obviously this means less oil is delivered to the outside world, but it is delivered at a higher EROI which is more useful. I don’t understand why a similar gearing is not possible with renewables.  Is it something to do with the timing of the input energy required VS the timing of the energy which the project will deliver over its life?

Charles A. S. Hall replies: Indeed if you update the QUALITY of the energy you can come out “ahead”.  My PhD adviser Howard Odum wrote a lot about that, and I am deeply engaged in a discussion about the general meaning of Maximum Power (a related concept) with several others.  So you can willingly turn more coal into less electricity because the product is more valuable.   Probably pretty soon (if we are not already) we will be using coal to make electricity to pump out ever more difficult oil wells….

I have also been thinking about EROI a lot lately and about what should the boundaries of analysis be.  One of my analyses is available in the book “Spain’s PV revolution: EROI and.. available from Springer or Amazon.

To me the issue of boundaries remains critical. I think it is proper to have very wide boundaries. Let’s say we run an economy just on a big PV plant. If the EROI is 8:1 (which you might get, or higher, from examining just the modules) then it seems like you could make your society work. But let’s look closer. If you add in security systems, roads, and financial services and the EROI drops to 3:1 then it seems more problematic. But if you add in labor (i.e. the energy it takes to make the food, housing etc that labor buys with its salaries, calculated from national mean energy intensities times salaries for all necessary workers) it might drop to 1:1. Now what this means is that the energy from the PV system will support all the purchases of the workers that are building/maintaining the PV system, let’s say 10% will be taken care of, BUT THERE WILL BE NO PRODUCTION OF GOODS AND SERVICES for the rest of the population. To me this is why we should include salaries of the entire energy delivery system (although I do not because it remains so controversial). I think this concept, and the flat oil production in most of the world, is why we need to think about ALL the resources necessary to deliver energy from a project/ technology/nation.”

Khalid Abdulla: My main interest is whether the relatively low EROI of renewable energy sources fundamentally limits the complexity of a society that can be fueled by them.

Charles A. S. Hall replies: Perhaps the easiest way to think about this is historical: certainly we had lots of sunshine and clever minds in the past.  But we did not have a society with many affluent people until the industrial revolution, based on millions of years of accumulated net energy from sunshine. An affluent king, living a life of affluence less than most people in industrial societies now, was supported by the labor of thousands or millions of serfs harvesting solar energy.  The way to get rich was to exploit the stored solar energy of other societies through war (see Plutarch or Tainter’s the collapse of complex societies).

But most renewable energy (good hydropower is an exception) are low EROI or else seriously constrained by intermittency. Look at all the stuff required to support “free” solar energy. We (and Palmer and Weisbach independently) found EROIs of about 3:1 at best when all costs are accounted for.

The lower the EROI the larger the investment needed for the next generation: that is why fossil fuels with EROIs of 30 or 50 to one have led to such wealth: the other 29 or 49 have been deliverable to society to do economic work or that can be invested in getting more fossil fuels.  If the EROI is 2:1 obviously half has to go into the next generation for the growth and much less is delivered to society.   One can speculate or fantasize about what one can do with some future technology but having been in the energy business for 50 years I have seen many come and go.  Meanwhile we still get about 75-80% of our energy from fossil fuels (with their attendant high EROI).

Obviously we could have some kind of culture with labor intensive, low energy input systems if people were willing to take a large drop in their life style.  I fear the problem might be that people would rather go to war than accept a decline in life style.

Lee’s assessment of the traditional  !Kung hunter gatherer life style implies an EROI of 10:1 and lots of leisure (except during droughts–which is the bottleneck).  Past agricultural societies obviously had a positive EROI based on human labor input — otherwise they would have gone extinct.  But it required something like a hectare per person.  According to Jared Diamond cultures became more complex with agriculture vs hunter gatherer.

The best assessment I have about EROI and quality of life possible is in:  Lambert, Jessica, Charles A.S. Hall, Stephen Balogh, Ajay Gupta, Michelle Arnold 2014 Energy, EROI and quality of life. Energy Policy Volume 64:153-167 http://authors.elsevier.com/sd/article/S0301421513006447 — It is open access.  Also our book:  Hall and Klitgaard, Energy and the wealth of nations.   Springer

At the moment the EROI of contemporary agriculture is 2:1 at the farm gate but much less, perhaps one returned for 5 invested  by the time the food is processed, distributed and prepared (Hamilton 2013).

As you can see from these studies to get numbers with any kind of reliability requires a great deal of work.

Sourabh Jain asks: Would it be possible to meet the EROI goal of, say for example 10:1, in order to maintain our current life style by mixing wind, solar and hydro? Can we have an energy system various renewable energy sources of different EROI to give a net EROI of 10:1?

Charles A. S. Hall replies:  Good question.  First of all I am not sure that we can maintain our current life style on an EROI of 10:1, but let’s assume we can (Hall 2014, Lambert 2014).  We would need liquid fuels of course for tractors , airplanes and ships — I cannot quite envision running those machines on electricity.

The problem with wind is that it tends to blow only 30% of the time, so we would need massive storage.  To the degree that we can meet intermittency with hydro that is good, although it is tough on the fish and insects below the dam.  The energy cost of that would be huge, prohibitive with respect to batteries, huge with respect to pumped storage, and what happens when the wind does not blow for two weeks, as is often the case?

Solar PV may or may not have an EROI of 10:1 (I assume you know of the three studies that came up with about 3:1: Prieto and Hall, Graham Palmer, Weisbach — but there are others higher and certainly the price and hence presumed energy cost is coming down –but you should also know that many structures are lasting only 12, not 25 years) — — this needs to be sorted out ).  But again the storage issue will be important.   (Palmer’s rooftop study included storage).

These are all important issues.  So I would say the answer seems to be no, although it might work well for let’s say half of our energy use.   As time goes on that percentage might increase (or decrease).

Jethro Betcke writes: Charles Hall: You make some statements that are somewhat inaccurate and could easily mislead the less well informed: Wind turbines produce electricity during 70 to 90% of the time. You seems to have confused capacity factor with relative time of operation.  Using a single number for the capacity factor is also not so accurate. Depending on the location and design choices the capacity factor can vary from 20% to over 50%.  With the lifetime of PV systems you seem to have confused the inverter with the system as a whole. The practice has shown that PV modules last much longer thatn the 25 years guaranteed by the manufacturer. In Oldenburg we have a system from 1976 that is still producing electricity and shows little degradation loss [1]. Inverters are the weak point of the system and sometimes need to be replaced. Of course, this would need to be considered in an EROEI calculation. But this is something different than what you state. [1] http://www.presse.uni-oldenburg.de/download/einblicke/54/parisi-heinemann-juergens-knecht.pdf

Charles A. S. Hall replies: I resent your statement that I am misleading anyone.   I write as clearly, accurately and honestly as I can, almost entirely in peer reviewed publications, and always have. I include sensitivity analysis while acknowledging legitimate uncertainty (for example p. 115 in Prieto and Hall).  Some people do not like my conclusions. But no one has shown with explicit analysis that Prieto and Hall is in any important way incorrect.  At least three other peer reviewed papers) (Palmer 2013, 2014; Weisbach et al. 2012 and Ferroni and Hopkirk (2016) have come up with similar conclusions on solar PV.  I am working on the legitimate differences in technique with legitimate and credible solar analysts with whom I have some differences , e.g. Marco Raugei.  All of this will be detailed in a new book from Springer in January on EROI.

First I would like to say that the bountiful energy blog post is embarrassingly poor science and totally unacceptable. As one point the author does not back his (often erroneous) statements with references. The importance of peer review is obvious from this non peer-reviewed post.

Second I do not understand your statement about wind energy producing electricity 70-90 percent of the time.  In England, for example, it is less than 30 percent (Jefferson 2015).

Third your statement on the operational lifetime of actual operational PV systems is incorrect. Of course one can find PV systems still generating electricity after 30 years.  But actual operational systems requiring serious maintenance (and for which we do not yet have enough data) often do not last more than 18-20 years, For example Spain’s “Flagship ” PV plant (which was especially well maintained) is having all modules replaced and treated as “electronic trash” after 20 years : http://renewables.seenews.com/news/spains-ingeteam-replaces-modules-at-europes-oldest-pv-plant-538875    Ferroni and Hopkirk found an 18 year lifespan in Switzerland.

Pedro Prieto replies: The production of electricity of wind turbines the 70-90% of time is a very inaccurate quote. Every wind turbine has a nominal capacity in MW. The important factor is not how many hours they move the blades at any working regime, but how many EQUIVALENT peak hours they work at the end of the year. That is, to know how much real energy they generate within one year. This is what the industry uses as a general and accurate measurement and it is the load factor or capacity factor.

Of course, this factor may change from the location or the design choices, but there is an incontrovertible figure: when we take the total world installed wind power in MW (435 Gw as of 2015) from January 2004 up to December 2015 and the total energy generated in Twh (841 Twh as of 2015) in the same period and calculate the averaged capacity factor, the resulting figure slightly varies around 15% AT WORLD LEVEL. This is REAL LIFE, much more than your unsupported theoretical figures of 20 to over 50% capacity factor in privileged wind fields for privileged wind turbines.

Interesting enough, some countries like the US, United Kingdom or Spain have capacity factors reaching 20% in the last years, but the world total installed capacity has not really improved so much in the last ten years, despite of theoretically much efficient wind turbines (i.e. multipole with permanent magnets), very likely for the reasons that good wind fields in some countries were already used up. Other countries like China, India or France show, on the contrary very poor capacity factors even in 2015.


With respect to the lifetime of the PV systems, nor Charles Hall neither myself have confused the inverter lifetime with the solar PV system as a whole. The practice has not shown that modules have lasted more than 25 years in general over the world installed base. The fact that one single system is still working after more than 30 years of operation, if it was carefully manufactured with high quality materials, and was well cared, cleaned and free from environmental pollutants, like several modules we have also in Spain, does not mean AT ALL that the massive deployments (about 250 GW as of 2015) are going to last over 25 years.

I have to clarify also a common mistake: almost all main world manufacturers guarantee a maximum of 25 years (NOT 30) to the modules, but this is the “power” guarantee. This means that they “guarantee” (assuming they will be still alive as companies in 25 years from the sales period, something which is rather difficult for many of the manufacturers that went out of business in shorter periods of time than the guarantee of their modules. Of course, this guarantee is given with the subsequent module degradation specs over time, which in many cases has been proved be higher than specified.

But not only that. Most of the module manufacturers have a second guarantee: the “material’s guarantee”. And this is offered for between 5 and 10 years. This is the one by which the manufacturer guarantees the module replacement if it fails. Beyond that date, if the module fails, the buyer has to buy a new one (if still being manufactured, with the same specs power and size), because the second guarantee SUPERSEDES the first one.

Last but not least, there is already quite a large experience in Europe (Germany, France, Switzerland, Spain, Italy, etc.) of the number of faulty modules that have been decommissioned in the last years (i.e. period 2010-2015) as for instance, accounted by PV-Cycle, a company specialized in decommission and recycling modules in Europe. As the installed base is well known in volumes per year, it is relatively easy to calculate, in a very conservative (optimistic) mode the percentage over the total that failed and the number of years that lasted in this period and the average years for that sample that died before the theoretical 25-30 years lifetime and make the proportion on the total installed base.

The study conducted by Ferroni and Hopkirk gives an approximate lifetime for the installed base of lower than 20 years. And this is Europe, where the maintenance is supposed to be much better made than in the rest of the developing world. And the figures of failed modules given by PV-Cycle did not include the many potential plants that did not deliver their failed modules to this company for recycling

What it seems impossible for some academic people is to recognize that perhaps the “standards” they adhered to (namely IEA PVPS Task 12 in this case) and through which they published a big number of papers, should be revisited, because they lacked some essential measurements that could help to understand why renewables are not replacing fossils at the required speed, despite having claimed for years that they reached grid parity or that their Levelized Cost of Electricity (LCOE) is cheaper than coal, nuclear or gas. 

I am afraid that peer reviewed authors are not immune to having preconceived ideas even more difficult to eradicate. Excessive pride, lack of humility, considerable distance between the academy (i.e. imagined solar production levels versus real data from actual solar PV plants and lack of a systemic vision due to an excess of specialization are the main hurdles. Of course in my humble opinion.

References

  • Hall, C.A.S., Balogh, S., Murphy, D.J.R. 2009. What is the Minimum EROI that a Sustainable Society Must Have? Energies, 2: 25-47.
  • Hall, Charles  A.S., Jessica G.Lambert, Stephen B. Balogh. 2014.  EROI of different fuels  and the implications for society Energy Policy Energy Policy. Energy Policy, Vol 64 141-52
  • Hallock Jr., John L., Wei Wu, Charles A.S. Hall, Michael Jefferson. 2014. Forecasting the limits to the availability and diversity of global conventional oil supply: Validation. Energy 64: 130-153. (here)
  • Hamilton A , Balogh SB, Maxwell A, Hall CAS. 2013. Efficiency of edible agriculture in Canada and the U.S. over the past 3 and 4 decades. Energies 6:1764-1793.
  • Lambert, Jessica, Charles A.S. Hall, et al.  Energy, EROI and quality of life.  Energy Policy
Posted in Charles A. S. Hall, EROEI Energy Returned on Energy Invested, Pedro Prieto | Tagged , , , | 3 Comments

Coal power plants depend on railroads to deliver coal

coal trains

[ The extract of a Senate hearing below is mostly spent on testimony by utilities bashing the railroads for not delivering enough coal due to a disaster in the Powder River Basin, Wyoming area, where coal dust infiltrated the stone ballast due to unusually wet weather, creating drainage problems that ultimately led to derailments which took several months to fix. Railroads deliver 72% of coal to coal power plants.

But it turns out the utilities are equally to blame. They’ve been reducing their coal stockpiles.  According to the EIA: “Coal stockpiles at electric power plants have generally been declining for years: end-of-year stocks declined from 135.9 million tons in 1989 to 101.2 million tons in 2005, down 26%, although coal-fired generation and coal consumption both increased during this period. The long-term us due to power plant operators trying to minimize their coal inventory holding costs.

What’s interesting to me about this hearing is how vulnerable our system is due to this interdependency. If trains can’t deliver coal, then coal plants can’t make electricity, which would make it impossible to refuel trains (pumps are electric).  Climate change is likely to buckled rail (extreme heat), wash away tracks (extreme storms and flooding), leading to even more unreliable coal delivery. Now natural gas and nuclear can still step in to keep the grid up, but as natural gas and uranium ores decrease, and up to half of nuclear power plants retire by 2030 with few new ones built, the electric grid will grow increasingly fragile, until it isn’t always up most of the time.

In 2006 reliance on coal for electricity, and soon COAL-TO-LIQUID (CTL) TRANSPORTATION FUEL, were expected to grow in the future because there wasn’t as much natural gas as hoped for.  And now again, there still isn’t — fracked gas did buy us an extra 10 years or so, but it is about to rapidly decline sometime between now and 2020.   When CTL hearings are heard again (the last ones were held 2005-2007), you’ll know the energy crisis is back with a vengeance.

Alice Friedemann   www.energyskeptic.com  author of “When Trucks Stop Running: Energy and the Future of Transportation”, 2015, Springer and “Crunch! Whole Grain Artisan Chips and Crackers”. Podcasts: Practical Prepping, KunstlerCast 253, KunstlerCast278, Peak Prosperity , XX2 report ]

Senate 109-601. May 25, 2006. Coal-based generation reliability. Senate hearing.

PETE V. DOMENICI, U.S. SENATOR FROM NEW MEXICO.  The purpose of today’s oversight hearing is to receive testimony on the reliability of coal-based electric generation in the short term and in the future. According to the EIA, coal has fueled about half of this Nation’s electricity for the past 50 years, and the use of coal is expected to grow. The EIA estimates coal will supply 57% of our electricity needs by the year 2030. That is substantially up. Coal is a resource that this country has in abundance, with 25% of the total world reserves. The United States has been dubbed the Saudi Arabia of coal.  In order to maintain coal as a reliable resource, we must be able to move coal from the mines to the generating plants. More and more, the country is relying on low sulfur coal from the Powder River Basin in Wyoming and Montana to meet Clean Air Act requirements. Rail transportation is responsible for moving the coal for a majority of this load. With last year’s train derailments, the dependence on a reliable transportation system was highlighted. Some utilities were caught with low stocks of supplies and were forced to dramatically curtail generation. This, in turn, led to expensive replacement power, with the cost passed on to the end customer.

CRAIG THOMAS, U.S. SENATOR FROM WYOMING.  Half of our generation for electricity now is done by coal, and about 40% of that comes from the Powder River Basin, much of it from Wyoming. So that is even better. Sixty percent of the price paid for coal is transportation cost, and so we are going to be faced with making some changes and some ideas for getting more transportation available. Are we going to have to do more mine mouth generation and other kinds of things?

HOWARD GRUENSPECHT, DEPUTY ADMINISTRATOR, ENERGY INFORMATION ADMINISTRATION, DEPARTMENT OF ENERGY.   For the past 50 years coal has fueled roughly half the Nation’s electricity generation. Between 1989 and 2005, net generation from coal increased by 27%, while total coal-fired generation capacity grew by only 3%. The average capacity factor or utilization rate of coal-fired plants increased from 60 percent to 72 percent over this period.

Rail shipments in 2005 accounted for 72% of all coal delivered to electric power plants. National average rail transportation costs, which now represent about 40 percent of delivered coal costs, increased from 51 cents per million Btu in 2004 to about 63 cents per million Btu early this year.  Contract rail transportation represented about 60 percent of the average total cost of rail-delivered Western subbituminous coal, which is primarily produced in the Powder River Basin, and only 25 percent of the average total cost of rail delivered Eastern bituminous coal.

Days of burn, a measure of the number of days a plant or group of plants can operate using only on-site inventories for supply, is a way of representing coal stockpiles of power plants in relation to anticipated use. At the national level, days of burn increased from 38 days to 40 days between February 2005 and February 2006. However, the increase has not been uniform. Stocks of bituminous coal increased 23 percent over that period, but inventories of subbituminous coal, again the vast majority of which comes from the PRB, dropped 7 percent over that period.

In addition to a draw down of inventories, the shortfall in shipments over the past year has led to some reduction in utilization at some coal-fired plants. To compensate, electric power companies bought power from other generators or relied more heavily on other plants within their systems. Under recent market conditions, substitution of power generated at natural gas-fired plants in lieu of coal-fired power can be an expensive option

Our Annual Energy Outlook projects that coal-based generation will continue to be the dominant source of the Nation’s electricity supplies through 2030. Reliance on all types of coal is projected to increase over time, but particularly the Powder River Basin coal, suggesting a requirement for increased capacity throughout the Nation’s rail transportation system.

Although coal-fired generation has grown by 27% since 1989, the coal consumption measured in tons increased by 34% (from 782 million tons to 1,051 million tons). Consumption of coal outpaced the growth in generation because of increasing use of subbituminous coal produced in the PRB. This subbituminous western coal has less energy content per ton than eastern and Midwestern bituminous coal, so more tons are needed to produce an equivalent amount of electricity. Western subbituminous coal is generally lower in sulfur and less expensive to produce than bituminous coal, which often makes subbituminous coal a preferred option for environmental and economic reasons despite its lower energy content.

Coal stockpiles at electric power plants have generally been declining for years: end-of-year stocks declined from 135.9 million tons in 1989 to 101.2 million tons in 2005, down 26%, although coal-fired generation and coal consumption both increased during this period. The long-term us due to power plant operators trying to minimize their coal inventory holding costs. Over the past several years, however, operators at times have found it difficult to maintain stockpiles because of intermittent disruptions in coal production and transportation. Concerns over coal deliveries and reduced stockpiles have grown over the past year due to problems with shipments of coal from the PRB.

RAILROAD TRANSPORTATION ISSUES.  In the PRB, a number of disruptions occurred in planned coal shipments during 2005. Structural failures in the rail roadbeds caused two major train derailments on the weekend of May 14. The roadbed failures were triggered by unusually wet weather for the region. Accumulated coal dust infiltrated the road foundations (stone ballast) and created drainage problems which led to the derailments.

This affected all three mainlines in the Joint Line shared by the Burlington Northern Santa Fe Railway (BNSF) and Union Pacific Railroad (UP) used to move coal unit trains in and out of the PRB. Normally, the Joint Line operates 365 days a year, 24 hours per day and moves three loaded coal trains per hour out of the basin.

After the derailments, BNSF and UP replaced more than 100 miles of roadbed, including new concrete railroad ties and new tracks to facilitate trains passing. Rebuilding continued, as scheduled, through November 2005 and was restarted with the spring thaw in 2006. During this entire period, rail traffic in and out of the PRB has been disrupted at times, but it is now moving more fluidly, even though the reconstruction project is not yet quite complete. BNSF and UP have invested heavily over the past 20 years in rail infrastructure and equipment to serve the PRB coal market. Both railroads continue to make additional capital improvements throughout their respective rail systems: adding parallel tracks, upgrading classification yards, alleviating bottlenecks, and generally improving capacity for all types of rail traffic. On May 8, 2006, the UP and BNSF announced that they would spend $100 million over the next 2 years to construct more than 40 miles of third and fourth main line tracks on the PRB Joint Line. This follows the addition of 14 miles of third line track in 2005 and 19 miles currently under construction in 2006. The railroads believe the completion of these projects will raise Joint Line capacity to at least 400 million short tons per year, compared with the record 325 million short tons hauled in 2005.

The capacity of natural-gas-fired power plants (including oil-burning plants that can also use natural gas) more than doubled, from 165.9 to 409.2 gigawatts between 1989 and 2005. Most of this capacity is not fully utilized, but using it in lieu of coal-fired power can be an expensive option.

At the average cost of delivered natural gas to the electric power sector in January 2006, a new, efficient natural-gas-fired combined-cycle plant can produce electricity at a fuel cost of roughly 6.4 cents per kilowatthour. The comparable cost for a conventional coal-fired plant at the January 2006 national average delivered price was less than a third as much, about 1.5 cents per kilowatthour.

Because of the complex and (currently) capacity-constrained PRB operations and delivery schedules, it will take some time to rebuild sub-bituminous stocks. With the supply chain for PRB coal as fully committed and finely tuned as it is, any future weather, equipment or infrastructure failure has the potential to reverberate through the entire system.

Hardly a month goes by that delivery of PRB coal somewhere in the supply chain is not interrupted by a derailment, freezing, flooding, or other natural occurrence. In most cases, the events are small compared with the amount of PRB coal delivered each year, and the rail system and inventories are capable of absorbing them, unless the events are particularly severe or occur simultaneously.

The situation in the East is somewhat different. The primary eastern railroads, Norfolk Southern Railway (NS) and CSX Transportation (CSXT), divided and absorbed Conrail’s assets in 1998. Both railroads experienced a number of customer complaints related to slow deliveries in the years following the Conrail acquisition. The impact of population density and geography mean the eastern railroads must contend with more traffic per mile of track, more congested routes and delivery areas, steeper grades and narrower, winding right-of-ways and routes than the western railroads. Recent increases in the export coal market have further congested rail lines in the East. Therefore, deliveries of bituminous coal to eastern power plants may also have been disrupted, to some degree, by hauls to export docks.

It is important to note that railroad capacity constraints nationwide entail more than just the infrastructure improvements at important coal origins and destinations. Other parts of the rail system are also increasingly constrained in their capacity to handle all rail traffic, not just coal. Nationwide rail capacity is constrained in part because of growth in demand in other freight sectors, including agricultural products, consumer goods, and especially, intermodal shipments (trailers or containers on flat cars). Use of these has been growing as an alternative to long-haul trucking which has been impacted by a shortage of drivers and higher diesel fuel costs. Future economic growth and the possibility that railroads will reacquire market share for shipments previously lost to truck and barge will continue to challenge the railroads to provide sufficient capacity.

THE FUTURE OUTLOOK FOR COAL.   Over the next 25 years, EIA expects significant growth in the use of coal for the generation of electricity and the rail transportation system will need to be expanded to accommodate it. Over the same time period, coal use in the industrial sector is expected to grow as coal is used to produce liquid fuels together with electricity.

The wide-spread availability and relatively low cost of coal make it very economical for electricity generation. As a result, in the reference case in EIA’s Annual Energy Outlook 2006 (AE02006), total coal consumption is projected to increase from 1.1 billion short tons in 2004 to 1.3 billion short tons in 2015 and 1.8 billion short tons in 2030.

The increase in coal use over the next 5 to 10 years is driven primarily by greater use of existing coal plants, while in the longer term, a large number of new plants are expected to be added. The current average utilization rate of approximately 72% is projected to increase to 80% by 2013. In addition, over the 2004 to 2030 time period, 174 gigawatts of new coal-fired electricity generation capacity, including 19 gigawatts of coal-to-liquids capacity, are projected to be added. Most of the projected new coal plants, 126 gigawatts, are expected to be added after 2020, and a little over half of them are expected to be integrated gasification combined-cycle (IGCC) plants.

To meet the growing demand for coal, most coal supply regions, particularly those in the West, are projected to increase their annual production volumes. The exceptions to this are the Central and Southern Appalachia regions where mining difficulties and reserve depletion are projected to contribute to lower production levels in 2030 compared to 2004. In contrast, the PRB has large, productive surface mines that are able to produce coal at a comparatively low cost. In 2030, the PRB is projected to produce 719 million short tons, 298 million tons higher than in 2004, accounting for 52 percent of the total increase in annual coal production between 2004 and 2030.

As with all long-term projections, there are significant uncertainties. With respect to coal markets, key areas of uncertainty include future economic growth, long-term productivity improvements that influence coal prices, competing natural gas prices, the development of competing technologies such as nuclear, and the possibility of new policies to curb the growth in CO2 emissions.

The EIA has projected that by 2030 Powder River will produce 719 short tons of coal. This year’s Annual Outlook was first to include a significant amount of coal to liquid production.  The amount of the coal used for coal to liquids production would be about 150 million tons out of the 719. So it is pretty substantial by 2030.

Senator BURNS. In some areas, we got reports of coal being imported from offshore when they had those big drawdowns, and that sort of concerns me. I would hate to get as dependent on foreign coal as we do on oil. Should we be concerned, from a domestic energy production standpoint, about some increased need of imported coal due to delivery system breakdowns?

Dr. GRUENSPECHT. We import and export coal. We export a lot of metallurgical coal and we import some coal mostly for power production, as you pointed out. Both the imports and the exports are pretty small in relation to our domestic production and consumption, on the order of 3 to 4%. And the imports and exports balance out. My understanding is that a lot of the imports come into Eastern and Southern ports. I think Colombia is our biggest source of coal imports, and we import some from Canada as well.  I do not think we are headed toward a situation in coal like the situation we have in oil.

Robert ‘‘Mac’’ McLennan, vice president of external affairs, for the Tri-State Generation and Transmission Association.   As a 24% owner in Laramie River Station in Wheatland Wyoming, we have a significant interest in what has happened there, as members have to date faced both increased rates and reduced coal shipments. In order to maintain efficiency, coal-based plants like Laramie River Station, or LRS, are run almost continuously. Maintaining full generation requires a train and a half a day. In addition to the train and a half a day, we try to maintain a 30-day supply of coal in the stockpile. Earlier this year we actually got to 6 days. If the stockpile had depleted any further, we would have been forced to curtail generation at a significant cost to our members. We would have had to either use natural gas, which as a fuel source is five to seven times more expensive than the underlying coal, or purchase off the purchase power market, if available, at much higher prices.

STEVEN JACKSON, DIRECTOR, POWER SUPPLY, MUNICIPAL ELECTRIC AUTHORITY OF GEORGIA, ATLANTA, GA.   MEAG Power’s primary purpose is to generate and transmit reliable and economic wholesale power to 49 Georgia communities—including approximately 600,000 citizens and many large and small businesses. BNSF provides the initial portion of the PRB haul under separate contract. The plant is approximately 2,000 miles (4,000 miles roundtrip) from the Powder River Basin and coal is delivered by thirty-seven sets of privately owned 124 car unit trains. These train sets are constantly in motion cycling from the PRB to our plants and back.

DAVID WILKS, PRESIDENT OF ENERGY SUPPLY, XCEL EN- ERGY, MINNEAPOLIS, MN, ON BEHALF OF THE EDISON ELECTRIC INSTITUTE AND CONSUMERS UNITED FOR RAIL EQUITY.   Xcel Energy is a major electric and natural gas company, with annual revenues of $10 billion. Xcel Energy generates 78.6 GWhs of electricity annually, 72% from coal-fired generation, 100% of the coal is supplied by rail.

Today, most coal moves in unit trains between the mines and the power plants. These trains typically consist of 100-130 cars owned or provided by the utility, with 100-120+ tons of coal per car, which shuttle continuously from the coal mine to the power plant without ever being uncoupled.

Unfortunately, it has become increasingly difficult to maintain adequate coal stockpiles, especially over the last couple of years.  Because of recent rail delays and other rail service problems, many utilities have been forced to reduce outputs from coal-fired generating plants—requiring greater reliance on natural gas-fired generation and some have even resorted to importing coal from overseas sources as far away as Indonesia, in order to meet the demand for electricity.

Like most utilities in the West and Midwest, Xcel receives most of its coal by rail from the Powder River Basin (PRB) coal seam of Wyoming and Montana. The PRB is the most significant coal producing region in the United States, with approximately 40% of all U.S. coal production mined there. PRB coal has been particularly attractive to electric utilities because of its relatively lower price and low sulfur content.

Two railroads, the Burlington Northern Santa Fe (BNSF) and the Union Pacific (UP), move all of the coal out of the PRB, much of it over a Joint Line they operate together. In the spring of 2005, two derailments occurred on the Joint Line, significantly reducing rail deliveries of coal by 15 to 20 percent. While significant repairs have been underway for months and are scheduled to be completed by the end of the year, train speeds remain reduced to avoid further derailments. Delivery levels have not yet recovered, and some utility coal stockpiles remain significantly lower than desired levels. In the case of Xcel, we have several plants that are struggling to maintain even 10 days of coal on the ground. At a minimum, the situation appears to bring into serious question whether the carriers are meeting their common carrier obligation to provide service to the public.

The significant additional costs resulting from rail service failures have put additional upward pressure on consumers’ electricity rates. In order to replace an estimated 20 million ton shortfall in PRB coal deliveries in 2006, electric generators may be forced to use approximately 340 billion cubic feet of natural gas, costing at least $2 billion more than the coal that will not be delivered this year.

In some cases, the situation has become so bad that utilities have found it necessary to sue the railroads for damages resulting from delivery shortfalls. For instance, Entergy Arkansas is involved in litigation against the Union Pacific over the failure of the rail carrier to meet its coal delivery obligations last year. The utility had to cut back production from two coal-fired plants, forcing it to increase its power purchases in the wholesale market. Also, Entergy is one of a handful of utilities that have taken the extraordinary step of importing foreign coal—in this case from Colombia—due to the inability of the railroads to move adequate amounts of domestic coal in a timely manner.

ROBERT K. SAHR, CHAIRMAN, SOUTH DAKOTA PUBLIC UTILITIES COMMISSION, PIERRE, SD, ON BEHALF OF THE NATIONAL ASSOCIATION OF REGULATORY UTILITY COMMISSIONERS.   In 2005, coal plant operators experienced reduced coal deliveries under firm contract by an estimated 10 to 25%. Coal reserve levels at plants in the upper Midwest dropped below 10 days at times, as we heard earlier, where typically 30 days is considered prudent.  This crisis is endangering our energy security. Dangerously low reserves make plants more vulnerable to weather, rail accident, terrorist attacks, and other disruptions.

GAS VS. COAL-GENERATED ELECTRICITY.   Recently, the nation has experienced record high prices for natural gas, which has dramatically increased the cost of both natural gas and electricity service to the millions of business and residential customers in this country. Currently, the fuel cost component of producing electricity at gas-fired power plants can be as much as five times higher than the fuel component of producing electricity at a coal-fired power plant. As a prudent business practice, one would expect that, given existing gas prices, electricity producers would be seeking to utilize existing coal-fired electric generation as much as possible in lieu of gas-fired generation in order to produce electricity more economically and to avoid upward pressure on natural gas prices.

In March, the Big Stone Power Plant stockpile dwindled to a 10-day supply while the plant waited for their rail service provider to deliver the needed coal, Some of the coal at the bottom of the stockpile has been stored on open ground, exposed to the elements for 20 years in some cases, and can only be used as a last resort. According to Basin Electric Power Cooperative, a co-owner of Laramie River Station, using this coal also brings other issues of concern. The coal at the bottom of the Laramie River Station stockpile has significantly reduced BTU value and includes rocks that are being run through the plant’s turbines. Plant staff members are now cleaning the pulverizers on a daily basis, where in normal operation it is done every two to three weeks.

EDWARD R. HAMBERGER, PRESIDENT AND CEO, ASSOCIATION OF AMERICAN RAILROADS.  I am very pleased that the hearing is being held today and not last May. Last May, our ability to ensure reliability on coal shipments was certainly being challenged. That happened for several reasons. First and foremost, in May of last year, a heavy rainfall in Wyoming, combined with an accumulation of coal dust on the roadbed and a spring snowstorm put moisture into the track structure, causing instability and resulting in two derailments on a heavily used Powder River Basin rail line. The derailments and the subsequent repairs disrupted coal shipments out of the PRB for months afterward.

Later in the year, as Senator Landrieu knows, hurricanes Katrina and Rita created backups and congestion that affected the entire rail network. For example, much of Midwestern and Northern Plains grain had to move by rail rather than by barge down the Mississippi. Finally, in October, a deluge dumped a foot of rain in Kansas City, disrupting rail service on several major coal-carrying routes for about 2 weeks.

Second, demand for rail transportation in general was much higher in 2005 than in previous years, creating capacity constraints on important parts of the U.S. rail network. It is not just the Powder River Basin lines that are important here. It is the entire rail network, as these coal trains move 1,500-2,000 miles across country. Third—and this is a key point, Mr. Chairman—this entire supply chain is not just railroads. It is the production capability of the mines. It is our ability to move it. It is barge ability to move it, and it is what happens at the utility end, at the delivery end. As the EIA testimony indicates, between 1980 and 2000, utilities consciously reduced their inventories, their stockpiles by two-thirds, thereby cutting the zone of what they could rely on. Some would argue that they cut that stockpile much too fast, much too far. Fourth, the system was exacerbated by a dramatic increase in the price of natural gas, leading to an unprecedented increase in demand for coal-fired electricity generation. Now, this was a reversal of what had been happening. As you can see by the chart, during the previous 5 years, electric utilities brought nearly 200,000 megawatts of new natural gas generation capacity on line compared with almost null, about 1,200 new megawatts of coal generating capacity, and this continued the trend of the previous years. Utilities had shown their preference for natural gas and that that was the fuel of choice, and railroads and, undoubtedly, the mining companies as well developed their capital plans accordingly.

The vast majority of coal in the United States is used to generate electricity, with smaller amounts used in industrial applications like fueling cement kilns or producing coke. Coal accounted for 50 percent of U.S. electricity generation in 2005, far more than any other fuel.

The amount of electricity generated by coal in the United States rose from 1.6 billion megawatthours in 1990 to 2.0 billion megawatthours in 2005—an increase of 420 million, or 26%. But because overall U.S. electricity generation rose 33% during this period, coal’s share of total generation actually fell, from 52.5% in 1990 to 49.9% in 2005.

By contrast, natural gas’s share of U.S. electricity generation rose from 12.6% in 1990 to 19% in 2005. In fact, during the 1990s and into the first half of this decade, virtually no new coal-fired electricity generation capacity and no new nuclear facilities were built, but huge amounts of gas-fired capacity were added.

Natural gas was the fuel of choice for new capacity for several reasons. Gas plants could be constructed relatively quickly and enjoyed an easier permitting process, and thus were less expensive to build. They were also considered to be ‘‘environmentally friendly.’’ Perhaps most importantly, though, it was assumed that natural gas would remain cheap and plentiful.

This, of course, did not happen. Over the past few years, the price of natural gas to utilities has skyrocketed, making gas-fired generation less competitive and sparking increased demand for electricity generated from other fuels, including steam coal. In contrast to the delivered price of natural gas, the delivered price of coal to utilities has remained basically flat, and on a per-Btu basis is far below the comparable figure for natural gas. In addition, demand for metallurgical coal rose sharply because of a boom in steelmaking worldwide.

This unexpectedly strong increase in the demand for coal, which occurred at the same time that demand for rail transportation overall was rising sharply (discussed further below), has in some cases exceeded the capability of coal producers to supply the coal and coal transporters to haul it. That’s not surprising, especially since utilities, by their actions, had long been disfavoring coal in favor of natural gas, and neither coal suppliers nor coal transporters have unlimited spare capacity on hand ‘‘just in case.’’

Coal-fired power plants have been reducing their coal stockpiles since the early 1980s. A typical electric utility held nearly two months of full-load burn in the early 1980s; by the late 1990s, this had fallen to near one month.  According to EIA data, coal stocks at electric power producers as a percentage of coal consumption fell from more than 30% in 1980 to 10% by 2000. The decision to reduce stockpiles was part of a deliberate utility effort to shift to just-in-time inventory practices to limit capital tied up in fuel stocks. With inventory reduced to this degree, utilities eliminated a traditional buffer to withstand supply disruptions (like the May 2005 PRB derailments noted below).

Going forward, one of the root causes of the weather-related problems of 2005—coal dust ‘‘blow off’’—must be aggressively addressed. Just as with other coal delivery chain issues, the mines, utilities, and railroads must collectively identify, agree upon, and implement the best method to combat ‘‘blow off’’ so that the premature wear of rail infrastructure in the PRB can be eliminated.

OUTLOOK FOR COAL.  U.S. coal production and consumption will almost certainly continue to grow. In its Annual Energy Outlook 2006, released in December 2005, the EIA projects that U.S. coal production in 2015 will total 1.27 billion tons, a 140-million ton increase (12%) over the 1.13 billion produced in 2005. The EIA expects U.S. coal consumption to increase from 1.13 billion tons in 2005 to 1.28 billion tons in 2015, a 147-million ton increase. DOE’s National Energy Technology Laboratory reports that 140 coal-fired generating plants in 41 states representing 85 gigawatts have been announced or are in development. If ultimately built, this new generation would increase annual U.S. coal requirements by some 300 million tons.

Coal is by far the highest-volume single commodity carried by rail, and railroads are moving more coal today than at any time during their history. In 2005, Class I carriers originated 7.20 million carloads of coal (23 percent of total carloads), equal to 804 million tons (42 percent of total tonnage). Coal has long been a major source of rail revenue as well. Class I gross revenue from coal in 2005 was $9.4 billion, or 20 percent of total gross revenue. Coal is also carried by dozens of non-Class I railroads.

In light of current capacity and service issues, some shippers and others have inappropriately blamed railroads for not having enough infrastructure, workers, or equipment in place to handle the surge in traffic. Perhaps railroads and their customers could have done a better job of forecasting and preparing for the sharply higher traffic volumes of recent years. But to contend that railroads can afford to have significant amounts of spare capacity on hand ‘just in case’—or that shippers would be willing to pay for it, or capital providers willing to finance it—is completely unrealistic. Like other companies, railroads try to build and staff for the business at hand or expected to soon be at hand. ‘‘Build it and they will come’’ is not a winning strategy for freight railroads.

In part, this is because long-lived rail infrastructure installed long ago was often designed for types and quantities of traffic, and origin and destination locations, that are dramatically different than those that exist today. For example, only within the last two decades has Powder River Basin coal taken on

Similarly, the explosive growth of rail intermodal traffic is mainly a phenomenon of the past 20 years.

When business is unexpectedly strong, railroads cannot expand capacity as quickly as they might like. Locomotives, for example, can take a year or more to be delivered following their order; new entry-level employees take six months or more to become hired, trained, and qualified; and it can take a year or more to plan and build, say, a new siding. And, of course, before investments in these types of capacity enhancements are made, railroads must be confident that traffic and revenue will remain high enough to justify the enhancements for the long term, and that the investment will produce benefits greater than the scores of alternative possible investment projects.

STEVEN JACKSON. Our experience suggests that the supply chain is very fragile and any event weather related or otherwise that disrupts this supply line could quickly cause a major reduction in supply and inventory levels during the time of greatest needs and highest replacement costs.

Posted in Blackouts, Coal, Interdependencies, Railroads, Transportation Infrastructure | Tagged , , , , , , | Comments Off on Coal power plants depend on railroads to deliver coal