Should America Export Oil? Senate hearings 2014-2015

[ There are excerpts from two senate hearings on exporting crude oil below. Much of the testimony is either from industries that will make money off of exports, or industries that will lose money because they use (cheap) oil as a feedstock (and energy source) for their products (i.e. plastics, fertilizers, petrochemicals). Several says exports will keep Europe and other nations within our sphere and not drive them towards being kind to Russia so they don’t freeze to death in the winter.  

They all assume that  fracked oil has made us energy independent.Harold Hamm, CEO at Continental resources proclaims that America has centuries of natural gas, that we’ll be energy independent in oil within this decade, and that this shows how wrong “the popular believe [was] that the United States would be running out of oil and gas at the turn of the 21st century”.

Peak oil does not mean “running out of oil”, but when oil production begins to inexorably decline globally.  Clearly this will happen because oil is finite.  For example, last year, only enough new oil was discovered to supply one month of global consumption.  And conventional oil, which is 90% of our oil supply, peaked in 2005, with over half of it coming from just 500 giant oil fields. It is likely that global conventional oil from these giant fields will be declining at 9% or more by 2030, and non-giants at even higher rates, so in just 14 years we could be down to half as much conventional oil production, with very little tar sand, fracked oil, and no arctic oil (takes 30+ years to begin production) to replace it.  There is a risk we didn’t prepare 20 years ahead of time as Hirsch recommended in his 2005 peak oil report for the Department of energy.

The only person who calls energy independence into question is Daniel Weiss at the Center for American Progress, who says “This energy abundance could be a temporary phenomenon. Although domestic production has significantly grown over the past 5 years, the Energy Information Administration projects that crude oil production will peak in 2019 and begin a steady decline after that…. My view is we need to focus on reducing our demand because that is something we do have control over.”

It’s not in the public interest to export oil. Someday the few other nations that still produce excess oil may stop exporting it to keep for their own populations, or terrorists might block chokepoints, leaving us reliant on our own oil.

But you’ve got to love Capitalism!  After all, that’s what happens when resources like oil, coal, and natural gas, that should have been publicly owned, are put into private hands.  Capitalism is the best possible way to deplete any given resource as quickly as possible and then go bankrupt before having to pay for the cleanup of toxic waste left behind. 

Alice Friedemann  www.energyskeptic.com  Author of Life After Fossil Fuels: A Reality Check on Alternative Energy; When Trucks Stop Running: Energy and the Future of Transportation”, Barriers to Making Algal Biofuels, & “Crunch! Whole Grain Artisan Chips and Crackers”.  Women in ecology  Podcasts: WGBH, Financial Sense, Jore, Planet: Critical, Crazy Town, Collapse Chronicles, Derrick Jensen, Practical Prepping, Kunstler 253 &278, Peak Prosperity,  Index of best energyskeptic posts

***

Senate 114-17. March 19, 2015.  U.S. Crude oil export policy. U.S. Senate. 150 pages.

CHARLES T. DREVNA, PRESIDENT, AMERICAN FUEL & PETROCHEMICAL MANUFACTURERS

We’ve been lurching from energy crisis to energy crisis for as long as most of us can probably remember.

MARIA CANTWELL, U.S. SENATOR FROM WASHINGTON

Teddy Roosevelt in his Administration Papers on Conservation of Minerals in 1909. Teddy Roosevelt’s Administration found, ‘‘The greatest waste of petroleum has been in exporting crude petroleum and petroleum products to foreign countries. The necessity for it has been due to the sudden increase of production due to the discovery and immediate development of large fields and only by this means has it been possible for the producers to continue to obtain a constant market for petroleum where ever produced. This immediate purchase of product has meant a gain of millions of dollars to the producers.’’ I think the same observation is relevant today.

The U.S. Congress banned the export of crude oil in 1975 after oil exporting nations had used their export capacity as an economic weapon which caused serious damage to the U.S. and to the global economy. Since that time there has never been a reason to revisit the ban. For decades we, in Congress, have debated the best ways to deal with our country’s ever increasing dependence on imported foreign oil. Within the last decade we actually started to see that situation reverse as we started consuming less, producing more and importing less.

Now the oil industry is asking to repeal the export ban. As our oil industry producers produce more at home but our consumption stays relatively flat, our industry wants to sell American oil into the foreign markets where it can get a higher price. But let’s be clear about this.

The United States is and will remain a net oil importer. As we talk about whether we should export oil, we need to keep in mind that for every barrel of oil we export we will be importing even more.

The question before us today is whether this policy change will be in the interest of the American people. As policy makers our obligation is not to any particular industry nor to any particular economic theory. Our responsibility is to decide what policies provide the greatest good to the greatest number of people. As we consider these questions of whether this export ban is still the right policy for America, I think we should think about three variables. First, price. Economic effects of oil and gas prices ripple through our economy. Lower oil prices act like a tax cut for the vast majority of Americans. No one wants to see the price at the pump go up, not in my State of Washington or I’m sure throughout the country. In a published poll this week by Allstate in the National Journal Heartland Monitor, 79 percent of Americans said the current price drop has made a difference in their financial situation. The same percentage of respondents said they are using what they save at the pump daily for other necessities or paying down debt. I would rather have Americans get their own fiscal house in order verses more at the pump for their transportation needs. Second, safety. The oil is moving around our country in ways that we never anticipated, even just five years ago. Oil production has increased faster than the infrastructure needed to transport it in the safest ways. My state currently has tens of thousands of barreled oil traveling through every major population center of our state. And I want to be clear about this. We currently do not have the regulations on the books to safely transport this product. I am going to be working for further measures to make sure that we do get those standards in place. Third, energy security. No one consumes oil. We consume gasoline, diesel and other products that are made from oil. If we are sending oil abroad while some regions of our country then have to import gasoline, diesel and home heating oil, that were refined someplace else are we exporting

CARLOS PASCUAL, FELLOW, CENTER ON GLOBAL ENERGY POLICY, COLUMBIA UNIVERSITY, SENIOR VICE PRESIDENT, HIS: I want to address why eliminating the export ban on crude oil will create jobs, raise incomes, stimulate economic growth, lower gasoline prices and strengthen our national security and American influence in the world. From my experience I have seen that lifting the export ban would increase U.S. credibility and leverage in convincing international partners to adopt policies that mirror U.S. interests on Iran, Russia, free trade and even the environment. The ban on crude oil exports is an anachronism that grew out of a period of scarcity in the 1970s. The United States now has the fastest growing oil economy in the world. Since 2008 the U.S. crude oil output increased by 81 percent. This increase exceeds the combined production gains from the rest of the world. The conditions that justify the crude oil export ban in 1973 no longer apply.

RYAN LANCE, CHAIRMAN AND CEO, CONOCOPHILLIPS After decades of declining production our national fortunes are truly changing. This energy renaissance has benefited our country both domestically and geopolitically. We really have shifted the oil market’s center of gravity away from unstable sources. Even as President Obama said, ‘‘America is number one in oil and gas.’’ We have a bright energy future. That’s a new concept for us. We did it through American-made technology and ingenuity, but there is a problem. We’re producing more oil than our refineries can process economically. They could install new condensate splitters to process more light oil, but that could cost, on average, $400 million per refinery.

CHARLES T. DREVNA, PRESIDENT, AMERICAN FUEL & PETROCHEMICAL MANUFACTURERS

Debate should be grounded in fact. To that point I’d like to describe a survey we released yesterday that simply asked our members what they are doing and what their plans are in the near term to deal with this new light crude oil. In other words, this survey is not based on modeling or hypothetical scenarios, but on actual refiner’s plans. Bottom line. The refiners plan to increase their use of their light, sweet crude by over 730,000 barrels a day from 2014 through ’16. This is more than EIA’s projected increase for that time frame. The survey also pointed out the importance of being able to access the new production. For the refiners getting the crude has been much more of a bigger issue than refining it. If logistics were not an issue, respondents could process 1.5 billion barrels a day more crude in 2016 than they did in 2014 without any further investments than they already have in the works today.

The survey asked about the logistic activities to get new production to refineries. Most crude delivery was actually from the Bakken region where, in North Dakota, not surprising since this was a new region never connected to the refining system. But old regions in the Permian and the Eagle Ford areas in Texas also had significant crude delivery activities.

While these old regions had some delivery infrastructure problems, or infrastructure in place I should say, the reinvigorated production required some more infrastructure to get it to refiners. These results underscore, once again, that policies facilitating

Senate 113-355. January 30, 2014. Crude oil exports. U.S. Senate. 67 pages.

HON. RON WYDEN, U.S. SENATOR FROM OREGON. The fact is energy is not the same thing as blueberries and accordingly it is treated differently under Federal law. The Energy Policy and Conservation Act allows for the export of crude oil only when doing so is in the national interest. There simply isn’t that kind of requirement for blueberries or other commodities. National security, of course, is involved when Americans talk about exporting energy. Right now there are several armed conflicts around the world, in South Sudan, Libya, Mozambique and elsewhere that are certainly being inflamed by fights to control oil. Now I’ll put Oregon blueberries up against just about anything. But the last time I looked, nobody is fighting a war over blueberries. It’s hard to believe that only a few years after campaigns for America’s energy independence, having been dominated by slogans such as ‘‘drill, baby, drill,’’ our country now finds itself having a serious discussion on whether it should export crude oil. Energy independence has been a well-worn staple of virtually every politician’s energy speech for decades. Now our country is in the enviable position of having choices about our energy future.

In any energy debate it’s never very hard to find a voice for the various regions of America, for various industries in America and for various ideological points of view in America. Consumers, however, often don’t have one. I just want it understood that on my watch, the consumer is not going to get short shrift. Now it looks like a number of influential voices want to start exporting oil. I just want to hammer home the point this morning that, for me, the litmus test is how middle class families are going to be affected by changing our country’s policy on oil exports. It is not enough to say some algorithm determines exports are good for the Gross Domestic Product or some other abstract concept. American families and American businesses deserve to know what exports would mean for their specific needs when they fill up at the pump or get their delivery of heating oil. Simply charging forward and hoping for the best is not the way you get the best policy decisions. The responsibility of our committee, and we have always worked on these issues in a bipartisan way, is to make sure consumers are not going to get hammered by the cost of gas going up because of some theory that everything is just going to turn out hunky dory in the end.

We’ve all heard about how it’s a global price. I’m sure we’re going to hear that again today. But a global price does not automatically mean a stable price. If oil stops flowing from Saudi Arabia next week, American consumers and businesses would feel it in a hurry.

HAROLD HAMM, CHAIRMAN AND CHIEF EXECUTIVE OFFICER, CONTINENTAL RESOURCES, INC., OKLAHOMA CITY, OK.

In October 2011 DEPA put a stake in the ground and predicted American energy independence by 2020. America’s independent oil and gas producers have unlocked the technology and resources that made this a reality, not the majors. As a result we can today mark the recent 40th anniversary of the OPEC oil embargo by ending their oil scarcity in America and along with it ending the last short sighted regulation passed during that same period.

  • America now counts their natural gas supplies in centuries.
  • Experts agree we’ll be energy independent in terms of crude oil within this decade. This phenomenon was brought about by a group of independent American producers and missed by the general consensus of the industry.
  • It was in complete contrast to the popular belief that the United States would be running out of oil and gas at the turn of the 21st century.

GRAEME BURNETT, SENIOR VICE PRESIDENT, DELTA AIR LINES, ATLANTA, GA

Behind the U.S. military, Delta is the largest user of jet fuel in the world and jet fuel is our largest expense. Because of this we are uniquely situated both as an end user of crude oil and as a refiner to comment on the crude oil export ban and the current debate over whether to lift it. We believe strongly that the ban on U.S. crude oil exports is good policy and that lifting export limits now would come at the expense at the American consumer, who would pay more for gasoline, more for heating oil and more for the price of an airline ticket. Today the going price for a barrel of U.S. crude is $11 less than a barrel sold in Europe. This price differential can be easily explained. The U.S. crude market is a competitive one with price determined by supply and demand. Once the U.S. domestic market incorporated the increased supply of crude from places like North Dakota, the price of a domestic barrel of oil came down.

It’s clear who gains from this scenario. The oil exploration and production companies, many of which are foreign owned. With the increased supply of U.S. crude helping to push prices down these companies want to sell U.S. crude on the global market at higher prices largely determined by OPEC.

Our country’s refinery workers also stand to lose from lifting export limits. Some recent history can help explain why. Before the shale oil boom there was too much capacity in the refineries in the Northeast, along the Gulf Coast and many were closing. In fact Delta purchased its Pennsylvania refinery in 2012 from ConocoPhilips after their facility had been closed nearly 1 year. The shale oil revolution breathed new life into U.S. refineries and created jobs for thousands of refinery workers. In thinking about the merits of the export ban we should also consider one of its goals, which was to help achieve energy independence. By independence I mean the ability to meet our energy needs from sources within North America. Notwithstanding the upswing in domestic production this country still imports around 33 percent of its daily crude oil needs from outside of North America. That’s why exporting U.S. crude makes little sense. If we allow for the export of U.S. crude we’ll have to import more oil from overseas and subject ourselves once again to an increasing degree of price volatility and higher global prices. In sum, the export ban works.

AMY MYERS JAFFE, EXECUTIVE DIRECTOR OF ENERGY AND SUSTAINABILITY, INSTITUTE OF TRANSPORTATION STUDIES, GRADUATE SCHOOL OF MANAGEMENT, UNIVERSITY OF CALIFORNIA, DAVIS, CA

[She makes long POLITICAL arguments about why we should export to Europe to weaken adversaries such as Iran and Russia] Another senator characterized her point of view as: What is your opinion of Ms. Myers Jaffe’s argument that U.S. crude exports, used as a tool of geopolitics, may have the effect of reducing volatility in the global oil market, much of which is driven by geopolitical conflicts?

What we’re really discussing is No. 1, what is the best way to organize free markets and to eliminate distortions and who gets the profit from the exports. Will the refining industry get the profits from the export or the upstream oil and gas industry get the profits from the export or will other industries get the profits from the exports because we’re not in here to discuss banning all energy exports from the United States.

Because we have physical bottlenecks that prevent us from exporting our surplus of natural gas we are currently exporting coal. We need to understand that when you block, like the little boy with the finger in the dike, when you block a hole in one point of the dike, water pressure comes to another point in the dike and something will be exported that’s a different thing. I think the natural gas example is the best example because nobody expected the United States, with its best, new abundance of natural gas and the industry and lower electricity prices that it is promoting, nobody expected the result of that to be the export of coal to Europe. I’m just returning from the World Economic Forum in Davos. I can tell you that the entire discussion focused around Europe’s need to reevaluate their entire energy policies because they are importing coal. Their emissions are going up. They are not drilling for natural gas. They realized that they have these huge distortions that have created a great economic advantage for the U.S. economy and a great disadvantage for the European economic system.

I want to remind the committee and our public that when we had a temporary disruption gas land supply during Hurricane Rita and Katrina as Senator Landrieu might remember, Europe loaned us gasoline supplies from their mandatory strategic stocks that they require industry to hold. That is how we weathered through our crisis. We need to consider our relationship with our allies like Europe when we think about our future export policies.

Energy exports will weaken some of our adversaries such as Iran and Russia. US shale gas has already played a key role in weakening Russia’s ability to wield an energy weapon over its European customers by displacement.

Energy exports also improve our balance of trade.

DANIEL J. WEISS, SENIOR FELLOW AND DIRECTOR OF CLIMATE STRATEGY, CENTER FOR AMERICAN PROGRESS

Since 2008 the United States has produced more and used less oil due to advances in drilling technology, innovatingly employed by Mr. Hamm and his company and due to more efficient vehicles. This reduced oil imports and lowered our vulnerability to a foreign oil supply disruption that could cause a gasoline price spike. Lifting the ban on crude oil exports could squander this recently improved energy security and price stability. To maintain these benefits we urge you to defend the existing domestic crude oil export ban.

Although domestic production has significantly grown over the past 5 years, the Energy Information Administration projects that crude oil crude oil production will peak in 2019 and begin a steady decline after that.

This energy abundance could be a temporary phenomenon.

The EIA also predicts that in 2014 the U.S. will consume 5 million barrels per day more of oil and liquids than we produce. This gap between demand and supply will continue at least through 2040 growing by 13 percent. This is hardly energy independence.

Our transportation system is almost entirely powered by oil which makes crude oil different from many other commodities. American families, the economy and our energy security are vulnerable to sudden foreign oil supply disruptions and price spikes.

The U.S. imports more oil from the Organization of Petroleum Exporting Countries (OPEC) than from any other single source. OPEC oil is very vulnerable to supply disruptions. EIA found that interruptions may occur frequently… for a variety of reasons, including conflicts [and] natural disasters… Total outages among the Organization of the Petroleum Exporting Countries (OPEC) producers recently rose to historically high levels.9

A commission of retired senior U.S. military officers recently noted that ‘‘No matter how close the country comes to oil self-sufficiency, volatility in the global oil market will remain a serious concern.’’10 Oil produced in the United States is significantly less vulnerable to supply disruptions and therefore provides more energy security. There is little benefit to Americans from lifting the ban, particularly since oil companies are already making huge profits even with it. The five largest oil companies—BP, Chevron, ConocoPhillips, ExxonMobil, and Shell—made a combined total profit of $1 trillion over the last decade, based on their quarterly financial reports.11

I think all discussion about energy independence or almost all of it is focused on supply. That is something we control some of and some we don’t.

My view is we need to focus on reducing our demand because that is something we do have control over. It will help save consumers money. It will help reduce the carbon pollution that will cause extreme weather, that will disrupt our energy production and transportation system. So I think we need to really focus on reducing demand. Particularly when it comes to transportation which is fueled over 90 percent by oil, we need to invest in alternatives to oil whether it’s electric vehicles, whether it is natural gas fueled trucks, whether it is public transportation, advanced biofuels. All of those things will give consumer choices so we are not solely dependent on this one fuel to run, essentially run, our economy because as long as we are we’ll still be here having discussions about energy security and energy independence.

The Energy Information Administration (EIA) recently found that Organization of the Petroleum Exporting Countries (OPEC) supply disruptions in 2013 reduced the anticipated growth in world global fuels supply. EIA reported this finding in the just published ‘‘Short-Term Energy Outlook Supplement: Uncertainties in the Short-Term Global Petroleum and Other Liquids Supply Forecast.’’1 EIA determined that In January 2013, EIA’s Short-Term Energy Outlook (STEO) projected that global liquid fuels supply growth would average 1.0 million bbl/d in 2013, but EIA’s latest estimate shows that global supply grew by about 0.6 million bbl/d in 2013. The difference mainly reflects higher-than-expected unplanned supply disruptions among OPEC producers.2 This same analysis found that OPEC disruptions increased in the second half of 2013, reaching 2.6 million bbl/d by the end of the year because of increased disruptions in Libya. The issues underpinning the outages in these countries are unresolved, resulting in uncertain oil production outlooks for these countries.3

As the production of U.S. oil has grown, the importation of foreign oil has declined from 57 percent in 2008 to 40 percent in 2013.4    [my comment: THAT’S JUST 17%]

This includes a 35 percent reduction in crude oil imports from OPEC since 2008, which was the second largest amount of imports since 1973.5 As U.S. domestic production continues to grow, EIA projects OPEC crude oil imports will decline by 47 percent between 2013 and 2020.6 Despite the important growth in domestic oil production, the U.S. will consume over 5 million barrels of oil and liquids per day in 2014 compared to the amount it produces.7

Unless there are large reductions in demand, the demand-supply gap will grow if the U.S. exports crude oil and liquids. This gap could be filled by oil from both OPEC and non-OPEC nations. If the U.S. begins to export significantly more oil than it did in 2013, it would have to import oil to offset the exports. Oil companies would like to export ‘‘lighter’’ crude oil because there has been a slight increase in light oil production in the U.S. over the past few years.89 In 2013, EIA reported that domestic crude oil was light, with an average API gravity of 35.3. Imported oil was intermediate, with an average API gravity of 28.10 EIA projects that the increase in domestic production will ‘‘replace imports of medium and heavy crude.’’11 If exports were allowed, refiners could import slightly heavier oil as they were before the domestic production increase began in 2009. The three largest importers of heavy oil are Canada, Mexico, and Venezuela, with average imports of 2.6 million barrels per day (mbd), 1.0 mbd, and .8 mbd, respectively, during the first 11 months of 2013.12 Presumably, some of the increase in heavier crude oil to offset any domestic exports will come from Venezuela, which is a member of OPEC. I am not aware of any projections of changes in future oil imports from these three nations if the crude oil export ban is lifted.

As you note, much of the price volatility in the global oil market ‘‘is driven by geopolitical conflicts.’’ I am not an expert in the regional conflicts in the Middle East, Africa, or other oil producing regions. However, even from my lay person’s perspective it seems that ancient sectarian disagreements, government repression, joblessness, and vast disparities of wealth in these nations are a major part of many of these conflicts. It is difficult to imagine, for instance, that the export of one million barrels of oil per day from the U.S. would have much impact on these factors.

In October, New York became the first state to establish a ‘‘strategic gasoline reserve’’ to prevent serious supply disruptions during extreme weather events or other emergencies.34

Amy Myers Jaffe recently promoted a mandate to ensure a certain amount of refined product inventories. She wrote: Regulators [should] mandate a minimum level of mandatory refined product inventories in the United States. Such a system exists in Europe and Japan and allowed Europe the flexibility to provide gasoline to the United States during the production shortfalls that occurred following Katrina and Rita, preventing worse dislocations. The system helped Japan in the aftermath of the Fukushima crisis.

New York plans to store up to 3 million gallons of gasoline for first responders and other motorists. Establishment of additional reserves could supply gasoline in other states in the event of future supply disruptions. Because of technical limitations on storing significant amounts of gasoline for long periods of time, there would probably have to be multiple smaller reserves rather than several large reserves, as with the Strategic Petroleum Reserve. The Senate Energy Committee should explore the need for such gasoline reserves, as well as the technical and economic feasibility of building and maintaining them.

A US government program reserving the right to use for strategic national emergency releases a portion of this mandated minimum supplementary industry refined product stocks of 5% or 10% of each refining company’s average customer demand would ensure that needed supplies of gasoline or heating oil in inventory to ease the impact of sudden weather related demand surges or accidental disruption of consumer supplies.35 I believe that this proposal would help address future extreme weather or other unforeseen events that cause gasoline supply disruptions.

some of the citations:

1 Energy Information Administration, Short-Term Energy Outlook Supplement: Uncertainties in the Short-Term Global Petroleum and Other Liquids Supply Forecast (U.S. Department of Energy, 2014), available at http://www.eia.gov/forecasts/steo/special/pdf/2014lspl01.pdf.

2 Ibid 3Ibid

4Energy Information Administration, AEO2014 Early Release Overview (U.S. Department of Energy, 2013), available at http://www.eia.gov/forecasts/aeo/er/pdf/0383er%282014%29.pdf.

5Energy Information Administration, ‘‘U.S. Imports from OPEC Countries of Crude Oil,’’ available at http://www.eia.gov/dnav/pet/hist/LeafHandler.ashx?n=pet&s=mcrimxx2&f=a (last accessed February 2014).

6Energy Information Administration, ‘‘Imported Liquids by Source, Reference case,’’ available at http://www.eia.gov/oiaf/aeo/tablebrowser/#release=AEO2014ER&subject=8- AEO2014ER&table=101-AEO2014ER&region=0-0&cases=ref2014er-d102413a (last accessed February 2014).

7Energy Information Administration, AEO2014 Early Release Overview (U.S. Department of Energy, 2014), Figure 12, available at http://www.eia.gov/forecasts/aeo/er/ earlylproduction.cfm?src=Petroleum-b2. 8Energy Information Administration, Annual Energy Outlook 2013 (U.S. Department of Energy, 2013), Figure 98, available at http://www.eia.gov/forecasts/aeo/MTlliquidfuels.cfm.

9Crude oil with an API gravity greater than 35.0 is ‘‘light,’’ while oil with an API gravity less than 25.0 is ‘‘heavy.’’ In 2013, EIA reported that domestic crude oil was light, with an API of 35.3. Imported oil was intermediate, with an API of 28.

10Energy Information Administration, Annual Energy Outlook 2013, Figure 98.

11Energy Information Administration, ‘‘WTI-Brent Spread Projected to Average $11 per barrel in 2014,’’ This Week in Petroleum, February 12, 2014, available at http://www.eia.gov/oog/info/ twip/twip.asp.

12Energy Information Administration, ‘‘U.S. Imports by Country of Origin,’’ available at http:// www.eia.gov/dnav/pet/petlmovelimpcusla2lnuslepc0lim0lmbblpdlm.htm (last accessed February 2014).


Posted in U.S. Congress Energy Independence | Tagged , , | 1 Comment

Because we’ve stuffed staggering numbers of cows on factory farms we live in a cow toilet

[ Book review of “Cowed: The hidden impactof 93 million cows” by Alice Friedemann   www.energyskeptic.com  author of “When Trucks Stop Running: Energy and the Future of Transportation”, 2015, Springer]

Hayes, Denis and Gail. 2015. Cowed: The Hidden Impact of 93 Million Cows on America’s Health, Economy, Politics, Culture, and Environment.    W.W. Norton & Company.

I’ve read many books on cows such as Montgomery’s “A Cow’s life: the surprising history of cattle”, Schlosser’s Fast Food Nation, and Pollan’s Omnivore’s Dilemma,  so I hesitated to buy yet another book about cows.  But I’m so glad I did. Not only is the writing lively and interesting, but much has happened in ranching and dairy cattle operations since I last read about cows.  And it’s a big picture view that goes way beyond cattle to the ecosystems they affect.

I have a soft spot for cows after staying on a 200-acre cattle ranch in Belize.  The rancher had a name for each of one of the cows in his herd, and had stories about them all.  They had sweet dispositions and huge liquid brown eyes– I could see how you could come to love them. Towards the end of the first day he confessed he hated to kill them and rarely did — they were his friends.  He made enough money from cashews and other crops so that he could afford not to kill them, and maybe cow “fertilizer” was the secret of his crop success, saving their lives.

My affection for these cows caused me to skim the sections about the horrible ways corporate agriculture treats cows.  I was shocked to learn how little has been done since Temple Grandin and many others brought attention to the brutal way cattle were treated and slaughtered.

The main goal of this book is to get people and their pets to eat less beef so we can cut the number of cattle in half, get rid of concentrated animal feed operations (CAFO), and grass fed cattle to prevent them from turning ranch land into desert, poison aquifers, increase global warming gases, contribute to dead zone eutrophication, and use less fossil fuel energy.

And believe me, you will want to eat only organic grass-fed beef for a long time (hopefully for the rest of your life) after you read this book when you learn about all the hormones, antibiotics, and multidrug-resistant microbes like  Campylobacter, Salmonella, Enterococcus,  E. coli, and Staphylococcus aureus that might be in your next steak or hamburger.

Bad Cows!

Too much finite fossil fuel used:  David & Marcia Pimentel estimate that 40 calories of fossil fuels (mainly oil and natural gas) are used to produce 1 calorie of beef protein when you consider all the fertilizer, pesticides, and fuel required to grow, harvest, and transport cow feed. And top pump the water for drinking or cleaning up the waste of factory farm animals, and processing the water polluted by their feces and urine. And this calculation doesn’t include the energy to transport, process, refrigerate, package, and cook the meat.  Milk is energy intensive too: the ratio for milk is 14 to 1.4.

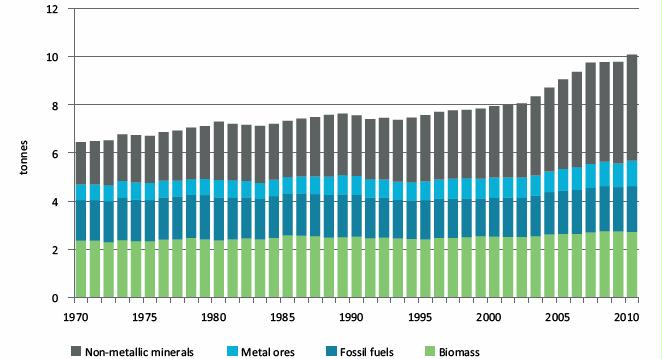
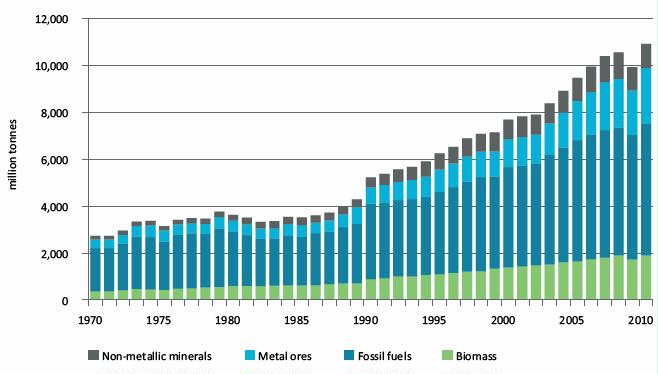
Biodiversity loss.    With 1.65 billion bovines and 7 billion humans consuming 40% of Earth’s net primary production, we’re not leaving much food or land for all the other life on the planet.  The biomass of farm animals, especially cattle, weighs over 20 times the zoomass of all wild vertebrates. If human and farm animal populations grow another 50% we’ll wipe out most of the remaining life forms on the planet.

The Dust Bowl: Homesteaders and their oxen plowed up the prairies to plant annual wheat and corn, which transpired more water than deep-rooted perennial prairie.   The result was the Dust Bowl of the 1930s, when 5 million inches of topsoil across 10 million acres that took thousands of years to build up blew away.  In many areas, that was more than three-fourths of the topsoil.

The Ogallala is one of Earth’s largest aquifers, the water used in the 10 great Plains states that provides a third of all groundwater used to irrigate to grow a fifth of our food and 40% of the grain for grain-fed beef .  Over the last century, however, we’ve pumped out two-thirds of the total water, enough to fill Lake Erie.  Many geologists expect most of the Ogallala to run out of water in 25 to 30 years, and perhaps run out of “usable” water as soon as 2020.  The fossil water in the Ogallala is not renewable. Over the years, water levels have fallen by more than one hundred feet in parts of four states. The “tragedy of the commons” is writ large over the Ogallala. Like climate disruption, aquifer depletion is the type of problem that human minds aren’t well designed to handle: The problem spans generations, conditions are only gradually worsening, and most people find it in their short-term interest to behave in ways that benefit them but harm future generations. Underground water ignores property lines, so there’s no way to conserve the water under your land unless all your neighbors do the same. Therefore, it seems logical to pump out as much water as hard and fast as you can, because otherwise your neighbors will pump it out.

1.1 billion tons of manure and piss every year.   If this could be used as fertilizer instead of energy-intensive natural gas-based fertilizers, we’d save a lot of energy and build up healthy soils.   But little is,

because raw manure is expensive to truck more than about six miles. And chances are the farms next door also have cows, or prefer commercial fertilizer for a known amount of nutrients and lack of smell. Instead, there are tens of thousands of “lagoons” full of untreated manure and piss sewage containing chemicals, hormones, antibiotics and other drugs, heavy metals, pesticides, herbicides, salts, and disease causing microorganisms. Each ton can be 110 times more polluting (as far as biochemical oxygen demand) than raw municipal sewage. Concentrated livestock and poultry produce 3 times more raw waste than humans.  Cows poop about a dozen times a day.   Lagoons can overflow and pollute aquifers and waterways with excessive nutrients.

Cows are polluting the Ogallala (and other aquifers). The aquifer’s water was once of such fine quality that you could drink it unfiltered and untreated. Now, however, the EPA says that pesticides, fertilizers, feedlot wastes, trace metals, and volatile organic compounds have contaminated much of it.

Climate Change. Feed production and processing, the fermentation that goes on inside cows, and the decomposition of cow manure release three warming gases: carbon dioxide, methane, and nitrous oxide.   In 2013 the Food and Agriculture Organization of the United Nations in 2013 concluded that livestock account for 14.5% of anthropogenic  greenhouse gas. Beef cattle are responsible for 41% of livestock emissions, milk cows for another 19%.

Topsoil destruction. “Earth is unique among known space rocks in that it has a thin skin of living dirt. Without dirt there would be neither cows nor humans. Earth has three major regions of fertile loess soils: our Midwest, northern Europe, and northern China. (Loess is easily crumbled buff to brown dirt made of clay, silt, and sand.) These regions provide the bulk of the world’s grain. On the Great Plains, it takes Mother Nature five hundred years to replace one lost inch of loess soil. In North America, 66% of soil loss comes from agricultural activities and another 30% from overgrazing.

Diseases. For centuries the greatest threat to humans from cows was tuberculosis  (though not any more).  In 1900 TB was second only to pneumonia as a cause of death in the U.S.  “It’s bacterial, not viral, diseases that present the greatest threat from factory farms. Cows crowded together stand withers-to-withers in feces and puddles of urine; their hooves, legs, and udders become caked with filth. Clouds of flies buzz around them. Standing in feces and eating a high-grain diet causes cows’ “toes” to grow and curl up, and cattle become lame. An environment that is hell for cows is paradise for germs. Filth on cows’ hides and intestines gets mixed in with their meat during slaughter. Prior to the era of factory farms and pasteurization, bacterial diseases frequently spread from cows to humans. Unpasteurized cow milk was once a common source of typhoid fever, scarlet fever, and diphtheria. Other bacterial diseases that affect both cows and people are anthrax, brucellosis, campylobacteriosis, leptospirosis, listeriosis, and Q fever. Some researchers think the infectious agent that causes Johne’s (pronounced YO-knees) disease in dairy cattle might cause Crohn’s disease in humans.  Today, however, salmonella is the food-borne bacterium that causes the most hospitalizations and deaths, and factory farms are incubators for some of the most dangerous strains. “

Antibiotic Resistance. You are probably aware that a crisis looms ahead as more and more microbes become antibiotic resistant.  A major way this is happening is from the healthy animals in factory farms, who consume 80% of all antibiotics to gain more weight and prevent disease.  Grass-fed cows rarely need antibiotics, but bacteria flourish in cows eating corn (which makes them very sick), so they are given antibiotics.  They are also getting antibiotics for corn another way: from ethanol production. A byproduct of ethanol is Dried Distillers Grain (DDG), which is fed to factory farm animals.  But it is often contaminated with Lactobacilli which thrive in the ethanol mash it comes from. So ethanol producers add antibiotics like penicillin and erythromycin to the fermentation tanks.  When factory farm animals eat DDG, they are also eating illegal antibiotics (Olmstead 2012, Laskawy 2012, McKenna 2012).  Since up to 80% of antibiotics can pass through cows intact the end up in soil, water, and groundwater, and can spread to drinking water.

Corn-fed cattle vulnerability. The Hayes explain how it ever came to be that cows ate corn in the first place, since it is so harmful to their health, and wasteful in many ways when there’s grass growing for free, which also makes their meat healthier for human consumption.  In the end America is so dependent on the corn to feed cattle and make ethanol that we’d be very vulnerable if our monoculture corn crops succumbed to disease, drought, or other problems.

Diseases from milk. “When bulk tank samples of raw milk were tested in recent years, pathogenic organisms were found in 0.87 to 12.6% of samples.  Early in the 20th century, the diseases people commonly got from consuming raw milk products were brucellosis, diphtheria, typhoid, and tuberculosis. Today the danger is more about salmonella, listeriosis, and diseases caused by Campylobacter jejuni and E. coli O157.”

Crohn’s disease. “A few types of bacteria can survive pasteurization. One is Mycobacterium avium subspecies paratuberculosis (MAP), which causes Johne’s disease in cows. It might also be connected with Crohn’s disease in humans, although this theory is controversial. Crohn’s causes inflammation of the gastrointestinal tract and torments over half a million Americans with diarrhea, abdominal pain, and vomiting. There is no cure. A genetic predisposition, an infectious agent, and exposure to things in the environment are all implicated in Crohn’s. Curiously, this disease only showed up in the twentieth century, and the incidence is rising.   In 2007, the USDA’s Animal and Plant Health Inspection Service found that in nearly a quarter of dairy operations surveyed, at least 10% of the cows were infected with Johne’s. Scientists on both sides of this controversy present strong cases. A study of 40 Crohn’s patients and 40 persons without the disease found that the Crohn’s patients had many more MAP bacteria in their guts than the control group.  Clusters of Crohn’s disease patients have been correlated with MAP in water supplies (chlorination doesn’t kill MAP).   On the other hand, when tissue from Crohn’s patients is compared to tissue from cows with Johne’s, differences are found. And people who work with cows don’t seem any more likely to get Crohn’s than other people. The MAP organisms found in Crohn’s patients may simply be bystanders in a sick bowel. A good review of this issue can be found online at the University of Wisconsin Johne’s Information Center.

Milk Terrorism.   Stanford University explained why milk was an ideal target for biological terrorism if infected with botulinum neurotoxin (a.k.a. Botox), the most toxic biological substance known. It blocks neuromuscular transmission and is quite easy to obtain (Wein 2005). “Every year, six billion gallons of milk are pooled at various stages of collection and shipped around the country for rapid consumption. A terrorist could pour a few grams of botulinum toxin into a milk tank on one or more farms. The contaminated milk would be taken to a factory and poured into a raw-milk silo along with milk from other farms. From there it would flow into an even larger product stream. One-millionth of a gram of botulinum toxin can kill an adult. This scenario holds the possibility of killing hundreds of thousands of people, Wein and Liu believe, most of them children”.


Milk hormones. Pregnant cows produce 33 times more natural estrogen than when they’re not pregnant, so milk has a lot of estrogen in it – the source of 60 to 80% of the estrogen and progesterone we consume.   Too much estrogen in male bodies affects their reproductive systems — only 1% of donors of sperm in Israel are healthy and although it is a mystery, some scientists think that dairy products could be to blame.  Excess estrogen may also increase the risk of ovarian, breast, prostate, and testicular cancers.  Growth hormone rBGH has been banned in the European Union, Japan, Australia, and Canada (for good reasons explained in the book), but it’s still allowed in milk in America.  Cows also have endocrine disruptors, probably from perchlorate in water and the pesticides in cow feed, which then accumulate in their fat. Other endocrine disruptors found in cow feed include the five leading herbicides applied to corn and soy in the United States: atrazine; glyphosate; 2,4-D; acetochlor; and metolachlor cows’ fat.


Unhealthy Beef.   Beef has inflammatory heme iron, and processed beef like hot dogs has nitrates and nitrites that can lead to cancer and hardened arteries, salt that can raise blood pressure, carnitine that gut bacteria turn into TMAO which makes it harder to get rid of cholesterol and for cholesterol to bind to artery walls.  Beef has saturated fat that can lead to heart disease and obesity.


Mad Cow Disease (BSE).  It hasn’t gone away, and the Hayes make a good case that it isn’t being tested for properly.  First, farmers aren’t required to have the USDA test downer cows. It’s voluntary.  Since there is no penalty for not testing, and because all hell would break loose if the test was positive, beef producers have a saying “Shoot, shovel, and shut up”.  Second, farms have been prevented from testing their cattle by the USDA.  And more.  Mad cow didn’t just jump species to us – it also killed cats.

In Britain 179,000 cows were known to have the disease, but over 4.4 million cows had to be killed to stop the epidemic and convince people beef and dairy were safe to eat again.


Humans may also have prion diseases similar to Mad Cow.  Maybe so – of 46 patients believed to have Alzheimer’s, autopsies revealed that 6 (13%) of them actually had CJD, and other studies also found up to 5.5% had CJD.   [ My note: I am not sure if the CJD is a human disease or might be coming from cows.]


Prions are truly scary – even after a cow carcass decays it doesn’t destroy the prions, which can bind to clay and minerals and survive in soil for many years, though there’s no evidence that anyone has caught BSE from soil or water.  Even rendering doesn’t destroy prions (rendering is grinding up the animal, cooking it, removing the fat, and drying the remainder into pellets or powder that goes into animal feed, fertilizer, plastics, paint, gelatins, and so on).  It takes incineration at 1,832 F to be sure of destroying prions.


Cow statistics

  • The 93 million cows in the U.S. weigh about 120 billion pounds: 2.5 times as much as humans in America
  • 1% of us have ever milked a cow, even fewer killed one: we are more distant from our food than any civilization
  • We eat too much beef and it’s making us fat and unhealthy
  • Smaller, relatively docile cows were bred from their wild and enormous ancestor, Aurochs, who were driven to extinction, the last ones died in Poland in 1627.
  • There are over 800 breeds of cattle, but most of the cattle represent only a few breeds developed to produce meat and milk, not to survive Great Plains conditions
  • Cattle can breed with bison, yak, banteng, and guar
  • Texas longhorns are a mix of docile eastern cows and nearly wild cattle the Spanish brought over

An unusually long warm and wet spell led to the great days of cattle drives for about 20 years, with herds of about 3,000 cattle driven to rail lines north of Texas by roughly a crew of 10 cowboys.  But dry weather returned, and cattle overgrazed what little grass was left as well as compacting the soil. The lack of vegetation led evaporation, soil erosion, and resulted in desertification. Temperatures ranged from -45 to 110 degrees, killing off half the cattle on the Great Plains died by 1890.

The cowboy myth came about, according to Jennifer Moskowitz, because : [T]he country needed a unifying, nationalist icon to move it beyond the ravages of the Civil War and the Englishness of Southern agrarian society into industrialism and capitalism. . . . Into the West rode the American cowboy, whose mythic figure and setting were equally significant and carefully shaped by authors, artists, and political figures. Ironically . . . the qualities ascribed to the cowboy are identical to those of the English knight.

Here are some more cowboy facts:

  • “Having a horse also mattered. Knight or cowboy, a horse lifts a man into the mythic realm. When mounted, men appear less dwarfed by a big-sky landscape and potentially more dangerous. (This is probably why so many statues and paintings insert a horse under the hero.) Unlike cows, horses hold their heads high, looking proud. It takes skill to ride a horse well. People on foot must literally look up to someone riding a horse.”
  • “Like cows, horses are very large animals, and size matters to cowboys. While researching this book, we talked with a Montana rancher who had experimented with raising Australian Lowline cattle instead of standard Angus cows. His cowboys rebelled—they just didn’t feel right bossing around sweet-natured, hornless, three-and-a-half-foot-tall cows… herding them makes cowboys feel ridiculous”.
  • Despite the movies you’ve seen, cowboys were not white typically, but Hispanic, black, and native American. They weren’t free and self-reliant – nearly all worked for the people who owned the land, working for wages with no union or contract to ensure being paid.

Conclusion

“Because we have stuffed staggering numbers of cows into factory farms, we Americans now live in a cow toilet”.

“As a nation, we eat more cow per capita than do the citizens of any other country except Argentina and Luxembourg.  By dining so heavily on beef, Americans are not only eating high on the food chain but are eating up the food chain itself. We are consuming the environment—the dirt, water, and temperate weather—that keeps us alive. That makes about as much sense as gnawing on our knees for nourishment”.

What to do:

  • Eat bison
  • Eat organic beef, drink organic milk
  • Demand that environmental impact statements be conducted on how cattle is raised and milk produced

REFERENCES

Olmstead, J. May 1, 2012. Bugs in the system: how the FDA fails to regulate antibiotics in ethanol production. IATP.

Laskawy, T. May 2, 2012. Do the feds care about antibiotics in animal feed?. Grist.

Laskawy, T. October 29, 2012. Three reasons to have a cow over antibiotics in your meat. Grist.

McKenna, M. April 10, 2012. Antibiotics in Ethanol Grains: Glass half-empty or half-full? Wired.

Wein, L.M., Liui,Y. July 2005. Analyzing a bioterror attack on the food supply: the case of botulinum toxin in milk. Proceedings of the National Academy of Sciences 102 #28.


BOOK EXCERPTS:

Aurochs (pronounced OR-ox) were formidable.  This majestic beast was the ancestor of the modern cow and its domestication had already begun thousands of years earlier in Persia and, separately, in India.

Aurochs could outrun, outfight, and generally outcompete today’s cows in any competition but the production of milk and marbled meat.  Male aurochs were black with a pale stripe down their spine; females and calves were a fetching reddish hue. A bull could be six feet tall at his shoulders and weigh over a ton.

Aurochs were driven to extinction by loss of habitat to farming and by domesticated cattle that competed with them for food and infected them with diseases. Homo sapiens inflicted the coup de grâce. In addition to eating aurochs, having a fine collection of silver-tipped aurochs-horn cups to drink from implied nice things about one’s status and manhood. Aurochs held out longest in the forests of Poland because only Polish royalty were allowed to hunt them.  The last aurochs died in Poland in 1627.

From cows’ point of view, they domesticated humans. Those cows that found humans who would protect them from predators and provide them with food and water survived and multiplied, eventually outnumbering aurochs. Humans later transported cows to distant continents where cows thrived and their numbers swelled. Today, humans devote an extraordinary percentage of available land, water, grain, and energy to meeting the needs of cows.

Humans who could tolerate lactose (in particular the Kurgan people of Southwest Asia) were more mobile than farmers, because cows are easier to move around than crops. They were also better-fed, because it’s possible to get five times the calories per acre from cows when they are used for milk rather than meat. More warriors therefore could be raised on the same amount of land, and those warriors could hone their skills by stealing cows from other mobile tribes. When attacked by farmers, the milk drinkers could just retreat (along with their cows). When milk drinkers attacked farmers, the farmers couldn’t leave their crops, had fewer warriors, and often lost women to the raiders (along with opportunities to procreate). Thus the genetic alteration that allowed humans to consume milk spread, along with the language of the milk drinkers.

In his thoughtful book Guns, Germs, and Steel, Jared Diamond attributes the ease of European colonial conquest of America to Europeans’ possession of guns and steel, and to the diseases Europeans carried in their bodies, diseases to which indigenous populations had not developed immunity. To this list we would add another key factor: Europeans had cows.

Eventually, feral Iberian cows (cows that had such minimal contact with humans that they were almost wild) in Texas bred with gentler cows from the East. Their progeny, the Texas longhorns, were meatier and more tractable than Iberians yet still had good survival skills. The rapid expansion of Texas longhorns and Texas-style ranching onto the Great Plains after the Civil War coincided with an unusually warm and wet spell. Ranchers overestimated how many cattle the plains could support. Twenty million cattle, in herds of about three thousand head, each with a crew of about ten cowboys, were driven from Texas to railheads in Missouri, Kansas, Nebraska, and Wyoming. This was the time of the great cattle drives along the Shawnee, Chisholm, Western, and Goodnight-Loving trails—drives that inform folklore and fill movie theaters.

But the weather reverted to normal, the grass dried up, and the resulting overgrazing compacted soils and destroyed perennial grasses that cows favored. The loss of vegetation led to more evaporation, erosion, and even desertification. The summer of 1886 saw temperatures as high as 110 degrees Fahrenheit; the following winter temperatures plunged to –45 degrees. Unable to tolerate such extremes, half the cattle on the Great Plains died.

By 1890, Texas-style open-range cattle ranching had collapsed.

Beef cattle have done more to define what it means to be American than have dairy cows (sorry, Jefferson). And it was beef cattle, with their horns and a wicked glint in their eye, that elevated cowboys to role model status. Real cowboys came from the lower stratum of society and labored hard and long, in nasty weather, for little pay. So how did a caste of hired (and sometimes enslaved) laborers, who often didn’t even own their own horses, become cultural heroes? The cowboy myth really caught on after the Civil War. A nation deeply divided was in desperate need of heroes both sides could agree on, and cowboys fit the niche.

Although movie cowboys speak English, many of the real cowboys came from the Spanish/Mexican vaqueros. Others were Native Americans, such as Cherokees dispossessed of their land, and former Negro slaves released by the Civil War. The term “cowpoke” was used before the word “cowboy,” because Hispanic cattle herders poked cows with blunt lances.19 Neither “cowboy” nor “cowpoke” has much inherent romance as a word, but a person who poked cows with a stick for a living might have been beyond even the power of Hollywood to romanticize.

An ox isn’t a separate species. It’s just a castrated bull, or occasionally a female cow, that has been selected and trained to work as a draft animal. Many breeds can make fine oxen. In America, teamsters (men who work oxen) usually pick Chianina, Dutch Belted, Holstein, Jersey, Brown Swiss, Milking Devon, or Milking Shorthorn.  Oxen usually work in pairs, joined by a yoke. Pioneers preferred oxen to pull their covered wagons because oxen were stronger and steadier than horses, and a yoke allowed them to pull far heavier loads. Oxens’ strong, steady pace also made them superior plow animals for clay or rocky soils. Oxen enabled one man to plow enough acreage to grow more than enough food to feed himself

The word “cowpoke” came from the way Hispanic cattle herders kept cows in line by poking them with a blunt stick .

A key element of the myth is that hard work and initiative will pay off. And for pioneers it often did. The frontier gave cowboys and settlers alike a degree of freedom from being controlled by other people. Out on the range, no midlevel manager was at hand to micromanage how the cowboy wound his lasso or to monitor his bathroom breaks. The cowboy lived hard against the elements, and stupidity was quickly and impersonally punished. He was free to use the land as he wished. There was no time to form a committee to reach a consensus on whether to shoot a wolf or put down a cow with a broken leg. A cowboy had to make snap decisions. He lived in a world of white hats and black hats, no shades of gray. The nineteenth-century cowboy, out on the trail for months at a time with just his gun and his horse, was also a model of self-reliance.

When you take a closer look, however, there are gaping holes in the cowboy’s vaunted self-reliance. Nearly all cowboys labored for other people who owned the land and the cows. Cowboys worked for wages, without the protection of a union or even a written contract.

In Culture of Honor: The Psychology of Violence in the South, Richard E. Nisbett and Dov Cohen speculate on why herders are likely to be more individualistic and violent than farmers. Their theory goes something like this: Cows and sheep are easier to steal than food crops, so the herder has to be constantly on guard and able to fend off rustlers. If he is perceived as weak, he’s in trouble, because he often works alone and far from others. In such an environment, arguments are personal, and a culture based on honor (as opposed to conscience) tends to develop. Farmers, in this theory, are more dependent on each other to bring in harvests, raise barns, and the like, so they have more sense of community and less need of violence.

Cowboys’ golden age occurred just after the Civil War, when the United States was in the process of redefining itself. And the cowboy’s Camelot, the era of the great cattle drives, lasted a mere two decades.

Today America is in the early stages of redefining itself again, in a way that recognizes the finite nature of resources on a solitary blue planet. But the cowboy ideal has not yet ridden into the sunset. Today’s ranchers and affiliated businesses take full advantage of this powerful myth, proudly portraying themselves as individualistic loners. A cynic might note, however, that they have been remarkably unified and effective when it comes to fighting for federal subsidies, but against federal regulation.

He could sell his surplus crops or trade them for goods. As a bonus, oxen fertilized his fields. And they were powered by grass. This was a win/win/win setup.

Wearing cowboy boots to work lifts a guy’s spirits. When a governor of Texas recently switched from cowboy boots to shoes, it made the newspapers. According to consumer researcher Russell W. Belk: “The American cowboy heroic myth is invoked by these boots, along with the characteristics associated with this myth, including rugged individualism, independence, quiet strength, and alienation from civilization.”

A positive emotional response to cowboys is practically ingrained in most Americans. When we saw the above photo, we smiled at how well it captures what is attractive about cowboys. Our smiles faded when we learned these men were supporting a rancher who thought he was justified in running his cattle on federal land without paying a fee or obeying the law.

David Archer warns, in The Long Thaw, that humans are putting carbon dioxide into the air that could stay there for centuries, a quarter of it lasting essentially forever.

Globally, the livestock sector accounts for 9 percent of human-caused warming that’s due to increases in the gas carbon dioxide. Most of this comes indirectly, such as from cutting down forests to create pastures and growing feed for cattle. Carbon dioxide is also released during the manufacture of the fertilizers and pesticides that drench the crops used to feed confined cows. Burning fossil fuels to power farm machinery, and to transport cows, meat, feed, water, and cow waste, also creates this gas.

Around 37% of anthropogenic methane comes from livestock, mostly from cows.  Methane is produced when cow manure breaks down. It also comes from cow burps (and a bit from cow farts).

Finally, cows’ manure releases the warming gas nitrous oxide (N2O). Your dentist may have offered you nitrous oxide before a painful procedure. “Laughing gas” induces a feeling of euphoria and brings on a dreamy mental state. Molecule for molecule, nitrous oxide is 310 times more potent than carbon dioxide as a greenhouse gas, and it has an impressive atmospheric lifetime of around 120 years. The livestock sector is responsible for 65 percent of the anthropogenic nitrous oxide in the air, most of which comes from the breakdown of cow manure.

At 92 degrees Fahrenheit and 100 percent relative humidity, cows start dying. Stressed cows need higher-energy-value feed and much more water. Both feed and water are usually in short supply when the heat coincides with drought, as is often the case.

When you fly above the Ogallala, you see that the land below you is covered with giant green polka dots formed by irrigation systems that tap into the aquifer and pivot from a central point. The sprinkler arms are half a mile long, reaching from the pivot point to the edges of one-square-mile sections of land. Revolving over the field like the hands of gigantic clocks, the units cost $180,000 each.

Ogalla Aquifer. Management of this invaluable resource is inconsistent, complex, and scattershot. Decades of withdrawals plus three years of drought have greatly reduced the amount of water that can be pumped from the southern two-thirds. Large parts of southern Kansas, the Oklahoma panhandle, and northwest Texas are already in crisis, and smart farmers are switching from corn to sorghum and cotton in an effort to make the water last longer. Texans can pump all the water they want from beneath their land. Although Texas pioneered the first legal mechanisms to protect mineral owners from having their oil poached by neighbors, the state steadfastly clings to a nineteenth-century view of water allocation. Until recently, billionaire T. Boone Pickens’s Mesa Water company owned the groundwater rights to more than two hundred thousand acres in Roberts County in the north Texas Panhandle. Those rights made Pickens the largest private water owner in the nation. Pickens tried unsuccessfully to sell his water to distant cities like Dallas and San Antonio. To get the necessary eminent domain to run a pipeline and power lines, he created his own town, a town with only two eligible voters. But after a decade of playing footsie with distant cities, he finally sold for less profit than he’d hoped for, to an outfit that will market the water to desperate cities nearby in the Panhandle.  In researching this chapter, we stumbled across a disturbing correlation. We noticed a remarkable similarity between a map showing where concentrated cow-feeding operations are densest and maps of the Ogallala. The entire surface above the precious aquifer is dotted with polluting cattle feedlots (Food & Water Watch. 2007. Factory Farm Map. www.factoryfarmmap.org

“Every second, North America’s largest river carries another dump truck’s load of topsoil to the Caribbean,” writes David R. Montgomery, the winner of a MacArthur “genius” grant and a geomorphologist. He argues convincingly that we are skinning America and warns that we could be undoing the very ground that made us a wealthy nation. More than half of America’s cropland has a slope of at least 2 percent and is thus vulnerable to water erosion when it is plowed ( “Dirt: the erosion of civilization).

There are many ways to conserve soil, including cover crops, buffer zones alongside waterways, contour plowing, crop rotation, no-till planting, mulching, and terracing. Congress occasionally passes a law to reward conservation that enjoys a fleeting success. From 1985 until 1997, because of the “highly erodible land conservation” rules in the 1985 Food Security Act, soil erosion was reduced by 40%. But in 1996, under pressure from Big Ag, Congress greatly weakened those provisions. They did so because soil conservation techniques take marginal land out of production, preventing farmers from maximizing their current income. Because of federal subsidies and the mandated use of ethanol, twenty-five million additional acres have been plowed in the United States since 2007.  At the same time, the Midwest was hit with high-intensity, high-volume rainstorms. The value of the soil washed away was surely greater than the value of the extra grain grown.

Let’s look at what’s happening to Iowa’s dirt. Over the last 150 years, Iowa has lost half its topsoil. Iowa State University scientists working on the Iowa Daily Erosion Project say erosion is worsening and that much more soil is being lost than is acknowledged in the official estimates of the USDA’s Natural Resources Conservation Service (NRCS).  In 2007, more than ten million acres of Iowa farmland eroded faster than the NRCS’s so-called “sustainable” level of five tons per acre per year. Six million acres lost soil at twice the sustainable rate (Cox, C., et al. 2011. Losing Ground, Environmental working group, executive summary)

Sadly, the regions in Iowa with the most fertile soil tend to be those where the highest percentage of farmland is leased. In north central and northwest Iowa, as much as 70% of the acreage is farmed by someone who doesn’t own it.

In 2003, a small group of ranchers, environmentalists, and scientists met to see whether they could find common ground. Exhausted by decades of conflict and litigation, they hoped to find a way to end the acrimony. To their surprise, they discovered that during those years of warfare, each had come to have a greater appreciation of the other’s point of view. The ranchers had almost all drifted into rotational grazing and other holistic practices. The environmentalists, after watching species after species disappear despite their lawsuits, kept encountering small ranchers who were voluntarily managing for biodiversity.

After laying out goals and pledges, they concluded, “with the grace of good fortune, the West may finally create what Wallace Stegner called ‘a society to match its scenery.’” Over time, more and more ranchers found that the Coalition’s “radical center” offered them the home they had been seeking. Membership swelled, joint projects were embarked upon, books were published, and a high-energy annual conference was organized. However, when they tried to expand to the larger ranches, the huge spreads that shuffle millions of cows into huge feedlots each year, they found zero interest. “It was like hitting a brick wall,” Arturo Sandoval, board chair of Quivira, told us. “The corporations and big city businessmen who own the giant ranches just don’t have the same feel for the land that the smaller guys do.

Another way to improve soil is to mix charcoal into it, if the charcoal is made in a sustainable way, for example from waste materials. Charcoal is basically wood and other vegetation that has been heated in a contained place without oxygen. This drives out moisture and chemicals that vaporize. When used to improve soil, charcoal is called “biochar” or “terra preta.” Earthworms help mix it into soil. Biochar sequesters carbon for a very long time, and so might help with climate disruption. Properly employed, it can be a powerful soil builder. In the 1950s, the distinguished Dutch soil scientist Wim Sombroek discovered that indigenous peoples along the Amazon had used terra preta to build rich topsoil six feet deep in places where there had previously been only the very thin topsoil characteristic of the rain forest.58 This is not only of historical interest. Sombroek’s findings have stood the test of hard science and worked their way into modern agriculture and popular culture. Terra preta is now being used in many parts of the world to enhance impoverished soil.59

Plowing land and leaving it bare part of the year causes carbon to oxidize and float up into the air. In the Corn Belt, we’ve already lost nearly half of the carbon and nitrogen once in the soil.61

The barrier to large-scale composting is this: Most cows are now crowded together in giant confined-feeding operations, so the farmland around them can’t absorb all the compost they produce. And it’s too expensive to truck compost very far from where it is produced.

Because cows don’t like to eat plants located close to their poop, the pasture area available for grazing quickly shrinks if pats aren’t cleaned up. But the same mess that repels cows can attract dung beetles from ten miles away. Dung beetles that specialize in cow poop so love the smell that they may hover near a cow’s tail just hoping for a treat. When rewarded with a splat, they dive in while it’s still warm. Although they prefer it fresh and stinky, dung beetles will burrow into hard dung that earthworms shun. They eat dung, squeeze water

They bury the ball in soil and either eat it later or use it to incubate one of their eggs. After a month or so the beetles leave a patch and worms move in, filling tunnels with their castings. If cow pies just sit on the surface and dry out, they lose most of their nitrogen to the air. By working dung into the soil, beetles improve its texture and recycle nitrogen and other nutrients needed to grow lush grass and forbs for cows to eat. Runoff is reduced because water and roots can penetrate better. As a toss-in benefit, the beetles kill the larva of certain flies that plague cows (and farmers), and they even reduce bovine gastrointestinal parasites by eating parasite eggs before they can turn into larva and infect other cows. It’s estimated that dung beetles currently save United States cattlemen about $400 million a year in clean-up costs.74 Ancient Egyptians were deeply intrigued by scarabs, a type of dung beetle. They saw in scarabs a microcosm of the cycle of life, the daily rebirth of the sun, and the eternal nature of the human soul. You couldn’t walk a block in ancient Egypt without encountering a dung beetle image in an amulet, adornment, seal, carving, or painting.

Dung beetles co-evolved with cows in Europe and Africa, and they come in eight thousand varieties. Hawaii and Australia were two places not blessed with them, so cattle ranchers had to import them. It worked beautifully; the imported beetles cleaned up the messes from the imported cows. Thanks to dung beetles, it’s now once again legal, in parts of Australia, to dine at an outdoor café that’s not protected by screens. You can find a type of dung beetle that will tolerate just about everything, including heat, drought, and cold. Some beetles work at night, some during the day. Different species of dung beetles will work cooperatively in the same pasture. There’s a growing body of scientific literature on how to match dung beetles to particular environments; getting the mix right is crucial for optimum results. Unfortunately, the sheer number of cows crowded into factory farms creates terrible working conditions for the beetles. The pesticides, fungicides, and insecticides that saturate large cow operations are harmful to beetles. For example, although beetles can greatly reduce the number of bovine gastrointestinal parasites, beetles are killed by medicines fed cows to kill the parasites, because the active part of the medicine passes through cows intact. Residual antibiotics in cow poop kill off good bacteria on which dung beetles depend. In short, it seems unlikely that even dung beetles can clean up the factory farm mess.

Cows have an astonishing ability the brightest chemists haven’t been able to replicate in the lab: They can convert low-value cellulose and carbohydrates (grass and by-products) into massive amounts of high-quality, delicious protein (milk and meat). Cows manufacture complete protein with all nine amino acids people require to thrive. To accomplish this bio-alchemy, a cow spends six to seven hours a day eating and another eight hours chewing cud—a fifteen-hour day, seven days a week. And a cow works for just room and board, with a bleak retirement plan. This is the drill: Ferdinand wraps his three-pound tongue around vegetation and pulls it into his mouth. He swallows the greens without much chewing. A cow has just one stomach, with four compartments. When the first and largest compartment, the rumen, is full, Ferdinand burps “cud” back into his mouth. He grinds the cud between his powerful molars and the toothless but tough palate on the top of his mouth. (Gary Larson is the world’s best cow cartoonist, but only

The rumen is a universe unto itself, teeming with hundreds of species of bacteria, protozoa, and fungi. Its lining looks like tufted carpet. The late Lynn Margulis, a distinguished biologist, once described a cow as “a forty-gallon fermentation tank on four legs.”1 The microbes cooperate and compete among themselves, using enzymes to ferment the mashed vegetation and to create protein, B and C vitamins, and volatile fatty acids. The rumen enables a cow to extract energy from plant matter like stems, seed coats, and seed shells that most other animals can’t eat.

The second part of Ferdinand’s stomach is his reticulum, which has a lining that resembles a honeycomb. Cows aren’t picky eaters, so the reticulum acts like a trap. People poking around inside dead cows find rocks and bits of plastic and metal in a reticulum. “Hardware disease,” as it’s called, causes problems if metal punctures the stomach wall. To prevent this, a finger-sized rod ringed with magnets can be inserted into a cow’s stomach where it attracts swallowed metal. The magnet stays in the cow all the way to the slaughterhouse. Of course, magnets won’t attract glass, plastic, or aluminum. When people toss trash out of their car windows, the trash sometimes ends up in fields, gets shredded by harvesting machines, mixed in with hay and silage, and is eaten by cows.

The third part of a cow stomach, the omasum, has folds that remind some people of the pages of a book. It filters and resorbs water. Finally, food gets to the part of the cow’s stomach that most resembles a human stomach, the abomasum, where acid and enzymes digest protein. After the stomach comes the intestine. Unfurled, it could stretch to the height of a sixteen-story building. Cows are amazing. They will always have a role to play on land that provides good pasture yet is unsuitable for growing crops.

Grandma’s and Grandpa’s cows were benign beasts that transformed grass into protein, fertilized their own pastures, and provided agricultural muscle. Today’s cows are more like energy-sucking black holes. How much energy they require depends on what you include in your calculations.

Our pets—especially our dogs—also eat large quantities of beef. There has been little rigorous investigation of the carbon paw prints of commercial pet food. Robert and Brenda Vale, authors of Time to Eat the Dog: The Real Guide to Sustainable Living, calculate that an average-sized dog eats 3.17 ounces of meat a day. Over a year, that’s about seventy-two pounds of meat—only marginally less than the average person, globally.10 A cooperative effort between the Nutro Company and the University of Illinois affirmed that dogs and cats require particular nutrients, not particular ingredients, so that plant protein, and protein from lower-order animals or even single-cell organisms, can be substituted for red meat in cats’ and dogs’ diets.11 Furthermore, an estimated 57% of American cats and 53% of dogs are overweight. Twenty-seven percent of cats and 17 percent of dogs aren’t just overweight but are obese12—as are nearly 36 percent of their owners.13 The family can all go on a diet together.

Lured by lucrative federal subsidies, farmers in the United States planted 97.4 million acres of corn in 2013.  These monoculture crops weren’t headed for your dinner plate; the bulk of the crop is used to fatten cows or to make ethanol.  A popular crop is a type of field corn called “number 2 yellow dent corn,” because each kernel has a little dent on both sides. Field corn can chip a human tooth—it’s that tough. To consume it, humans must grind it into meal or treat it with lye to remove the thick outer skin. The sweet corn you buy as corn on the cob has a very thin skin around each kernel.

Traces of these drugs end up in meat, milk, and the environment. Using antibiotics in this way also encourages the development of antibiotic-resistant bacteria.

The Haber-Bosch process now produces one hundred million tons of nitrogen fertilizer every year. Ammonium nitrate fertilizer revolutionized agriculture, winning a temporary respite in Malthus’s race between human population growth and food limits. The world’s human population today might be a third smaller but for the extra food made possible by this fertilizer.

The crop most suited to utilize this fertilizer was nitrogen-hungry hybrid corn.

If two genetically distinct lines of corn are bred, for reasons still not fully understood “hybrid vigor” (heterosis) increases yield. Hybrid corn has stalks that are less likely to break below the ear, and hybrid plants conveniently all mature at about the same time, making it easier to use large harvesting machines. In the 1940s and 1950s, yields of grains began to soar, from a bit over 20 bushels per acre in the early 1900s to over 155 bushels in 2013.  Wow. Hybrid seed is patentable. If a farmer tries to grow a new crop from the seeds of the previous year’s hybrid plants, she not only will see a big reduction in yield but also will be breaking her contract with the seed company. So she needs to buy seed year after year.

Other downsides to hybrid corn are that it requires huge amounts of fertilizer, and the loss of biodiversity can increase vulnerability to corn diseases, such as happened during the outbreak of Corn Leaf Blight Race T, a fungal disease, in 1970.

These new corn and wheat seeds—and the attendant use of fertilizers, pesticides, farm machinery, irrigation, and larger-scale farms—were spread around the world by the Rockefeller Foundation. The Ford Foundation pitched in later, helping to spread high-yielding rice and corn grains. The burst in food production came to be called the Green Revolution.

The Green Revolution resulted in a cornucopia of corn. The abundant corn, in turn, made possible the rise of giant confined animal feeding operations.

In the nineteenth century, when the practice developed of moving cattle to railroad holding pens in Abilene, Kansas City, Dodge City, and elsewhere, cows faced a new challenge. Traveling by rail was hard on them. Even when they didn’t get sick or die en route, they inevitably lost much weight. So to prepare them for railroad shipment to distant slaughterhouses, the cows were penned for a few weeks and fattened on grain. By 1870, three hundred thousand head a year were passing through Abilene alone. In 1876, Gustavus Swift, a former farmer and butcher, pulled together the elements (feedlots, slaughterhouses, railroads, and refrigerated railcars) that transformed the beef industry. His key idea was to slaughter cows in the west (Chicago) and ship refrigerated meat instead of live cows (only two-thirds of a cow being edible). This allowed Swift to fatten the cattle for slaughter rather than fattening them to make the trip.

The final transformation took place under Earl Butz, Secretary of Agriculture in the Nixon administration. Butz was raised on a 160-acre farm in Indiana that was mostly self-sufficient. His family used a team of horses, not a tractor, and manure from livestock, not synthetic fertilizer. They grew all the animal feed they needed. After Butz left to attend Purdue University, a neighbor bought the Butz farm, and it grew in size to eight hundred acres. He purchased seed, fertilizer, pesticide, tractors, and feed—and yet made enough money to buy new cars, televisions, and vacations. The financial success of this approach to farming deeply influenced Butz’s vision of American agriculture.30

In the 1973 Farm Bill, the final element underpinning the modern industrial cattle business. Under this legislation, the government set a price for grain and guaranteed the purchase of anything the market didn’t buy. By removing most of the risk from planting, the legislation essentially guaranteed huge surpluses. To soak up the surplus grain, the USDA encouraged gigantic feedlots. Today corn comprises over 95% of all the feed grains produced in America, the others being sorghum, barley, and oats.31

Holsteins became the most popular dairy cows partly because of the breed’s ability to tolerate corn.

Vaclav Smil wrote  “The biomass of domesticated land animals, dominated by cattle, is now at least 20 times larger than the zoomass of all wild vertebrates.  If extraterrestrial visitors could get an instant census of mammalian biomass on the Earth in order to judge the importance of organisms simply by their abundance, they would conclude that life on the third solar planet is dominated by cattle.”

“Primary production”—all the solar energy captured by plants and algae—is the bottom link in every food chain. Smil has calculated that humans and our farm animals consume 40% of Earth’s net primary production. Only 60% remains to support all other life on the planet—not just the vertebrates but also the beetles, ants, worms, octopi, jellies, clams, sponges, lobsters, spiders, and so on. If the human population grows another 50%, and everyone starts to eat as much beef as Americans, we will wipe out much of the rest of the animal world.

In 2008 and 2011, global food prices spiked to record levels because of weather disruption, diversion of food crops to biofuels, and market jitters.46 From 2008 to 2014, Americans, comprising only 4.5% of the world’s population, grew 33 to 56% (depending on the year) of all corn, along with a disproportionate share of all wheat.47 Our Great Plains is now breadbasket to the world.48 For much of the first decade of the new millennium, the demand for corn, wheat, rice, and soybeans in many parts of the world greatly exceeded the available supply. As a result, food riots and political destabilization occurred in nations as disconnected as Mexico, Uzbekistan, and Yemen. Food shortages helped trigger the Arab Spring. Researchers at the New England Complex Systems Institute have correlated the dates of riots with rising prices of food. “Social disorder is contagious,” says physicist and systems scientist Yaneer Bar-Yam. “The more we see it happening elsewhere the more it becomes imaginable where one lives.”49

Today, 842 million people go to bed every night hungry, far more than before the Green Revolution.

At one time we were a nation of small farmers. Today, most Americans don’t have access to enough land to grow their own food, so they depend on distant farms to supply their supermarket. We recently read an old book, Pleasant Valley, about the restoration of a farm in Ohio. In this book, Louis Bromfield, a widely popular writer in the 1930s and 1940s (the time of the Great Depression, the Dust Bowl, and World War II), argues with passion that good soil and family farming are the most basic needs of a wealthy, healthy nation. He makes a compelling argument that an individual is only truly secure when he or she is able to grow enough food to feed a family in bad times. Seventy years ago, Bromfield and others worried about how much American soil we’d already lost and argued for techniques similar to the no-till farming now being rediscovered by the USDA.

https://www.epa.gov/enforcement/national-enforcement-initiative-preventing-animal-waste-contaminating-surface-and-ground

Across America tens of thousands of ponds called lagoons dot the rural landscape. The word “lagoon” conjures up images of cerulean blue ponds ringed by reefs and palms. But the lagoons in rural America are nothing like the Blue Lagoon in which Brooke Shields frolicked. They are where farmers store animal sewage. Brimming with chemicals and disease organisms, these lagoons fester like open sores. They are typically man-made ponds rimmed by dikes of scraped-up dirt. Lagoons are seldom covered, but there are many variations: covered or uncovered, lined or unlined. Livestock’s untreated sewage is America’s least-regulated source of pollution. According to USDA and EPA estimates, concentrated livestock and poultry operations produce three times as much raw waste as do humans.2 And each ton of raw manure is up to 110 times more polluting (in terms of biochemical oxygen demand) than raw municipal sewage.3

On smaller farms with land enough to absorb their cows’ waste, lagoons can be managed so they aren’t a problem. (It takes only one or two cows to provide ample manure to fertilize an acre, an area about the size of a football field.) But on CAFO factory farms that have far more cows than acres, it’s often necessary to build multiple massive lagoons.

Cows are large, hungry animals. A lactating dairy cow needs about one hundred pounds of feed a day. Beef cattle are no slackers either. They produce more urine and feces, per pound of weight, than any other meat animals.5 After cows extract from their feed what they need to grow, walk around, produce milk, and hang out with other cows, there’s still a lot left over. Therefore, cows poop a lot. Maybe a dozen times a day. They go so often that there are popular contests called cow-pat bingo. Chalk lines divide a yard into maybe a thousand numbered squares, and a cow or two is put into the yard. People bet on which square will get the first splat.

If CAFO farmers just let manure pile up in barns and feedlots, they’d soon need ladders to get to their cows. So cow waste is scraped or washed out of dairy barns as slurry and piped into lagoons. From the lagoon, waste may go into a spray-field system and be splattered over nearby acreage. Or liquid is allowed to evaporate and every once in a while matter too solid to be sprayed is scraped out and put on fields, often resulting in a deposit of excessive nutrients (nitrogen, phosphorus, or potassium). The excess nutrients run off and pollute.

When you cram tens of thousands of cows together, as some CAFOs do, germs thrive. So antibiotics are given prophylactically and constantly. To maximize profits, the cows in a feedlot must be fed rich grain and are often given hormones. Feed grain must be grown elsewhere, nearly always with heavy applications of artificial fertilizers and pesticides, and then transported to the CAFO. All this fertilizing and transporting requires tons of fossil fuel. Vast amounts of water must also be pumped in for drinking and cleaning up. Polluted water then has to go somewhere.

When you cram tens of thousands of cows together, as some CAFOs do, germs thrive. So antibiotics are given prophylactically and constantly. To maximize profits, the cows in a feedlot must be fed rich grain and are often given hormones. Feed grain must be grown elsewhere, nearly always with heavy applications of artificial fertilizers and pesticides, and then transported to the CAFO. All this fertilizing and transporting requires tons of fossil fuel. Vast amounts of water must also be pumped in for drinking and cleaning up. Polluted water then has to go somewhere.

CAFOS are often initially welcomed by states as a source of anticipated income. When California imposed more stringent regulations on CAFOs, Idaho opened its arms wide to beef and dairy feedlots. Law after law was changed in Idaho to make polluters feel welcome.6 Not only were the Idaho nutrient management requirements very modest, but they were (and are) secret! Under Idaho state law, “the nutrient management plan, and all information generated by the beef cattle feeding operation as a result of such plan, shall be deemed to be trade secrets, production records or other proprietary information, shall be kept confidential and shall be exempt from disclosure.

Only a quarter of large dairies have enough land on which to spread manure and still comply with the 2003 Clean Water Act’s nutrient application standards for nitrogen. If a strict phosphorus-based standard is used, only 2% of large dairies are in compliance.11

Early in the twenty-first century, the EPA began requiring CAFOs that discharge waste into rivers, streams, or lakes to apply for a National Pollutant Discharge Elimination System (NPDES) permit.  To get an NPDES permit, a farmer must comply with effluent limits and standards. Therefore, most big outfits should be packing up a lot of their manure and hauling it to fields, pastures, forests, or highway margins where it won’t exceed nitrogen and phosphorus limits. But raw manure is expensive to truck around, and farmers can’t economically haul it more than about six miles. Unfortunately, neighboring farms often have their own cows or prefer the convenience of commercial fertilizer, which doesn’t stink, contains consistent amounts of nutrients, and is easier to apply (although it costs more and doesn’t improve soil quality as does manure). Even accidental discharges are illegal under the NPDES. The penalty is a fine. The EPA has the right to prosecute and occasionally does.15 More often, the power is delegated to state agencies, which are unable to overcome the clout of the farm industry in state legislatures. An example is found in Iowa, a state with heavy runoff from factory farms. Iowa Citizens for Community Involvement, the Sierra Club, and the Environmental Integrity Project petitioned the federal EPA to take over enforcement of water laws from the Iowa Department of Natural Resources (DNR). The EPA agreed that the farms needed permits, and it ordered the Iowa DNR to inspect thousands of farms over five years or hand over power to the EPA. It is a victory, of sorts, but few expect the Iowa DNR to find religion in the next few years, and at the end of the five years, it is uncertain that Congress will appropriate the money the EPA needs to do the job.16

Because we have stuffed staggering numbers of cows into factory farms, we Americans now live in a cow toilet. Pollutants in feedlots and lagoons rise into the air and travel long distances on the wind. They also sink into groundwater, where they go with the flow. Managing a feedlot is a balancing act between not keeping the land too dry or too wet. If it’s too dry, the wind kicks up noxious dust. If too wet, the stench and fly population balloon.

Ammonia and hydrogen sulfide go into the air at every stage of manure handling: while manure is on the ground or the barn floor, from lagoons, when manure is scraped into a pile and stored, while it’s applied to land, and while on a field. Forty to 60% of the nitrogen in cow food ends up in the air in the form of ammonia.18 A single cow’s daily burps include ammonia, hydrogen sulfide, volatile organic compounds, and as much as a thousand liters of methane, carbon dioxide, and other warming gases. Multiply that times 93 million cows! Ammonia irritates the lungs of people and cows and makes it difficult to breathe. Over a quarter of factory-farm workers have respiratory problems.19 Volatilized ammonia can travel three hundred miles before settling down on land or water.20 The smog in much of Southern California contains tiny particles of ammonium nitrate, and the amount that comes from cows may be as great as that which comes from cars.21 As for hydrogen sulfide, Robbin Marks, author of the authoritative book Cesspools of Shame, notes that it “can cause eye, nose, and throat irritation, diarrhea, hoarseness, sore throat, cough, chest tightness, nasal congestion, heart palpitations, shortness of breath, stress, mood alterations, sudden fatigue, headaches, nausea, sudden loss of consciousness, comas, seizures, and death.”22 Even at less dire concentrations, it stinks like rotten eggs.

Farts on fire.  some farts contain methane. (Almost half of humans, however, produce flatus containing no methane, because they lack a single-cell gut organism called archaea. Wondering whether you’re a producer? Now you know how to find out.)

Alarming amounts of pollutants from lagoons also get into water. Heavy rainfall, overloading, and breaks in earthen walls cause spills. Such breaches are frequent, and they flood untreated sewage into rivers and estuaries as well as into groundwater. In addition to nitrogen, phosphorus, and bacteria, cow waste often contains natural and synthetic hormones, antibiotics and other drugs, heavy metals, pesticides, herbicides, and salts that can make water unusable for drinking or irrigation.

For centuries the greatest threat to humans from cows was tuberculosis. Cows and humans have been swapping tuberculosis (TB) bacteria since the Stone Age. Mycobacterium tuberculosis is the strain usually associated with humans, and Mycobacterium bovis (M. bovis) is most often associated with cattle (and bison, elk, and deer). But cattle and humans can both get both forms. As recently as 1900, prior to the pasteurization of milk products, TB was second only to pneumonia as a cause of death in the United States. Today 5 to 10% of Americans still carry latent TB. Similarly, TB was once the most common disease in cattle here, but control measures have now made it rare, and Americans today seldom catch the cow form of the disease. M. bovis is amazingly adaptable, however, and can infect all warm-blooded vertebrates, making it hard to eradicate.

Symptoms include bloody diarrhea, mucus, and pus. Salmonella outbreaks connected to ground beef occur with depressing frequency.

Escherichia coli O157:H7 (sometimes called “hamburger E. coli”) is Shiga toxin–producing and causes over a third of E. coli infections. Infected cows aren’t much bothered by O157:H7, but swallowing just a few of these bacteria can sicken people. Diarrhea, vomiting, cramping, and urinary problems are typical symptoms. About 6 percent of victims get hemolytic uremic syndrome. In American children, O157:H7 is the most common cause of kidney infections. In extreme cases the germ causes bloody diarrhea and death. The USDA banned the sale of ground beef containing O157:H7 in 1994, but that hasn’t stopped it from being sold. (Here’s a shocker: If you catch a Shiga toxin strain of E. coli and take most kinds of antibiotics, the antibiotics might kill you. Ciprofloxacin, for example, kills the bacteria, but as they die the microbes can release a lethal amount of toxin.)

Because so much of a cow’s meat (about 40%) is left over after named cuts have been removed, the scraps are saved and ground up. Meat from hundreds or even thousands of cows may be contained in a single lot of ground beef.43 This mixing greatly increases a consumer’s chance of swallowing toxic bacteria, antibiotic-resistant bacteria, or antibiotic residue. As of June 2013, one out of every 354 samples of raw ground beef the USDA had tested for E. coli O157:H7 were positive. (The testing program began in 1994.) Even more worrisome, one out of 118 was positive for one of six other types of non-O157 Shiga toxin–producing E. coli.

The mechanical tenderizing processes used by most beef producers allow cross-contamination to occur even in steaks. The CDC has attributed at least three E. coli outbreaks to this practice.47 To tenderize meat, a conveyor moves hunks of meat under a device with many vertical needles or blades. The device isn’t washed between injections, so any germs in one hunk of meat can be spread to many. All the big four beef packers (JBS Beef, Tyson Foods, Cargill Meat, and National Beef Packing) have tenderizing machines. These corporations process 80 percent of all beef slaughtered in the United States.

Shoppers can’t tell if packaged meat has been mechanically tenderized just by looking at it, so consumer advocates have long begged for labels that reveal whether meat has been tenderized.

E coli O157:H7 has been found in spinach and lettuce irrigated with water downstream from cattle.54 Consumer Reports even found fecal contamination in “prewashed” salad greens. We were shocked to learn that pathogens such as O157:H7 can actually be sucked inside individual leaves of lettuce and spinach, where they can’t be washed off—and nobody cooks lettuce.57

The CDC estimates that in 2010 there were 82,040 infections and 11,478 deaths from MRSA.  The Center for Science in the Public Interest unearthed thirty-eight outbreaks from 1973 to 2009. Most were linked to dairy products and ground beef. Disturbingly, nearly half occurred in the last eleven of the thirty-eight years studied.62 MRSA is only one of the superbugs springing up in hospitals and communities. Diseases with strains resistant to one or more families of antibiotics now include anthrax, gonorrhea, strep infections, pneumonia, staph infections, meningitis, shigellosis, tuberculosis, typhoid fever, and urinary tract infections. Meet Acinetobacter baumannii, or MDRAB. Nicknamed “Iraqibacter” because of its prevalence in American troops sent there, some experts think it’s a bigger threat than MRSA.65 Then there’s Klebsiella pneumoniae, a bug found in hospital settings. Like MDRAB, it is resistant to virtually all of today’s antibiotics.

Although the CDC’s National Antimicrobial Resistance Monitoring System (NARMS) surveys retail meat looking for multidrug-resistant  Campylobacter, Salmonella, Enterococcus,  E. col,i Staphylococcus aureus (all  are bacteria found in cow intestines), it doesn’t look for other pathogens that have become resistant. But it should. Consider Staphylococcus aureus, which infected Denis’s elbow. In 2011, The Translational Genomics Research Institute did the first nationwide survey to find out how pervasive Staphylococcus aureus is in ground beef, pork, and poultry. The researchers looked at 136 samples representing 80 brands from 26 grocery stores in 5 cities.66 About half of all samples were contaminated with Staphylococcus aureus, including 37 percent of the ground beef samples. One-third of the contaminated samples had a strain of Staphylococcus aureus resistant to three or more antimicrobials. Various strains displayed resistance to tetracycline, ampicillin, penicillin, erythromycin, fluoroquinolones, quinupristin/dalfopristin, oxacillin, daptomycin, and vancomycin.

Antibiotic Resistance.  Healthy animals in factory farms are fed 80% of all antibiotics sold for all purposes in America to improve feed efficiency, prophylactically guard against disease, and promote growth.  This threatens to spread antibiotic resistant to microbes humans are susceptible to.  If new antibiotics aren’t found, an infected scratch could kill someone.

We were surprised to learn that antibiotics even get into cows as a side effect of growing corn-derived ethanol. Dried distillers grain (DDG)—a low-starch, high-protein by-product of ethanol production—is a popular cow supplement at feedlots. The ethanol mash from which DDG is made is often contaminated with Lactobacilli, which thrive in the warm, moist, sugar-rich environment. The Lactobacilli compete with alcohol-producing yeast for the sugars, but they produce lactic acid, not ethanol. To combat the Lactobacilli, many ethanol producers add antibiotics, including penicillin and erythromycin, to their fermentation tanks. After the ethanol is removed, the tanks still hold distillers’ grains, which typically contain unregulated antibiotics. The Institute for Agricultural Trade and Policy argues persuasively that pharmaceutical companies selling antibiotics for this purpose are violating the law

You may have heard that a crisis looms ahead as more and more microbes become antibiotic resistant.  A major way this is happening is from the healthy animals in factory farms, who consume 80% of all antibiotics to gain more weight and prevent disease.  Growing corn to produce ethanol is one of many causes. It turns out that Dried Distillers Grain (DDG) is often contaminated with Lactobacilli which thrive in the ethanol mash it comes from. So ethanol producers add antibiotics like penicillin and erythromycin to the fermentation tanks, so when factory farm animals eat DDG, they are also eating illegal antibiotics (Olmstead 2012, Laskawy 2012, McKenna 2012).

Many respected organizations have called for a ban on giving healthy farm animals antibiotics that are also used in humans. They include the World Health Organization, the Centers for Disease Control and Prevention, the American Medical Association, the American Society for Microbiology, the American Public Health Association, the Union of Concerned Scientists, the American Academy of Pediatrics, and the American Pharmacists Association.73

Astonishingly, American dairy farmers and ranchers still don’t even have to get a prescription to buy antibiotics for cows—they can just pick up the drugs at a feed store. And American veterinarians can still prescribe “extra-label” uses of most approved veterinary drugs. This means a drug can be used for a different species, for a different indication, at a different dose, or administered differently than it was approved for.76 The FDA recently, and reluctantly, prohibited the extra-label use on farm animals of a class of antibiotics called cephalosporins (often given people who have strep throat, pneumonia, urinary tract infections, and skin infections). This means cephalosporins can no longer be used to prevent cows from getting sick or given to cows in doses too low to cure disease.77 Unfortunately, the FDA only acted in response to a lawsuit by the Natural Resources Defense Council.78 According to NRDC: “Revealingly, in court documents, the agency said that if it started limiting antibiotics in animal feed, the livestock and pharmaceutical industries would protest so strongly it would consume too much of the agency’s time and resources, suggesting the agency is acting on its fear of the pharmaceutical and agricultural industries rather than doing what is best for human health.”79

U.S. Representative Louise Slaughter’s proposed Preservation of Antibiotics for Medical Treatment Act is much stricter and has been endorsed by 368 worthy organizations but by none of her Republican colleagues. The act would restrict the use of antibiotics for disease-prevention or to promote growth (they could still be given to sick animals). Under the proposed law, drug companies would need to demonstrate that giving animals existing or new antibiotics critical to humans would not lead to the development of resistance. As of September 2013—in an oblique tribute to the power of the agribusiness lobby—GovTrack.us (an independent, for-profit service supported by ads) gives the act a 3 percent chance of getting through committee and a 1 percent chance of passing the House. If a radically different Congress is seated and the bill does pass, it would provide great benefits for humans. It might also force a dramatic improvement in the lives of cows, because factory farming would become impractical.84

The meat of former dairy cows, which constitutes roughly a fifth of our meat supply, is more likely than most beef to contain harmful antibiotic residues.91 The male calves of dairy cows often quickly become veal chops. But before they are killed, these calves may be given “waste milk” from cows on antibiotics, milk that can’t be sold for human consumption. They are also given medicated feed. Thus, veal is more likely than most beef to contain drug residues. In 2008, over 90 percent of beef contaminated by antibiotic residues came from plants processing dairy cows and veal. Common sense suggests such plants deserve stricter scrutiny, a 2010 Office of Inspector General report said. But the plants don’t get it. Recall of such tainted meat is voluntary, and the USDA’s Food Safety and Inspection Service (FSIS) hasn’t requested any such recall since 1979.92

You can help to protect your family (and our society) from antibiotic residues and resistant bacteria by choosing organic food. A big advantage of products from organic cows is that they are free of antibiotics and do not put these drugs into the environment or you.  Beware labels that say “antibiotic-free” and “no antibiotic residues.” They mean only that the seller claims that the packaged beef contains no antibiotics. Even if this is true, antibiotic resistance develops back in the feedlot; a cow can be treated with antibiotics for years and treatment stopped during just the last couple weeks of its life. “No antibiotic growth promotants” means that the feedlot operator alleges that any antibiotics used were meant to prevent disease, not promote growth. But they are the same antibiotics, whatever the cattleman’s ostensible intent. The USDA does, however, approve labels such as, “never ever given antibiotics” or “no antibiotics ever.” But also look for a “USDA process verified” logo if you see such words. The logo means that the USDA has investigated the company’s process (not their product) and found the claim to be true.101

For over forty years a few small, farm-based digesters have been turning cow poop into methane. The methane is then burned to make electricity. Recently, much larger digesters have been put to work. The new systems now make more economic sense, because there is a market for alternative energy credits. Grant money is also available to support such efforts. To be clear: Digesters are more about controlling pollution than generating electricity. If every ounce of manure from 93 million cows were converted to biogas and used to generate electricity, it would produce less than 3 percent of the electricity Americans currently use (Cuellar, A.D., et al. 2008. Cow Power: the energy and emissions benefits of converting manure to biogas. Environmental Research Letters 3).

If a conventional dairy farmer wants to live a middle-class life today, Kevin says, he probably needs at least 350 cows. (Organic dairy farms can succeed with fewer cows.) One conventional farm they work with in Skagit County has 900 cows; an adjacent farm has 350. These two dairies are “scrape farms”—they scrape up manure rather than flushing it out with water. The cows eat mostly roughage (grass and corn stalks), not grain. It’s not feasible to pasture cows year-round here because it gets too cold and the pastures get muddy. The 900 cows we visited were in an unwalled barn with lots of air circulation.

The Maas brothers decided to set up their Farm Power plant right between the dairies, so the manure wouldn’t need to be trucked long distances to the digester, and the finished product could be piped at reasonable cost to nearby fields. With the farmers lined up, all Farm Power had to do was find $3 million to build a million-gallon tank in which to digest manure, a generator, and tanks to hold the stuff coming in and going out of the digester, which included up to 30% pre-consumer food waste—things like cow blood, dead chickens, and fish waste. Food that has not already been digested by animals contains more energy, allowing the anaerobic bacteria in the digester to pump out more methane. The facility can process forty to fifty thousand gallons of manure daily.

This generator and another, which Farm Power operates at Lynden, Washington, generate enough electricity to power a thousand homes. The liquid material coming out of the digester is a better fertilizer than raw manure because it contains far fewer pathogens and weed seeds and doesn’t stink as much. It first flows into a pit; from there, as a more stable manure slurry, it’s piped to nearby fields where it can be pumped through an irrigation nozzle or injected into the soil. The dry residue is turned into sanitary, comfy cow bedding. After the dry matter is squeezed through a screen, it’s loaded into trucks and hauled back to the farms. In the future, Farm Power plans to pasteurize the bedding product. Kevin scooped up some finished product stored at one of the nearby dairies. He held it out, inviting Denis to examine it. The bedding was still hot, and smelled like soil and hay.

Digesters don’t solve every environmental problem. Certain antibiotics in cow manure can kill off the fermenting and methanogenic bacteria that make the process possible. The heat in digesters probably doesn’t destroy most antibiotics. New research suggests some pathogenic and antibiotic-resistant bacteria survive anaerobic digestion. Installing a scrubber to remove sulfur dioxide from the digester gas wasn’t economically feasible for the Maas brothers, so they got a permit to emit some pollution. More nitrogen, phosphorus, and potassium remain in the final product than is ideal. Carbon dioxide is also put in the air, and the trucks hauling waste and bedding burn fuel.

A mother’s milk is amazing: human or cow, it comes customized for her particular baby. A human baby’s gender is taken into account in terms of how much fat and protein are in a mother’s milk. And human milk is further adjusted according to whether times are good. For example, an affluent, well-nourished woman will provide more fat and protein in her milk for a male infant. When times are lean, a girl baby gets more fat.3 Why might this be? The Trivers-Willard hypotheses (proposed by Robert Trivers and Dan Willard) speculates that (especially in polygamous societies) if times are lean, the condition of a mother might be poorer. A son born in lean times may be unable to afford wives. But a poor daughter might still find a husband. So a girl would then be the better bet to provide grandchildren. This theory also applies to polygamous animal species.

A Holstein cow produces more milk if she has a female calf, and even more milk if she births two daughters in a row.5 Why is still a mystery. Cow milk differs from human milk: It’s richer and less sweet. Calves grow fast, so cow’s milk has more protein, sodium, potassium, phosphorus, and chloride than is good for a human baby, and not enough unsaturated fats, essential fatty acids, iron, retinol, and vitamins E, C, and D. Even hormones have been shown to vary in animal milk according to the sex of the baby6

[T]he recommendation for three servings of milk per day is not justified and is likely to cause harm to some people. The primary justification is bone health and reduction of fractures. However, prospective studies and randomized trials have consistently shown no relation between milk intake and risk of fractures. On the other hand, many studies have shown a relation between high milk intake and risk of fatal or metastatic prostate cancer.7

In 1974 the Food and Drug Administration forced the milk industry to stop saying that everybody needed milk.

We were interested to learn that, ounce for ounce, whole milk has more calories than soda pop and that over half its calories come from sugar. Even a cup of nonfat milk has only seven fewer calories than a cup of Classic Coke.

New research suggests that heavy sugar consumption might be linked directly to cardiovascular disease and diabetes as well as to obesity.

A cardiovascular disease study that was prospective, covered twenty years, and involved over 31,000 adults found that sugar added to foods (such as to dairy desserts) significantly increased participants’ risk of dying of heart disease. When a participant got over 25 percent of his or her caloric intake from sugar, he or she was nearly three times more likely to die from heart disease than a participant who got under 10 percent of his or her calories from added sugar. (Most adults get over 10 percent of their caloric intake from added sugar.) Heart disease is what kills most Americans.9

The heavy consumption of saturated fat is also associated with weight gain.11 Over half the fat in whole milk is saturated, and we humans don’t need any saturated fat in our diets.

Most of the saturated fat Americans consume comes in the form of cheese and pizza.12 About a third of the sixty million gallons of milk our nine million dairy cows squirt out each day is drunk as milk, and before it goes to market most of that milk has some or all of the fat removed. That means there are vats and vats of leftover fat. To find profitable uses for the fat, the dairy industry pressures other industries—such as pizza makers and burger chains—to use more cheese. The campaign has been wildly successful: According to the USDA, even as the per capita consumption of fluid milk fell, per capita cheese consumption soared from just over 16 pounds a year in 1970 to 33.5 pounds in 2012. Another huge market for dairy fat is gourmet ice cream, the segment of the ice cream market now enjoying the greatest success. A 2012 survey found that premium (high-fat, low aeration) ice cream was the industry’s most popular product.13

Although saturated fat is generally bad for us, here’s a baffling fact: No link has yet been found between heart attacks and dairy foods high in saturated fat. Milk and cheese are extremely complex substances that scientists are a long way from fully understanding. For example, micronutrients like calcium, potassium, phosphorus, and the vitamin D that is added to milk might lower blood pressure, which might reduce the probability of a heart attack. Or maybe conjugated linoleic acid (CLA) somehow protects hearts and/or mitigates some other adverse health effects of high-fat dairy food. CLA, found in whole and low-fat milk, is just beginning to be understood. Higher amounts are found in grass-fed cows than in conventionally raised animals.16

Roughly 90 percent of Asian Americans and 75 percent of African Americans, Hispanics, Native Americans, and Ashkenazi Jews are lactose intolerant. Among white northern Europeans, intolerance runs only around 2 to 7 percent.

People living in countries where adults seldom consume dairy products have lower rates of osteoporosis than Americans. What’s going on? Why do Chinese, Africans, and South Americans have stronger bones,32 while we in the United States consume three times as much calcium, yet have more brittle bones? While getting enough calcium is indeed important to bones, there are factors other than diet that matter much more: skin color (white and Asian women are at greatest risk); exercise (more is better); gender (women get more osteoporosis); longevity (older people have weaker bones); being small and thin; using cigarettes, alcohol, and prednisone (all weaken bones); genetics (if osteoporosis runs in your family); and whether you have rheumatoid disease. And here are some other suspected bone-weakening factors: lack of sleep, lack of exposure to sunlight, regular sunscreen use, not getting enough vitamin K or protein, taking too much vitamin A supplement in the form of retinol (instead of the beta-carotene form), taking some common prescription drugs, or having rheumatoid arthritis. Both obesity and losing a lot of weight can weaken bones. Still, an adequate amount of calcium is indeed important to bone health

Calcium intake is of special interest to postmenopausal women. Estrogen helps bones absorb calcium, and estrogen levels decline rapidly at menopause. Even women who consume a lot of calcium usually lose bone. Experts estimate half of American women will suffer a bone fracture after age fifty. Coauthor Gail is one of them, even though she took high doses of calcium/vitamin D supplement for years.

Cooking greens is a bother. So if you don’t want to consume dairy foods, why not just pop calcium pills? Because supplemental shortcuts don’t seem to work as well as getting calcium from food. Large studies have found no evidence that taking calcium and vitamin D supplements significantly reduces bone loss or hip fractures.35 In middle-aged and older women, a recent meta-analysis also found that taking calcium supplements might increase the risk of having a stroke.36 (Kidney stones are another risk of a high calcium and/or oxalate intake.) If you’re already getting around 1,000 mg per day of calcium through your food, there’s no need to take calcium supplements.

In 2013, the U.S. Preventive Services Task Force surprised many people when it announced its findings after a review of over one hundred studies: When post-menopausal women take a daily pill containing 1,000 milligrams of calcium and 400 international units of vitamin D, they did not experience fewer fractures but did increase their chances of getting kidney stones. Another consideration is a 2012 long-term study involving twenty-four thousand German men and women, which indicates that getting calcium from pills might increase the risk of a heart attack.37 Therefore, the Task Force “recommends against daily supplementation with 400 IU or less of vitamin D3 and 1,000 mg or less of calcium for the primary prevention of fractures in noninstitutionalized postmenopausal women.”

MAP hides inside white blood cells and thus is somewhat protected from the heat of pasteurization, even ultra-pasteurization.51 In 2007, the USDA’s Animal and Plant Health Inspection Service found that in nearly a quarter of dairy operations surveyed, at least 10 percent of the cows were infected with Johne’s. Compared to operations of five hundred or more cows, smaller operations with fewer than a hundred cows were half as likely to have infected cows in their herds.52 MAP is excreted in cow poop, can survive for a year in the environment, and from there it may get into milk, groundwater, tap water, and food crops.53 Studies have shown it can infect humans.

If you’re of an apocalyptic bent, here’s a scenario that will grab your attention. Two Stanford University researchers, Lawrence M. Wein and Yifan Liu, wrote an article for the Proceedings of the National Academy of Sciences contending that milk is an ideal transmitting agent for biological terrorism.57 (Wein summarized their findings in a New York Times op-ed.)58 The weapon: botulinum neurotoxin, the most toxic biological substance known. It blocks neuromuscular transmission and is appallingly easy to obtain and prepare for distribution.59 One of its trade names is Botox. Many Americans get injections of Botox to reduce facial wrinkles. Every year, six billion gallons of milk are pooled at various stages of collection and shipped around the country for rapid consumption. A terrorist could pour a few grams of botulinum toxin into a milk tank on one or more farms. The contaminated milk would be taken to a factory and poured into a raw-milk silo along with milk from other farms. From there it would flow into an even larger product stream. One-millionth of a gram of botulinum toxin can kill an adult; even less suffices to kill a child. This scenario holds the possibility of killing hundreds of thousands of people, Wein and Liu believe, most of them children. They argue that all milk trucks should be tested for botulinum before they unload into a silo, noting that trucks have to stop anyway for tests of antibiotic residue. Testing for all four types of the toxin that harm humans would raise the cost of a gallon of milk by less than one cent.

Wein and Liu’s article, which appeared in 2005—after the anthrax attacks of 2001—caused quite a stir. Some people complained that they were providing advice to terrorists. In the same issue of the Proceedings in which the article was published, Bruce Alberts, then president of the National Academy of Sciences, noted in an editorial that the information in the article was already freely available on the Web. He suggested that public discussion would help create greater alertness to an existing threat and acknowledged that there had been improvements in bioterrorism safeguards since 9/11. Furthermore, Alberts said, Wein and Liu may have underestimated how much of the botulism would be destroyed by newer pasteurization standards, a fact pointed out by other scientists.60 Alberts also noted, however, that these improvements in pasteurization, as well as other important FDA guidelines for protecting the milk supply, are voluntary. Not all milk producers have adopted them.61 Many people believe that such threats to our milk supply are remote, and that protecting against them is too expensive—another example of an overreaching nanny state. Others, including the authors, note that milk terrorism requires much less money and a far lower level of coordination, intelligence, and discipline than training jetliner pilots, simultaneously commandeering four transcontinental jetliners, and crashing those airplanes into specific buildings.

There is also a naturally occurring toxic substance in milk that’s now mostly of historical interest—tremetol. This poison is found in the white snakeroot plant. When eaten by cows, it gets into their milk, and when humans drink that milk it causes trembling, horrid intestinal pain, and vomiting. Abraham Lincoln’s mother and thousands of other settlers died of this “milk fever.” Although tremetol is not inactivated by pasteurization, the milk in a single carton today comes from so many different cows that any tremetol would be too diluted to be dangerous. The risk of milk fever today is exceedingly slight.

In men, too much estrogen can mess with male reproductive systems and cause breasts to grow. Sperm banks in Israel are finding it harder to get healthy sperm; only 1 percent of would-be donors at that country’s largest sperm bank make the grade. The cause of this alarming decline in fertility is a mystery. It’s thought by some scientists that aggressive dairy farming methods lie behind the drop.63 Excessive estrogen might mean an increased risk of ovarian cancer in women, prostate and testicular cancer in men, and breast cancer in both. In countries where fewer dairy products are consumed, young men have much less testicular cancer. The Harvard School of Public Health advises: “Because of unresolved concerns about the risk of ovarian and prostate cancer, it may be prudent to avoid higher intakes of dairy products.” Hormones reside in fat; if you choose to lower your level of estrogen exposure, pick low-fat or nonfat dairy products.

Hormones are another invisible substance in milk. They are found in all milk, be it bovine or human. Our bodies, and cows’ bodies, are regulated by an intricate symphony of hormones essential to our growth, sexual maturation, and health. A master gland, the pituitary, conducts the hormone production of other glands. What we ingest can throw this system out of tune. Toxicologists’ mantra has long been, “The dose makes the poison.” Ordinarily, the higher the dose, the greater the response—hence all those tests stuffing lab rats with huge amounts of food additives. But this axiom is not true of hormones, nor of chemicals that interfere with, or mimic, hormones. Scientists cannot predict the effect of low doses of hormones from effects seen when a high dose is given. Estrogen is one key hormone. All animals with backbones make estrogen. In women, estrogen regulates estrus cycles and the development of breasts and other secondary sexual characteristics. In males, it’s important for the maturation of sperm. Without estrogen, neither cows nor human females could make milk. A milk cow is usually “freshened” (bred) about once a year. Unlike Grandma’s cow, she keeps lactating in the last half of her pregnancy.

Milk estrogen. Cows produce about thirty-three times more natural estrogen when they are pregnant than they do when they are not pregnant, which means there’s a great deal of estrogen in the cow milk you drink.  As a cow’s pregnancy advances, the estrogen content of her milk rises. Americans drink so much milk that it accounts for 60–80 percent of the estrogen and progesterone (another female sex hormone) that we take into our bodies. Most of the rest comes from other animal products. (Plant phytoestrogens sometimes act like estrogen and sometimes like an antagonist to it.)

In men, too much estrogen can mess with male reproductive systems and cause breasts to grow. Sperm banks in Israel are finding it harder to get healthy sperm; only 1 percent of would-be donors at that country’s largest sperm bank make the grade. The cause of this alarming decline in fertility is a mystery. It’s thought by some scientists that aggressive dairy farming methods lie behind the drop.63 Excessive estrogen might mean an increased risk of ovarian cancer in women, prostate and testicular cancer in men, and breast cancer in both. In countries where fewer dairy products are consumed, young men have much less testicular cancer. The Harvard School of Public Health advises: “Because of unresolved concerns about the risk of ovarian and prostate cancer, it may be prudent to avoid higher intakes of dairy products.” Hormones reside in fat; if you choose to lower your level of estrogen exposure, pick low-fat or nonfat dairy products.

The dairy lobby leaned on states to make it illegal to label milk “rBGH-Free” or “rBST-Free.” But in the fall of 2010, the Sixth Circuit Court of Appeals held that Ohio could no longer ban such labels. The court also found that rBST-produced milk is different in composition from regular milk because it contains more pus, spoils more quickly, and is lower in nutritional quality at some points in the cow’s lactation cycle.69 Concerns about the effect of rBST on the health of both humans and cows have led the European Union, Japan, Australia, and Canada to ban its use. But the United States’ National Institutes of Health, the FDA, and the EPA all maintain that milk produced with growth hormones is safe for human consumption. The bad effects of rBST on cows are the main reason its use has been banned in most of the industrialized world. It would be a kindness to cows to ban its use in the United States as well.

The hormones produced by animals’ bodies have Frankenstein first cousins: manufactured chemicals that act like, or mess up the action of, natural hormones. Called “endocrine disruptors,” they can be found in plastics, cosmetics, toys, pesticides, herbicides, linings of metal food cans, flame retardants, and many other products. They escape from products, get into air and water, and hence into food and our bodies. Even human breast milk now contains endocrine disruptors. Women who breast-feed are generally horrified to learn that they will lower their own load of some endocrine disruptors by transferring them to their babies.75 (Breast-feeding is still strongly recommended because of its many other benefits.) Because the effects of low doses of hormones and endocrine disruptors can’t be predicted from studying high doses (as is done with other cancer-causing chemicals), the whole approach to evaluating their safety has to be different. High doses of them might occasionally be harmless, but tiny doses cause lasting effects!76 An endocrine disruptor can act alone or synergistically, in combination with other endocrine disruptors. They can have a big effect in minuscule amounts—often not noticeable until many years after exposure. This makes them devilishly hard to understand. How do endocrine disruptors get into cows? Most of them probably come from cow feed. They accumulate in cows’ fat.77 Pesticides that are known to be or are suspected of being endocrine disruptors, and which are applied to crops used to feed cows, include the five leading herbicides applied to corn and soy in the United States: atrazine; glyphosate; 2,4-D; acetochlor; and metolachlor.78 (Organic farmers aren’t allowed to use these chemicals, so the risk is almost eliminated in organic dairy and beef products.)

Another endocrine disruptor is perchlorate. Perchlorate is very harmful to thyroid glands, which play a key role in growing brains. In the spring of 2009, the CDC found perchlorate in all the major brands of infant formula sold in the United States. Perchlorate is in rocket fuel, and it gets into the environment during rocket and missile tests. Perchlorates are also used in the carpet industry, explosives, and a variety of industrial processes. Perchlorate has contaminated the water supply in over half the states and thus gotten into cows and human babies. Tainted infant formula powder mixed with tainted water, the CDC warns, could constitute an unsafe dose for a baby.79 A study of female rats found that when they were exposed to the levels of perchlorate found in our environment, the rats’ thyroid glands and reproductive systems were affected.80 Dioxins are yet another type of endocrine disruptor. They occur naturally but are also released by fires and industrial activities. Dioxins can cause cancer, birth defects, genetic mutations, and thyroid, reproductive, and immune system disorders. According to the World Health Organization, over 90 percent of humans’ dioxin exposure comes from nonorganic meat, fish and shellfish, and dairy foods.81 In their groundbreaking Our Stolen Future (1997), Theo Colborn, Dianne Dumanoski, and Pete Myers presented an overview of some probable side effects of this chemical storm of endocrine disruptors: a dramatic drop in male sperm counts in parts of the world over the last two generations, defective sexual organs, lower IQs, behavioral abnormalities in children, more cancers, and gender-ambiguous wildlife. An individual’s exposure to endocrine disruptors at critical times can affect multiple generations, probably because of epigenetic changes (particular genes being turned on or off). To be clear, something you eat or drink before conceiving a baby or while pregnant or nursing might, many years later, affect the health of your great-grandchild. Think about that. This warning applies to future fathers as well as to mothers.82 Endocrine disruptors can sometimes cause delayed reproductive maturation in boys.83 In girls, some scientists think endocrine disruptors help trigger the too-early development of breasts and pubic hair and the onset of menstrual periods. American girls today get their periods, on average, several months to a year earlier than they did forty years ago, and they develop breasts a year or two earlier. At age eight, roughly 18 percent of white, 43 percent of black non-Hispanic, and 31 percent of Hispanic girls in the United States have entered puberty.84

What’s in beef that could cause so much harm? There appear to be many parts to the answer. Prime suspects are the saturated fat and the heme iron in red meat. Heme iron, found in animal proteins, is believed to be inflammatory.18 The heterocyclic amines and polycyclic aromatic hydrocarbons that form on the surface of red meat cooked at high temperatures may cause colon cancer in people with certain genes.19 And (in mice at least) diets like the Atkins diet that are high in protein from red meat, and low in carbs, can promote hardening of the arteries.20 Processed beef (such as that in hot dogs and cold cuts) contains nitrates and nitrites (and sometimes nitrosamines) that can lead to cancer. Nitrates can also cause hardening of arteries. There’s more salt in processed meats, too, and salt raises some people’s blood pressure.21 A new theory is that a substance abundant in red meat, carnitine, is eaten by particular gut bacteria and turned into something nasty, a chemical called TMAO (trimethylamine-N-oxide). TMAO makes it harder for the body to excrete cholesterol and easier for cholesterol to bind to artery walls. The higher your blood levels of TMAO, the more likely you are to have a heart attack. In fact, TMAO levels predict your risk of heart attack better than cholesterol levels, although they are rarely tested.

In 2014 the farm bill was passed with a price tag of over $956 billion the next 10 years. It eliminates direct payments, substituting additional subsidized crop insurance for corn and soy producers, insurance heavily subsidized by taxpayers.   CITATION 9: The Des Moines Register said that commodity groups did not fight elimination of direct payments because the crop-insurance program was even more generous.

Editorial. February 5, 2014. Farm Bill sends our country in wrong direction. St. Louis Post-Dispatch (and also Globe Gazette).

Farmers are not the ones who benefit from record profits in corn, it’s the companies they buy from – suppliers of agrochemicals (Bayer, Syngenta, BASF), farm equipment (Deere), fertilizer (Mosaic), pesticides, and patented seeds.  Also the exporters: Cargill, Archer Daniels Midland, and Zen Noh, who control 80% of corn exports.  Just 4 companies control 60% of terminal grain facilities, and just 4 control meatpacking (JBS, Tyson Foods, Cargill, National Beef Packing).


This is why Iowa insists it remains first in the nation to force candidates to pledge to continue to subsidize corn. Iowa farmers got $8.7 in subsidies between 1996 and 2001, even though they didn’t conserve soil and water as required.  Those who were fined by the federal government appealed to county commities who restored 97% of the money

CITATION 14 John McCormick et al., April 20, 2002. Farmers’ penalties rarely stick. Des Moins Register.


Posted in Antibiotics, Biodiversity Loss, CO2 and Methane, Pollution, Soil | Tagged , , | 1 Comment

Detecting Food Stamp Fraud

[ The number of Americans on food stamps has been trending up for years, in August 2012 it was 15% of Americans, 47,102,780 people. The Supplemental Nutrition Assistance Program (SNAP), has quadrupled in cost since 2001, and doubled in cost since President Obama took office in 2008. You can find out how many are today at SNAP (Supplemental Nutrition Assistance Program), and total population at Current USA and World Populations.

Food stamps are important because we’re only 9 meals away from a revolution.  For as long as the government can keep feeding people, the worst of social unrest, looting, rioting, mass migrations, and civil wars can be held off.  

Since the carrying capacity of the U.S.A without fossil fuels is about 100 million people (the population in 1920 before fossil fuels tripled carrying capacity), quite a few more of us will be on food stamps over the next few decades.

Below are excerpts from 5 different government documents on the SNAP program (formerly the food stamp program) about getting rid of fraud.  It turns out that there is very little fraud to get rid of, and as Stacy Dean points out in her testimony “In comparison, the Internal Revenue Service (IRS) estimates an average tax noncompliance rate of 18.3% for tax years 2008 through 2010. This represents a $458 billion loss to the federal government in one year. Under-reporting of business income alone cost the federal government an average of $125 billion per year between 2008 and 2010, and non-farm sole proprietors under-report their income by 63%.  Yet another case of injustice where the rich steal billions while a very, very small number of poor make off with a few illegal pennies.

Alice Friedemann   www.energyskeptic.com  author of “When Trucks Stop Running: Energy and the Future of Transportation”, 2015, Springer]

Statement of Kevin W. Concannon, Under Secretary for the Food, Nutrition and Consumer Services Before the House Subcommittees on Government Operations and Interior June 9, 2016

Kevin W. Concannon: The program currently provides food assistance, nutrition education and work support services to 44.3 million low-income individuals according to the most recent month of data. In Fiscal Year (FY) 2014, 64% percent of SNAP recipients were children, seniors, and those with disabilities and 42% of SNAP participants lived in a household with a working adult. In other words, the vast majority of recipients are people who already work or, because of age or disability, are not expected to work.

In contrast to commonly heard rhetoric, SNAP does have work requirements. In general, those who are able to work must register to do so, they must accept a job if offered, and they may not voluntarily quit or reduce work hours in order to become eligible for or continue receiving SNAP. This requirement is not waivable. Those who violate the work requirements face sanctions and may be permanently disqualified from SNAP. In FY 2015, 13.6 million SNAP recipients were registered for work. SNAP’s Employment and Training (E&T) program helps participants prepare for and secure good paying jobs, serving about 600,000 SNAP participants in FY 2014 and more than 1 million participants in FY 2015. USDA continues to expand its capacity to administer the SNAP E&T program nationally and work with States to strengthen their programs to help more SNAP participants gain skills and find work. FNS recently established the Office of Employment and Training to better target E&T resources to the most effective strategies.

During economic downturns, every $1 issued in SNAP benefits generates up to $1.80 in economic activity. Every time a family or individual uses SNAP benefits to put food on the table, it benefits the store and the employees where the purchase was made, the truck driver who delivered the food, the warehouses that stored it, the plant that processed it, and the farmer who produced the food. In short, SNAP strengthens individuals, their families, and their communities.

SNAP also operates with efficiency. Almost 95% of Federal SNAP spending goes directly to families to buy food. Most of the rest goes toward the Federal share of State administrative costs. Only a small portion goes to Federal administration, including oversight of State operations and monitoring of retailers that accept SNAP. Relative to other federal means-tested programs, SNAP spends far less on program administration.

On the Federal side, we establish rules and regulations, provide monitoring and oversight of State administration of the program, pay the full cost of SNAP benefits ($69.7 billion for FY 2015),

USDA takes the lead on the authorization, monitoring and oversight of stores that redeem SNAP benefits—over 260,000 stores around the country.

Punishments can include permanent disqualification and even prosecution.

According to the latest data available, in FY 2015 when more than 45.7 million people participated in the program, States conducted approximately 723,000 investigations resulting in over 46,500 disqualifications for recipient fraud and collected almost $86 million in fraud claims from households. The FNS has succeeded in reducing trafficking from about 4% to 1.3% over the last 20 years. While the trafficking rate is low, and 98.7% of the benefits are used properly, we continue to focus on this vital area because, when almost $70 billion (in FY 2015) in taxpayer supported benefits are involved, continuous attention, energy and diligence is required.

Statement of Mike Carroll Secretary, Florida Department of Children and Families “SNAP: Examining Efforts to Combat Fraud and Improve Program Integrity” Committee on Oversight and Government Reform Subcommittees for Government Operations and The Interior June 9, 2016

I am proud of what Florida has accomplished, and I have a unique and firsthand perspective on it. I started with the Florida Department of Children and Families more than 26 years ago helping people with their eligibility applications. Back then, applications were still on paper, and filled out with a pencil. On the days after it rained, lines would wrap around the building. Applicants had to come in sometimes multiple times to provide interviews and ensure their applications were submitted correctly. It was, of course, inefficient for everyone involved, but it was the best we could do at the time. Modernization Today, Florida is a leader in the modernization of our social services system, and virtually every state in the nation has come to Florida to study our model.

Our efforts have led to a nearly 100 percent accuracy rate on applications, with 93 percent being submitted online, allowing us to reduce our eligibility staff from 7,000 to 4,000. Over the years, our cost per eligibility transaction has dropped from $30 to $7. Our experience in Florida is a testament to how government can run an operation that is cost-effective, efficient and optimizes access to services in a simplified way for customers.

However, we have a new fight on our hands with a growing epidemic of identity theft and trafficking. We are not talking about “mom and pop” storefront operations or cottage industries. We are talking about major criminal enterprises with ties to other serious and dangerous criminal activities including drug sales, prostitution and human trafficking.

In Florida, we have implemented effective front-end detection systems and common-sense legislation that addresses obvious fraud and abuse at the roots. We have banned EBT card transactions at all adult entertainment and gambling venues and in the purchase of alcohol, created a fraud reward program, enhanced criminal penalties for fraud, and revised the definition of EBT trafficking in Florida law to include swapping food benefits for weapons or controlled substances. In addition, our Office of Public Benefits Integrity last year conducted more than 23,000 investigations resulting in more than $27.6 million in cost avoidance.

Florida was the first state in the nation to partner with the Food and Nutrition Service in the battle to combat ID theft.  The current burden of proof for recipient fraud is “clear and convincing,” which is a higher burden of proof than for retailer fraud. We should reduce the burden of proof for recipient fraud to “preponderance of evidence.” Right now it is easier to arrest a recipient than to disqualify them from the SNAP program. When it comes to retailer fraud, we need a bigger army and more cohesive approach. 1. The U.S. Department of Agriculture’s Office of Inspector General has sole authority to investigate retailer fraud, yet has 1/10th of the resources in Florida as the Health and Human Services’ Office of Inspector General. 2. FNS needs to immediately suspend a SNAP Authorized Retailer upon criminal arrest. 3. We need stronger federal policies to require repayment from retailers. Currently, retailers rarely are required to repay trafficked amounts in administrative sanctions. We need to send a strong message that fraud will not be tolerated.

Opa Locka The largest food stamp trafficking bust in the federal program’s history occurred just last month at a flea market in South Florida. It was great work, but it also demonstrates how much more work we need to do. Operation Stampede so far has resulted in the arrests of 22 owners of SNAP authorized retailers and uncovered – just for the past year – $17 million in fraud.

Officers found thousands of dollars in cash and guns, storefronts that were actually drug sale operations, and human trafficking and prostitution. Also uncovered were empty storage rooms, unsanitary conditions, rotten produce, empty display boxes, and even plastic fruit and vegetables on display. One store owner was an illegal alien who used someone else’s Social Security Number to get FNS authorization. Another owner was here on a work permit. And yet another failed to disclose they were a convicted felon.

Since 2011, there has been nearly $89 million in SNAP transactions at this location. We now have to look at more than 41,000 authorized SNAP recipients just since July – and that number is growing – to find cases that might rise to the level of “clear and convincing evidence.” And, the trafficking has not stopped. Today, there are at least eight authorized retailers with transactions consistent with the pattern of fraudulent activity for which this location is now well known. In the first two weeks following the raid, these stores had over $163,000 in SNAP redemptions involving over 1,100 recipients.


United States Government Accountability Office Testimony Before the Subcommittees on Government Operations and the Interior, Committee on Oversight and Government Reform, House of Representatives.  SUPPLEMENTAL NUTRITION ASSISTANCE PROGRAM Enhanced Detection Tools and Reporting to Combat Recipient Fraud Are in Development Statement of Kay E. Brown, Director Education, Workforce, and Income Security Issues GAO-16-719T

SUPPLEMENTAL NUTRITION ASSISTANCE PROGRAM Enhanced Detection Tools and Reporting to Combat Recipient Fraud Are in Development Why GAO Did This Study In fiscal year 2015, SNAP, the nation’s largest nutrition support program, provided about 46 million people with $70 billion in benefits. Fraud has been a long-standing concern in the program,

What GAO Found.  In 2014, GAO found that selected states employed a range of tools to detect potential Supplemental Nutrition Assistance Program (SNAP) recipient fraud, but they faced challenges, including inadequate staffing levels, that limited the effectiveness of their actions, and the Food and Nutrition Service (FNS) lacked data about the states’ efforts. The 11 states GAO studied reported using detection tools required or recommended by FNS, among others, to combat SNAP recipient fraud. However, 8 of these states reported difficulties in conducting fraud investigations due to reduced or stagnant staff levels and funding despite program growth, and some state officials suggested changing the financial incentives structure to help support the costs of investigating potential fraud.

GAO found FNS’s recommended website monitoring tools to be less effective than manual searches and impractical for detecting internet posts indicative of SNAP trafficking—the misuse of program benefits to obtain non-food items. Further, although FNS required states to monitor SNAP households that request at least four replaced electronic benefit transfer (EBT) cards in a year, GAO found that multiple EBT card requests in the same benefit period may not indicate increased risk of trafficking. GAO found that, by adjusting the analysis to focus on SNAP households that both requested cards in at least four different monthly benefit periods and engaged in suspicious transactions, states could possibly detect potential fraud more accurately. For example, in 2014, GAO found that 4,935 SNAP households in Michigan received at least 4 replaced EBT cards in a year. However, out of these householders, GAO identified 39 households that both received multiple replacement cards in at least four different monthly benefit periods and engaged in suspicious transactions indicative of SNAP trafficking, resulting in 10 or more trafficking flags. GAO reported that this type of targeted analysis may help provide states with a starting point for identifying higher priority households for further review, which can be particularly helpful given that states had reported having limited resources for conducting investigations.

In fiscal year 2015, the federal government provided more than $70 billion in benefits to help about 46 million people purchase food through SNAP. On average, recipient households received about $258 a month in assistance in that year.

FNS program officials have had long-standing concerns that some recipients can falsify information to receive benefits, or misuse their benefits to solicit or obtain non-food goods, services and cash—a practice known as trafficking.

The goal of SNAP, formerly known as the federal Food Stamp Program, is to help low-income individuals and households obtain a more nutritious diet and help alleviate their hunger. It does so by supplementing their income with benefits to purchase allowable food items. The federal government pays the full cost of the benefits and shares the responsibility and costs of administering the program with the states. Specifically, FNS is responsible for promulgating program regulations and ensuring that states comply with these regulations by issuing guidance and monitoring their state activity. FNS headquarters officials are assisted in this oversight work by federal officials in seven regional offices. FNS also determines which retailers are eligible to accept SNAP benefits in exchange for food and investigates and resolves cases of retailer fraud. State officials, on the other hand, are responsible for determining the eligibility of individuals and households, calculating the amount of their monthly benefits and issuing such benefits on an electronic benefit transfer (EBT) card in accordance with program rules.

Trafficking is an intentional program violation that includes acts of fraud, such as making false or misleading statements in order to obtain benefits and trafficking (i.e., using benefits in unallowable ways, such as by exchanging benefits for cash or non-food goods and services or attempting to do so).8 For example, recipients can traffic benefits by selling EBT cards to another person, exchanging the EBT card and the corresponding Personal Identification Number (PIN)9 for cash or non-food goods or services (e.g., rent or transportation). These sales can occur in person or by posting offers on social media and e-commerce sites. Recipients can then contact state agencies to report the sold EBT cards as lost or stolen and receive new cards which can be used for future trafficking transactions, for example, when the benefits are replenished the next month.


SNAP: Combating Fraud and Improving Program Integrity Without Weakening Success Testimony of Stacy Dean, Vice President for Food Assistance Policy, Center on Budget and Policy

On average, SNAP recipients receive about $1.39 per person per meal in food benefits. One in seven Americans is participating in SNAP — a figure that speaks both to the extensive need across our country and to SNAP’s important role in addressing it.

Policymakers created SNAP to help low-income families and individuals purchase an adequate diet. It does an admirable job of providing poor households with basic nutritional support and has largely eliminated severe hunger and malnutrition in the United States.

When the program was first established, hunger and malnutrition were much more serious problems in this country than they are today. A team of Field Foundation-sponsored doctors who examined hunger and malnutrition among poor children in the South, Appalachia, and other very poor areas in 1967 (before the Food Stamp Program, as SNAP was then named, was widespread in these areas) and again in the late 1970s (after the program had been instituted nationwide) found marked reductions over this ten-year period in serious nutrition-related problems among children. The doctors gave primary credit for this reduction to the Food Stamp Program. Findings such as this led then-Senator Robert Dole to describe the Food Stamp Program as the most important advance in the nation’s social programs since the creation of Social Security.

During the recession, as the official poverty rate rose from 12.5 percent to 15.1 percent, SNAP enrollment rose to respond to this increase. Poverty stayed high through 2014 (the most recent year for which data are available), at 14.8 percent,

Participation rates among eligible people grew from 69 percent in 2007 to 83 percent in 2014 (the most recent year available). Several factors likely contributed to these rising rates. The widespread and prolonged effects of the recession, particularly the record long-term unemployment, may have made it more difficult for family members and communities to help people struggling to make ends meet.

Long-term unemployment hit record highs in the recession and remains unusually high; in May 2016, about a quarter (25.1 percent) of the nation’s 7.4 million unemployed workers had been looking for work for 27 weeks or longer. That’s much higher than it’s ever been (in data back to 1948) when overall unemployment has been so low.

The percentage of SNAP benefit dollars issued to ineligible households or to eligible households in excessive amounts fell for seven consecutive years and stayed low in 2014 at 2.96 percent, USDA data show. The underpayment error rate also stayed low at 0.69 percent. The combined payment error rate — that is, the sum of the overpayment and underpayment error rates — was 3.66 percent, low by historical standards.5 Less than 1 percent of SNAP benefits go to households that are ineligible. (See Figure 7.) If one subtracts underpayments (which reduce federal costs) from overpayments, the net loss to the government in FY2014 from errors was 2.27 percent of benefits.

In comparison, the Internal Revenue Service (IRS) estimates an average tax noncompliance rate of 18.3 percent for tax years 2008 through 2010 (the most recently studied years). This represents a $458 billion loss to the federal government in one year. Underreporting of business income alone cost the federal government an average of $125 billion per year between 2008 and 2010, and nonfarm sole proprietors underreport their income by 63 percent.

Internal Revenue Service, “Tax Gap for Tax Year 2008-2010, Overview,” April 28, 2016, https://www.irs.gov/PUP/newsroom/tax%20gap%20estimates%20for%202008%20through%202010.pdf

Low-income earners often experience sharp fluctuations in their monthly income, making household income difficult to predict accurately for SNAP benefit calculations. Some states instituted administrative practices designed to reduce errors that had the unintended effect of making it harder for many working-poor parents to participate, largely by requiring them to take too much time off from work for repeated visits to SNAP offices at frequent intervals, such as every 90 days, to reapply for benefits.


Statement of Mary Mayhew Commissioner, Maine Department of Health and Human Services SNAP: Examining Efforts to Combat Fraud and Improve Program Integrity The Government Oversight Committee Subcommittees for Government Operations and The Interior June 9, 2016

When Governor LePage took office in January 2011, Maine had a record 250,000 people on SNAP with annual expenditures on benefits of $330 million out of a population of 1.3 million people. To strengthen the program integrity of SNAP in the

In a recent case in Maine a 33 year old man was arrested in a drug raid that found crack cocaine, guns, cash and 5 EBT cards. The EBT cards were all in the name of someone other than drug dealer arrested. One of the cards issued had been re-issued to the recipient 47 times in a span of a few years. In another similar case last year in Maine a drug felon was accepting SNAP-loaded EBT cards as payment for the illicit drug Fentanyl, which is 50 times more potent than heroin and responsible for thousands of overdose deaths.1 We know there is a very unfortunate and direct connection between benefits trafficking and the drug-trafficking world, but federal SNAP regulations often create barriers to pursuing cases against these traffickers. FNS rules state categorically that if someone has the EBT card and the PIN, FNS considers them an authorized user of the EBT card. Law enforcement officials give us examples of persons arrested with drugs and EBT cards who tell them they are going grocery shopping for the person whose name is on the card. Because of the regulation, there is little we can do to stop that practice. The regulation should be changed to require authorized users to register as such with the welfare agency overseeing the program and should be limited to no more than three per case at any given time.2 This is similar to how the Woman, Infants and Children (WIC) program operates currently in Maine, which is also administered by Maine DHHS, and is permitted under federal regulation.

Another key strategy in Maine’s mission to deter welfare fraud has been to place photos on our EBT cards. This is a common sense measure that provides protection against trafficking or theft. When someone’s picture is on their card, it only follows that they are less likely to sell it for cash or trade it for drugs. We have seen the results – while EBT cards still turn up in drug-related arrests too often, we don’t see EBT cards with photos turning up in those raids.

In Maine, we have found that out of state usage of our EBT cards is a major warning sign of fraudulent activity. In 2011, Maine had more than $15 million in welfare benefits spent outside of Maine, including significant amounts in places like the Bronx, Brooklyn, Philadelphia and Worcester, Massachusetts.4 Our Law Enforcement partners informed us these are known drug trafficking cities, with heroin and other drugs flowing up the I-95 corridor to Maine. Our data analytics software alerts us when someone has used a Maine EBT card exclusively in other states for two consecutive months. We then follow up with the client to ensure there is no inappropriate use and that they still reside in Maine. By working with this EBT data extensively, we cracked down on inappropriate out of state welfare use. As a result, out of state usage of Maine EBT cards has been reduced to $8 million a year.

Unfortunately, the data still shows regular usage of SNAP benefits in places all over the country, like Brooklyn, New York, California and the Walt Disney World area of Florida. Federal regulations don’t currently allow states to restrict SNAP benefits to certain geographic areas. We don’t believe it is right for Maine SNAP benefits to be spent by someone living outside of Maine and we see the connection between interstate usage of EBT and fraud. We believe there should be some reasonable restrictions on the mobility of EBT cards.5

Retailer Fraud and Non-compliance Often when SNAP benefits cards are trafficked it is in conjunction with a SNAP approved vendor who is helping turn the card to cash that can be used to purchase things other than food. In some cases, the offending stores are small “convenience” type stores. There are many of these stores participating in the SNAP program that may not be meeting the goals of the “ nutrition” program based on their real food inventories. For example, in one Maine case of suspected retailer fraud this year, a small store with just one cash register had SNAP reimbursements totaling nearly that of a large local Hannaford chain grocery store with 18 cash registers. We were alerted to the potential fraud because our data tracking found numerous instances of $300 and above purchases in this small store that had no grocery carts to carry out that amount of produce. The same store is suspected of trading cash for EBT cards and helping SNAP participants commit tax fraud.

Retailer Oversight In the case that a store is committing fraud or is in non-compliance with food standards, states do not have the authority to remove them from SNAP participation. We rely on the federal government for that function. The investigator we have in our region does a great job, but we know that USDA is resource constrained in our region in terms of investigating and disqualifying offending stores. Only 8 stores in Maine have been sanctioned since 2011.

Welfare enrollment, particularly in SNAP, has had explosive growth since 2000. SNAP has grown from 17 million to 45 million people.10

Welfare fraud has followed the trend and in Maine we’ve seen a disturbing and strong connection to the drug problem. We can’t sit idly by as taxpayer funded programs help fuel the drug trade through trafficking or divert scarce resources away from hungry children and needy families. We have an obligation to deter fraud, protect benefits for the truly needy and secure taxpayer’s peace of mind that their money isn’t being wasted.

STATEMENT SECRETARIES’ INNOVATION GROUP

One out of every seven Americans currently receives Food Stamps. The Supplemental Nutrition Assistance Program (SNAP), which is known as Food Stamps, has quadrupled in cost since 2001, and has doubled in cost since President Obama took office in 2008. States face an uphill battle on reforming this program.

FOOD STAMP PROGRAM PROBLEMS AND RECOMMENDED SOLUTIONS 1) The “Nutrition” program allows the purchase of soda, candy and other harmful products PROBLEM: The Supplemental Nutrition Assistance Program is intended to subsidize nutrition for needy families. Instead it is fueling the Obesity problem in America. Too many recipients are utilizing their benefit to purchase items that are not only void of nutrition, they are damaging to their health. “More than one-third of adults and 17% of youth in the United States are obese,” according to the Journal of the American Medical Association.1 The Obesity epidemic, driven in part by poor choices in Food Stamp purchasing, costs the U.S. and states billions of dollars. According to a Health Affairs study, the medical costs associated with Obesity are an estimated $147 billion in 2008.2 This massive spending certainly includes state’s Medicaid programs, which is a major cost driver in state and federal budgets.


Posted in Poverty, Starvation | Tagged , , , | Comments Off on Detecting Food Stamp Fraud

How are energy storage batteries coming along? U.S. House hearing 2015

[ My favorite quotes from this U.S. House of Representatives session:

THOMAS MASSIE, KENTUCKY. I want to say this has been a very enlightening hearing, and it confirms my personal experience, which is batteries are not sexy. Buckets of acid in your basement do not evoke envy from your neighbors [like solar panels].  But the reality is this is what’s holding our country back, this is what’s holding renewable energy back. In fact, this is holding nuclear energy back, this is holding coal-fired energy back. I mean all these peak issues, they apply to any energy source that we have. And so I think even though it’s not as sexy as some of the other topics, it is fundamentally very important to moving forward in our country is to have a better battery. The world needs a better battery.

Chairman LAMAR S. SMITH, TEXAS. In ideal circumstances, wind generates up to 18% of Texas’ power. But even with this significant capacity, Texas wind energy cannot produce power on demand. And when energy needs are the highest, wind makes up just 3% of Texas power generation.

Dr Jud Virden, Pacific Northwest National Laboratory. But despite many advances, we still have fundamental gaps in our understanding of the basic processes that influence battery operation, performance, limitations, and failures.

Alice Friedemann   www.energyskeptic.com  author of “When Trucks Stop Running: Energy and the Future of Transportation”, 2015, Springer and “Crunch! Whole Grain Artisan Chips and Crackers”]

House 114-18. May 1, 2015. Innovations in battery storage for renewable energy. U.S. House of Representatives.   88 pages.

Excerpts:

Chairman WEBER. Today, we will hear from government and industry witnesses on the state of large-scale battery storage, and recent technology breakthroughs achieved through research and development at the national labs and universities around the country. Although large-scale battery storage has been available for decades, there is still more work to be done. Fundamental research and development into the atomic and molecular structure of batteries is needed to better understand the operation, performance limitations, and the failures of battery technology.

Chairman LAMAR S. SMITH, TEXAS. My home State of Texas offers a ready example of the impact battery storage could have on harnessing renewable power. Texas is the top wind producing state in the country. The Lone Star State currently operates more than 12,000 megawatts of utility-scale wind capacity; about 1/5 of the total wind capacity in the United States. In ideal circumstances, wind generates up to 18% of Texas’ power. But even with this significant capacity, Texas wind energy cannot produce power on demand. And when energy needs are the highest, wind makes up just 3% of Texas power generation.

Dr Jud Virden, Associate Lab director for Energy & Environment Directorate, Pacific Northwest National Laboratory.

PNNL recently published the first Institute Scientific Investigation, looking at the atomic level changes in lithium ion batteries that enabled us to visualize why they short-out and fail. The expected lifetime of lithium ion battery systems today is generally believed to be 5 to 7 years, and grid storage batteries will need to last ideally 15 to 20 years. This groundbreaking work also confirmed a new approach that might dramatically extend the lifetime of lithium ion batteries. But despite all these advances, we still have fundamental gaps in our understanding of the basic processes that influence battery operation, performance, limitations, and failures.

Renewable energy creates many challenges for grid operations. Their generation profile does not match up exactly with demand, and their generation is intermittent. In the Pacific Northwest, we have five gigawatts of wind, and sometimes hundreds of megawatts or even gigawatts. Texas has the same problem with wind, and California with solar. Battery storage could solve these problems by smoothing out the intermittent generation, and storing energy off-peak to be used later when it was most needed.

Several of our PNNL studies have concluded that for battery storage to be viable, it must serve multiple grid applications, such as meeting energy demands minute-by-minute, hour-by-hour, storing renewable energy at night for use the next day, as well as deferring transmission and distribution upgrades. Utilities would like battery storage to deliver both high power and lots of energy. This is like wanting a car that has the power of a Corvette, the fuel efficiency of a Chevy Malibu, and the price tag of a Chevy Spark. This is hard to do. No one battery delivers both high power and high energy, at least not very well or for very long.

While today’s batteries can address the higher value-added grid applications, the cost of batteries need to be reduced, the lifetime expanded, and the safety validated. We believe there are three key research and development challenges that need to be addressed to significantly improve existing advanced battery systems in the near term, along with the longer term development of the next generation, lower cost battery systems.

Continued support for basic and applied R&D is needed to discover new battery systems, and to better understand and predict why batteries don’t perform as expected, why performance degrades over time, or why they fail.

Mr. ALAN GRAYSON, FLORIDA. Intel spends $5 billion a year on research and development. There are several drug companies that actually match that or exceed it. Why don’t we see the same thing with regard to batteries? Batteries are over $100 billion a year in revenue, why don’t we see Eveready or Duracell or Rayovac doing the same kind of research?

Dr. WHITACRE. There was a very interesting report done by the DOE, perhaps almost ten years ago now, that assessed this, and one of the findings was that, early on, for lithium ion batteries specifically, that in North America the return on investment on this kind of technology is a very long investment window. Japan and other Asian nations were more willing to invest over that long period of time, compared to North America. I think it’s very difficult for North American industry to double- down on a very capital-intensive, very costly situation.

Mr. GIUDICE, CEO, Ambri.  This is not unique to batteries. This is one of the energy challenges that the energy industry faces, especially the electricity industry, and it’s part of the nature of the industry structure. It’s a highly regulated industry, both federal and state. It’s not an industry that goes easily into change. When you have the 30-year lifelong assets that they’re dealing with, they’re not of the mindset of let’s keep reinventing ourselves every couple of years. And so I think that it really suggests why there’s such an important federal and other public policy roles to bring us to a better energy future.

The fundamental economics do not reward innovation at this stage, and consequently, the regulations are not such that they’re spurring change across the board. And it relates to smart metering, it relates to all kinds of aspects of the electric industry. It’s not just as it relates to storage.

Dr. VIRDEN.  When you start wandering into the grid and the energy storage space, the fundamentals, it’s a high capital, high risk, long-term payback, and fragmented market, and it makes for uncertainty.

Dr. GYUK. Pumped hydro plants were built to cope with the hoped-for development of nuclear power, because nuclear power likes to put out flat electricity, and the pumped hydro was intended to follow the load and do the up-and- down [balancing]. Since nuclear power is not as big a component of our national energy budget as was intended, the impetus for doing pumped hydro is less.

It’s also very expensive to build a new pumped hydro plant.

When you take into account a long lifecycle, a pumped hydro could run for 20, 30 years easily. You amortize over that period and the cost—the lifecycle cost then becomes lower than most batteries. And that’s what we have to crack with battery research. The same is also true for compressed air energy storage, of which we have two very good examples in the world; one of them in Alabama in Huntsville, and the other one in Germany.  That’s another bulk technology that amortizes over long periods of time, and will give us good output.

Chairman SMITH. Dr. Virden, you mentioned in your testimony that I heard that there are number of gaps in our knowledge about developing the next generation battery, and looking for the next breakthrough. Given those gaps, do you want to give us any kind of a timeline, any kind of a prediction as to when we might make those kinds of breakthroughs that will dramatically change the way we use alternative forms of energy?

Dr. VIRDEN.  Maybe five or ten years out are all kinds of ideas of—you know, every battery has an anode and a cathode, just like your car battery, and an electrolyte in between. And you see all kinds of press releases about a new anode material that’s five times better than anything out there, and it probably is, but as Dr. Whitacre was saying, when you put that in with an electrolyte and a cathode, and put it together and then try to scale it, all kinds of things don’t work. Materials start to fall apart, the chemistry isn’t well known, there’s side reactions, and usually what that leads to is loss of performance, loss of safety. And we as fundamental scientists don’t understand those basic mechanisms.

You need that fundamental research that continues to move the state of knowledge along so companies can take that and utilize it, and the unique tools that the Department of Energy provides they can utilize.

Then you need companies to spin it out and move it along. And we do really undervalue the challenge of scale-up. In every materials process I see, in an experiment in a lab like this big, it works perfectly. Then when you want to make thousands of them—it doesn’t.

And as to why it’s so hard to move things out, there’s 3,000 utilities in this country, and they don’t have R&D budgets, and they don’t have venture capital budgets.  Also, the fragmented market makes it very difficult for the ultimate end-user to do the R&D.

Chairman SMITH. You said 5 to 10 years, so I gather that’s what you’re thinking. Let me ask the other witnesses real quickly my last question. What do you think is going to be the next great breakthrough?

Dr. WHITACRE.  It’s difficult for me to speculate on which vector the breakthrough should be in. There’s energy density, there’s power density, there’s cost, there is lifetime, there is sustainability. These are all different axes of innovation. And my sense of what is most important is cost and lifetime.  I propose that there are tens of amazing bench-scale results already out there that could be breathtaking and super innovative, but getting them to the next level, getting into something that is repeatable, demonstrable, that is scalable, there’s a tremendous amount of fundamental and basic science in that process. And I often think that there’s a boundary drawn between basic science and applied science that is maybe technically a little false.   There’s a tremendous amount of basic fundamental research in the process of making more than one tiny example of something, and how do we make that work. And energy technologies in general are about replicating and scaling, and this is one of the disconnects. It’s so easy to do one thing, … and my life’s work the past six years has been making it repeatable.

Dr. VIRDEN. I’m going to use the all-of-the-above response on this one. And I truly believe you have to have the basic research to provide the long-term foundation. There’s some really cool technology ideas out there, but if you don’t have the applied sciences, where most of the battery work starts to fall apart is when you take it out of the lab, put it in a real world battery system, and it’s that applied science that starts to troubleshoot and figure out why they’re not performing the way they should. The theoretical densities are always really high. When you make one, it drops way down. And then you can’t get the full feedback until you do demonstrations. And if you don’t have all those parts of the ecosystem, it’s hard to innovate rapidly.

Dr. GYUK. Couldn’t agree more. And that’s what our program has tried to do; take the applied ideas, drive them through developing the devices, and then get them out in the field and see how well it performs in the field in the real-life situation. And we need to have that entire chain from support of basic scientific research, through the scaling into prototypes and beyond, and the applications for the first early adaptors and demonstrations out in the field.

Mr. THOMAS MASSIE, KENTUCKY.  I listened to your list of materials, Dr. Whitacre, and I was glad I didn’t hear unobtainium.  This is a problem that we have when we try to scale things from the lab with mass production if you pick a material that’s hard to obtain or hard to find at those scales. And I think one thing we need to be careful of  is that we don’t trade one set of moral encumbrances for another if we design materials into our batteries that aren’t available domestically, or only available in politically unstable regions.

Dr. GYUK. Yes. There are two charts that I keep in my mind when I think about new technologies. One is the chart of crustal abundances, which tells you how abundant the things are in general, and it also has a subsection on what materials are industrial materials. Vanadium is an industrial byproduct of the steel industry.

The other one is the chart of electric potentials. You need materials that give you a large voltage window. Can’t be too large if you’re dealing with water, otherwise you’re producing hydrogen and you may explode. But these two together define the limits of what we look into.

Mr. GRAYSON. The basic idea of a battery, the anode, the cathode, the electrolyte, that idea is roughly 200 years old, about as old as our country, and it is interesting when you consider all of the other technologies that have been developed in the meantime; the telephone, the computer, television and so on, that we’re still basically using the same model that was used 200 years ago. Is there any realistic prospect of moving beyond that model for energy storage?

Dr. WHITACRE. There are certain thermodynamic realties about storing electricity and materials, and those realities drive us to a sort of bipolar design where you have two separate material systems that retain different positive and negative charges when you apply a current to them. It’s hard to imagine a different paradigm using the materials as we understand them today to allow this. The anode and cathode are a natural reflection of thermodynamics, so if you’re talking about electrochemical storage, I don’t think so. This is the paradigm. The key is to enhance our understanding and to maximize performance, and explore new material systems and new electrode designs and so forth.

Dr. VIRDEN. I would agree with the previous witnesses’ comments, if you’re trying to store electrons directly, the battery storage is really the only way to go about it. And it has practical challenges which, over those 200 years, I don’t think we’ve been faced— we’ve had to face the real issues of batteries, but with transmission distribution constraints, renewables, we’re now having to face directly, you know, how do we store energy in a battery.

Dr. GYUK.  I need to agree with what you have heard so far. If you’re doing electrochemistry, you have certain limitations on the system. Nonetheless, there are directions one can go in. I do not necessarily believe that lithium ion is the end all and be all, even for cars.

Mr. GRAYSON. Following up on my colleague’s question regarding distributed versus centralized storage, it seems to me that one of the key factors in that regard, whether you store electricity or energy centrally, or whether you store it household-by-household or business-by-business, is whether there are any significant economies with scale in the storage that would make up for the transmission losses that you would encounter when you distribute that energy from a centralized source. So please tell me, again, starting with Dr. Whitacre, whether you see any likely economies of scale in storage of energy that would offset the transmission losses.  Just to be clear, do you see a future of big storage, big batteries, or a future of small storage, small batteries?

Dr. WHITACRE. I see an intermediate situation. There’s certainly not a single battery in the center of the country, and there’s certainly not a battery in each of our pockets. There’s an intermediate distribution of storage where there’s an optimal distribution. Maybe it’s at a neighborhood level or at a block level. There is some optimal economy of size and distribution. I’m not sure what it is, but it’s probably more than a residence, but smaller than an entire city.

Dr. VIRDEN. I think it’s going to be distributed at the substation level, several megawatts in a few megawatt hours. This is beyond frequency regulation where you have tens of megawatts. That’s the higher value-added market right now. I see the home market behind the meter as longer term, except in a few places like California and Hawaii.

That Tesla announcement, by the way, you’ll get a battery pack that’s $3,000, you still have to buy the inverter, so it’s $4,500, and that would give you about 7 kilowatt hours. That’s not going to take you off-grid. Our estimates to go off-grid in a home, you’re spending $15,000 to $20,000 or more, so it’s still expensive.

Dr. GYUK. We consider distributed storage to be on the distribution side, which means substation and maybe slightly above or slightly below, from 500 kilowatts to about 10 megawatts. These are the easiest applications. If we are going to go into residences, it’s not so much residences as small businesses, campuses, business parks, where it makes sense to be behind the meter. Individual residences are probably a market considerably in the future.

Mr. MARK TAKANO, CALIFORNIA. What about any kind of systems that might generate hydrogen or  store hydrogen through electrolysis? I don’t know the science of it, but in combination with a fuel cell.

Dr. WHITACRE. While this is completely technically possible, and folks are still looking at doing it, one reality is the roundtrip energy efficiency of that kind of system is, at best, 60% maybe on the very best day. Most of the time it’s 50% or less. And it’s because the thermodynamics of converting water to hydrogen, and then converting it back to water and getting electrons, and storing electricity through that process, is inherently inefficient.  That’s difficult to compete with the 80 or 90% roundtrip efficiency of batteries. And that’s a big, big deal when we talk about each electron is worth money.

Mr. THOMAS MASSIE, KENTUCKY. I want to say this has been a very enlightening hearing, and it confirms my personal experience, which is, batteries are not sexy, okay. Buckets of acid in your basement do not evoke envy from your neighbors, even though blue solar panels on your roof might. But the reality is this is what’s holding our country back, this is what’s holding renewable energy back. In fact, this is holding nuclear energy back, this is holding coal-fired energy back. I mean all these peak issues, they apply to any energy source that we have. And so I think even though it’s not as sexy as some of the other topics, it is fundamentally very important to moving forward in our country is to have a better battery. The world needs a better battery.

Posted in Batteries, Energy Storage, U.S. Congress Energy Policy | Tagged , | Comments Off on How are energy storage batteries coming along? U.S. House hearing 2015

Energy as a weapon: Implications for U.S. policy U.S. House hearing 2006

[ My favorite quotes from this session:

Mr. Lynch: E.F. Schumacher said in 1964: “There is no substitute for energy: the whole edifice of modern life is built upon it. Although energy can be bought and sold like any other commodity, it is not ‘just any other commodity’ but the precondition of all commodities, a basic factor equally with air, water, and earth.”

Mr. Shays: Without fuel, obviously, the world would grind to a halt.  It seems to me is that when we are done with this hearing, an honest assessment is that the United States is very vulnerable and so is the rest of the world. But given that we consume 20 to 25 percent of the world’s energy, we are going to feel the impact the most.

With less than 3% of the world’s oil but 25% of its use, we can never drill our way to energy security.

We need to slow the growth of demand significantly by better conservation, better mileage. When is the administration going to weigh in on that side of the equation to say minivans, SUVs, and trucks need to be getting the same gas mileage as cars and we need to bring cars up significantly? When is that going to happen?

Ms. HARBERT. I think we’ve been very, very aggressive on the energy conservation, energy efficiency front. We have tremendous incentives out there for consumers to change their behavior. We have a philosophy of incentivizing change, not mandating change.

Mr. SHAYS. Why? Why, why, why? Why would we do that? My daughter’s life was saved because we mandated seat belts and air bags. It would not have happened soon enough if the market did it. Why is this administration only looking at the market without trying to add value to it by getting us to act sooner? Why, why, why? I don’t understand it.

Ms. HARBERT. We believe in a balance, and there are certain things we’re willing to mandate and certain things we’re willing to leave to consumer choice. Things that affect consumer choice, we ought to incentivize that behavior and not force that behavior.

Mr. SHAYS. I think you put our Nation at risk by that policy. I think you put our Nation at big risk.

Alice Friedemann   www.energyskeptic.com  author of “When Trucks Stop Running: Energy and the Future of Transportation”, 2015, Springer and “Crunch! Whole Grain Artisan Chips and Crackers”]

House 109-204. May 16, 2006, Energy as a weapon: Implications for U.S. policy. U.S. House of Representatives. 146 pages.

Excerpts:

Darrell E. Issa. Gasoline is over $3 a gallon, and it is a very visible sign of our energy dependence. But far less visible and perhaps far more serious threat to our economic well-being and the pursuit of our vital national interest is the increasing constraint producing countries place on the full range of our foreign and domestic policy options. As we see these stress points on our ability to make independent domestic and foreign decisions, this committee has become increasingly concerned that oil is not only a weapon but is a viable weapon of those who have an agenda not in sync with the United States and perhaps not with the rest of the free world. Some producers have proven entirely too willing to use energy as a weapon, or as blackmail, in the words of Vice President Cheney. Others cannot resist the populist temptation to nationalize energy resources despite history’s lessons that it undermines production over the long term and acts as a destabilizing force once prices drop.

At this time, other producers are undermined by emerging groups seeking to cutoff energy supplies from world markets. Consuming countries are belatedly reassessing their options in a shifting world of geopolitics, and more cooperation must be and should be absolutely necessary. However, some consumers, such as China, have naively and seemingly stepped away from the open market and sought out long-term supplies through state-to-state agreements.

What if we had an abrupt shock to the oil supply when we have, in fact, no spare production? What would a supply shock do to our economy and to those of our trading partners? How are the Departments of State and Energy, represented here today, working to ensure the supply of energy? And is the Federal Government doing enough to meet the challenges not just for today, but for tomorrow?

It is my hope that today’s hearing will not only more clearly identify the ramifications of our oil dependency on the economic and national security interest, but also begin to identify—and this is most important—how to deal with those ramifications.

Mr. LynchI want to read you something E.F. Schumacher said in 1964: “There is no substitute for energy: the whole edifice of modern life is built upon it. Although energy can be bought and sold like any other commodity, it is not ‘just any other commodity’ but the precondition of all commodities, a basic factor equally with air, water, and earth.”

Mr. Shays.  Dependency on foreign-supplied fuels is an emerging threat to our national security and to the security of the international community. Suppliers understand fuels such as oil or natural gas can be used to influence or compromise our policies. The U.S. economic growth is a key force that propels the world economy. Fuels supply the energy that helps nations increase their standard of living.

Without fuel, obviously, the world would grind to a halt.  It seems to me is that when we are done with this hearing, an honest assessment is that the United States is very vulnerable and so is the rest of the world. But given that we consume 20 to 25 percent of the world’s energy, we are going to feel the impact the most.

President Bush highlighted the risks of foreign fuel dependency when he declared ‘‘America is addicted to oil’’ and insisted the United States ‘‘break this addiction.’’ While recognizing the problem is laudable, little has been done to solve it. We must break this addiction because suppliers exploit American energy dependency to influence our policies and terrorists see oil as our Achilles heel. Frankly, it is our Achilles heel.

In many cases, the supply of these fuels is threatened by individual groups and regimes opposed to U.S. policies, often located in the more politically unstable parts of the world. The former Primer Minister of Malaysia Mahathir Mohamad said, ‘‘If we reduce oil output, prices will rise. Oil can be used as a weapon to protect the interests of Muslims.’’ I find it interesting he used the word ‘‘Muslims’’ and not just his own folks. Al Qaeda’s Osama bin Laden and his deputy al-Zawahiri have repeatedly called for attacks on key economic targets, especially energy sources. Ali Larijani, secretary of Iran’s Supreme National Council, said ‘‘we would not like to use our oil as a weapon. We would not like to make other countries suffer.’’ Interesting way of saying, basically, they will.

We are funding both sides in the war on terrorism, ironically— U.S. military and, on the other side, energy suppliers who support Islamic militants. Kicking the habit is an urgent necessity. Our national security is threatened by our dependency on foreign countries that share neither our views on democracy nor our commitment to combat radical Islamist terrorists. With less than 3% of the world’s oil but 25% of its use, we can never drill our way to energy security. Only by creating a forward-looking energy policy that reduces demand for fuels, especially oil, will we be able to lower gas prices and ensure a long-term independence.

KAREN HARBERT, Assistant Secretary for Policy & International Affairs, U.S. DEPARTMENT OF ENERGY.

Energy is the lifeblood of economies around the world; global economic growth depends on adequate, reliable and affordable supplies of energy.

As traditional energy resources become less available and more difficult to develop, energy security will become an even more critical component of economic security and national security.

A few key trends are of particular concern. Most of the energy that drives world economies today is derived from fossil fuels, in particular petroleum, and this energy comes from a relatively small number of producers.  The world’s dependence on a few countries is neither responsible nor sustainable over the long term. Resources are often located in places that are geographically hard to reach, geologically difficult to develop, politically unstable, or unfriendly to new foreign investment.

We believe that energy security is inextricably intertwined with our economic prosperity and our national security. Access to a secure, reliable, affordable supply of energy is fundamental to our national economic security. As such, and as the world’s largest producer and consumer of energy, the United States must play a leading role in addressing the world’s energy challenges and ensuring a secure energy future for all.

As traditional energy resources become less available and more difficult to develop, energy security will become an even more critical component of economic security and national security. A few trends are of particular concern: The world’s energy dependence on a few countries. Obviously, record-high oil prices. Resources that are now located in places that are geographically hard to reach, geologically difficult to develop, politically unstable, and unfriendly to new investment.

Much of the world’s untapped hydrocarbon resources are controlled by governments and national oil companies, with limited access afforded to United States and multinational energy companies. The new resources are concentrated in the Middle East, North Africa, Russia, and Central Asia. Saudi Arabia is estimated to have over 260 billion barrels of oil, while in Africa, Nigeria and Libya have about 75 billion barrels of oil reserves. Other countries with sizable reserves include Iraq, the United Arab Emirates, and Kuwait. And the EIA estimates that proven oil reserves are between 17 and 44 billion barrels in the Central Asian Caspian region.  Russia has proven oil reserves and they are conservatively estimated at about 60 billion barrels, and it has tremendous natural gas reserves.

The real threat is lack of investment. The International Energy Agency estimates that in order to meet world demand by 2025, $16 trillion of investment will be required. That investment largely depends on market transparency in producing countries. Complex, capital-intensive projects require stable, predictable investment climates. With long time horizons, investment is needed now—not tomorrow, but now.

The Advanced Energy Initiative is focused on technologies that we believe hold the greatest promise for American taxpayers—solar, wind, biofuels, hydrogen, nuclear, and clean coal technologies. We have an abundant source of coal here in this country. We need to be able to have more nuclear power.

I think in the short term we have the strategic petroleum reserve. But we also can’t forget the next best source of energy is the one that we currently waste. And there’s a tremendous amount that we can do in energy efficiency and conservation in the short term.   The spare production capacity right now is between about a million and 1.5 million barrels per day. Which means that we’re operating a very razor thin margin.

Mr. SIMONS. Oil investment has very long lead times and there are very, very long cycles that are involved. So the production that’s coming on board today really comes about as a result of investment decisions that were made back in 1997, 1998. And the price of oil, of course, is very cyclical as well. So we had low prices in the late 1990’s, throughout the 1990’s, and we really had a deficit of investment. So we don’t have the volumes coming onstream right now that take care of the expansion in global economic growth. But a lot of this had to do with the low price environment back then. Today we have, obviously, a much more robust pricing environment. Companies and countries are investing much more aggressively. But we do have to consider this lead-time issue.

Mr. VAN HOLLEN. Our short-term options are constrained now because we failed to take significant steps early on. A very simple step we could have taken was to increase the CAFE standards. I think this Government—and I speak for Congress and the administration both—have been grossly negligent in not taking action much earlier to raise it above the 27.5 miles per gallon and closing the SUV loophole. There are things that we could have done that would at least limit the severity of the price hikes and reduce our reliance on foreign oil.

Mr. SHAYS. We need to slow the growth of demand significantly by better conservation, better mileage. When is the administration going to weigh in on that side of the equation to say minivans, SUVs, and trucks need to be getting the same gas mileage as cars and we need to bring cars up significantly? When is that going to happen?

Ms. HARBERT. I think we’ve been very, very aggressive on the energy conservation, energy efficiency front. We have tremendous incentives out there for consumers to change their behavior. We have a philosophy of incentivizing change, not mandating change.

Mr. SHAYS. Why? Why, why, why? Why would we do that? My daughter’s life was saved because we mandated seat belts and air bags. It would not have happened soon enough if the market did it. Why is this administration only looking at the market without trying to add value to it by getting us to act sooner? Why, why, why? I don’t understand it.

Ms. HARBERT. We believe in a balance, and there are certain things we’re willing to mandate and certain things we’re willing to leave to consumer choice. Things that affect consumer choice, we ought to incentivize that behavior and not force that behavior.

Mr. SHAYS. I think you put our Nation at risk by that policy. I think you put our Nation at big risk.


Ms. HARBERT. The problem is everybody wants us to have a magic bullet, a panacea that we have that we’re not willing to use. We don’t have it. It takes a long time to get in this situation and it’s going to take us a long time to get out of it. We need to do everything we can in the short term to be better consumers of energy, and we need to have the foresight to make the investments now in those technologies that will help us over the long term to not be energy vulnerable.


DANIEL YERGIN, CHAIRMAN, CAMBRIDGE ENERGY RESEARCH ASSOCIATES.  We hear that half of Brazil’s motor fuel is ethanol, but that is equivalent to 3 percent of our gasoline supply. So what we have to keep in mind is the scale of our more than 20 million barrels a day of consumption.


[It is important] to protect infrastructure and the energy supply chain. That was not something that was really thought about when the current energy system was created in the 1970’s. Energy efficiency and conservation is terrifically important.


In the United States, we talk about energy independence, but as we know, we have gone from a third to 60 percent of our oil being imported, and we are going to be importing a lot of gas. We are at a historic juncture. This great surplus of extra capacity that was a legacy of the 1980’s is, at least for the time being, gone. We like to talk about energy as though we are an island. We are not. We import more oil than any other nation consumes.


The biggest growth in demand worldwide has been for “middle distillates”: diesel, jet fuel, and heating oil. But the global refining system does not have enough deep conversion capacity to turn heavier crudes into middle distillates. This shortfall in capacity has created additional demand for the lighter grades of crude.


As always happens when prices are high and supplies uncertain there is much discussion about whether the world is going to run out of oil. In the 1970s the term was “the oil mountain” as in “the world was about to fall off the oil mountain”. The geographic imagery has become more elevated—today it is “peak oil”. [But it’s more likely to be a] plateau in production reached closer to the middle of the century.  We currently project worldwide liquids production capacity (not actual production ) to gro to 105.3 mbd in 2015, and include oil sands, gas-to-liquids, and deepwater.  After 2010, growth capacity will be concentrated in the “Oil 15” (the O-15) which will cause increased foreign policy concern.


Every day 40 million barrels of oil cross oceans on tankers.


Mr. Lynch. Among the chief factors that have facilitated recent rises in oil prices has been increased worldwide consumption and demand as countries such as China and India have experienced significant economic growth. However, it is the United States that remains the world’s leading oil consumer, consuming over 20 million barrels of the roughly 80 million barrels produced worldwide each day, while producing only about 7 million barrels daily. Notably, our high oil consumption, coupled with the weakened reserve position, means that the United States for the most part, will continue to rely on the world markets for its crude oil supply. According to the Energy Information Administration’s last International Energy Outlook, 70 percent of U.S. oil consumption is projected to be satisfied by crude oil and petroleum product imports by the year 2025. Regrettably, our growing dependence on foreign oil not only poses a substantial risk to our economic security, but may also serve to compromise the effectiveness of American foreign policy as high domestic demand leaves the United States susceptible to the threat of hostile oil-related political actions by foreign governments in oil-producing countries.


Iran, for example, the second-largest producer within the Organization of Petroleum Exporting Countries, has repeatedly issued thinly veiled supply disruption threats in response to U.S.-led efforts to curb that country’s uranium enrichment program. In addition, Venezuela President Hugo Chavez, whose country is the United States fifth-largest source of crude imports, has similarly asserted the possibility of retaliatory oil-related actions stemming from his opposition to U.S. policy. In April 2004, Hugo Chavez threatened to stop selling oil to the United States if we did not stop ‘‘intervening in Venezuela’s domestic affairs.’’ And in February 2006, President Chavez again asserted that the U.S. Government should know that if it crosses the line it will not get Venezuelan oil. As evidenced by these examples, America’s addiction to foreign oil means that our economy and foreign policy is extremely vulnerable to oil-related threats issued by, in some cases, rogue oil-producing states.


Posted in U.S. Congress Energy Dependence | Tagged , , | Comments Off on Energy as a weapon: Implications for U.S. policy U.S. House hearing 2006

Tax reform & federal energy policy: incentives to promote energy efficiency. U.S. Senate hearing.

[ By far the best strategy to cope with energy decline is to prepare by making homes, businesses, appliances, vehicles, and so on more energy efficient.  If it turns out that renewable energy has too low an EROI to sustain civilization as we know it, or unable to keep the electric grid up because energy storage never becomes commercial, or the instability is too great to cope with at some level of penetration, or so many fossil fuel (mainly natural gas) plants are still required because of the inability to rely on intermittent wind and solar and its seasonality, then energy efficiency is the MAIN “solution” to the coming energy crisis.

Alice Friedemann   www.energyskeptic.com  author of “When Trucks Stop Running: Energy and the Future of Transportation”, 2015, Springer]

Senate 112-814. December 12, 2012. Tax reform & federal energy policy: incentives to promote energy efficiency. U.S. Senate hearing, 211 pages.

Excerpts follow:

JEFF BINGAMAN, NEW MEXICO, CHAIRMAN.   The tax code has long served as a way to promote energy policy goals. For most of this time, the code only offered incentives for the production of energy, first from mineral resources and then from oil and gas. Recent years have brought important incentives for renewable energy resources, though unfortunately many of those still remain temporary and uncertain. Even more recently, Congress has decided to reintroduce certain tax incentives that promote the efficient use of energy, recognizing the value in preserving our domestic resources by developing technologies that use less energy to accomplish the same task. However, with the possibility of comprehensive tax reform in the next Congress, and within the context of a contentious debate on how to close the Federal deficit, we need to assess the existing policies to determine if their goals are worth the cost to the taxpayer, and, if they are —and I believe that energy efficiency is a worthy policy goal—then we need to examine the best, least-cost ways of achieving that goal.

Dan Arvizu, Director of the National Renewable Laboratory.  Research into new, more efficient ways to construct, modernize, and operate our homes and commercial buildings and businesses is an important part of our mission.  The megawatts that are not used are just as important as the megawatts that are.

Three years ago, McKinsey produced a landmark analysis that showed that, by 2020, the U.S. could reduce non-transport energy consumption by a quarter. That would cost $520 billion but would pay back $1.2 trillion in energy cost savings. In 2010, the National Academy of Engineering and Science’s report also found that the Nation could save money by cutting energy consumption by 30 percent and produce the same amount of goods and services.

One project we participated in with Target stores in Colorado cut energy consumption by 35 percent, and they are now busy replicating that enterprise- wide.

Private residences, which comprise a little more than half of the energy used by buildings in the U.S., provide equally large opportunities for savings. The DOE’s Building America program has demonstrated that homes can have a 40% energy reduction at no additional cost in almost every U.S. climate zone. A Habitat for Humanity home built under this program likewise proved that ambitious energy efficiency targets and goals can be accomplished with very tight cost constraints.

Simulation tools like DOE’s Energy Plus package and the building optimization program are continually being refined so that businesses, consumers, utilities, government agencies, and policymakers have the most accurate energy insights and can make the best efficiency decisions possible.

Industrial energy efficiency is one area where our new technology can dramatically improve performance. An example is the fast- growing data center industry. Set to open next year, NREL’s new peta-scale high-performance computing system is the leading edge, both in computing and also in energy efficiency. A comparable existing standard data center today would be 13 times more energy- consuming than the NREL system.


STEVE NADEL, Executive Director, American ?Council for an Energy-efficient Economy.   In our research we have found that the tax incentives that were enacted in the 1980s were not very effective in spurring substantial energy savings, as these credits promoted tried-and-true energy efficiency measures that many consumers and businesses were installing on their own. Most of the participants were what we call ‘‘free riders.’’ They took the money but would have taken the same actions even without the incentives. Furthermore, the amount of the tax credit in the 1980s was too small to spur many additional investments. On the other hand, tax incentives enacted in 2005 were more targeted. They emphasized advanced technologies and paid higher incentives. Our review of the experience with these has found that the tax incentives for new homes and appliances, in particular, were very effective in growing the market for qualifying homes and appliances and that the incentives for residential heating and cooling equipment, were also very successful in encouraging development of new products and purchases of the most efficient products.

Based on these experiences—I am turning now to your second question—we concluded that the most useful tax incentives target long-term structural changes in the market using temporary Federal assistance to build the market for energy-efficient products so the tax incentives can be phased out. At this point, the market can continue to grow, supported by other energy efficiency programs and policies such as EnergyStar, utility energy efficiency programs, building codes, and equipment efficiency standards.

Advanced products and services should be specified in terms of performance, leaving it to manufacturers and service providers to decide which technologies to use to reach the specified performance levels. By focusing on products with efficiency levels that currently have a very small market share, we can keep costs down and minimize the number of free riders.

A Federal role is particularly useful in the early stages of market development, because the Federal Government can provide a national market with uniform qualifying criteria and incentives, making it more likely that manufacturers and contractors will make the investments to develop market- qualifying energy-saving technologies and service. It is much harder to transform markets without Federal involvement.

We found that the most cost-effective options include tax incentives for commercial buildings, energy-efficient new homes, heating and cooling equipment and appliances, and combined heat and power systems. We also found that whole-house energy-saving retrofits and replacing old chillers were also very cost-effective.

The average cost to the Treasury for all of these credits was only 28 cents per million Btu saved. This is less than a tenth of what the average energy cost is.

Combined heat and power (CHP) systems are poised to make substantial strides, as utilities and their customers look to replace old, dirty power plants that are now being retired. A tax incentive will spur more combined heat and power systems during this critical period. The provision in the bill modestly expands an existing CHP incentive now on the books to address some issues with the previous incentive that will help make it more workable. We found this to be one of the most cost-effective provisions we examined. I also wanted to briefly note that the chiller provision in S. 3352 is also very timely. It will provide a credit to encourage replacing old, inefficient chillers that contain CFC refrigerants. CFCs, as you probably all know, harm the ozone layer and have not been permitted in new chillers for many years. However, some of the old chillers remain, leaking CFCs and using excessive amounts of energy.


MATT GOLDEN, Principal, efficiency.org, & Policy Chair, Efficiency First, San Francisco, CA.   Energy efficiency is unique in that it creates its own cash flow. Simply put: it pays for itself. However, there are significant market barriers that prevent this vital resource from being harvested more effectively. One of the key steps towards a solution is to begin to account for energy savings as a resource. Reducing demand on the grid through energy efficiency is akin to building power plants, only cheaper, 100% domestic, and completely clean.  Power plants supply predictable amounts of energy into established markets, and utilities can easily raise capital to make these investments in energy supply. However, we lack the same capital sources and markets for energy efficiency, even though it is widely understood to be the most cost-effective resource for meeting our energy needs. In fact, the energy we have saved through energy efficiency efforts in the last 40 years equates to a resource that is greater than any other single energy source in the country: greater than nuclear, natural gas, or coal.

Grocery stores comprise another key category. Because of the need for both large refrigeration systems and oftentimes commercial-scale bakeries and kitchens, the grocery segment has some of the highest per-square-foot energy costs of any retail business. Grocery represents 2% of the nation’s commercial floor space, but consumes 5% of total commercial building energy consumption. The slim margins of a modern-day grocery chain-about 2% on average on one hand demand that energy improvements be cost- efficient. On the other hand, the substantial energy needs of these stores means big opportunities for savings, and equally large returns on investment. One assessment showed that $1,000 saved in utility bills can have the same bottom-line impact as $50,000 in new grocery sales.

In August of this year, my research institution, NREL, took the next step by assessing the impact that some 400 laboratory-tested and peer-reviewed energy efficiency measures could have if deployed in the United States [“A Tool to Prioritize Energy Efficiency Investments”; Philip Farese, et al; NREL TP-6A20-54799].

This work showed there are multiple pathways for the nation to reduce energy use in buildings by one-half by 2030. And if we do so, the energy cost savings would equal twice the dollar amount invested.

A leading example of R&D success is the Commercial Building Partnership (CBP), a publicprivate, cost-shared program. Sponsored by DOE, it partners building owners and operators, National Laboratories like NREL, and technical experts from the private sector. The CBP has examined scores of different energy efficiency measures spanning a full range of building components-from more efficient sales floor lighting to use of reflective roof coatings. The partnership has included some of the biggest names in the retail business, including WalMart, Target, Best Buy, JCPenny, Home Depot, and Kohl’s. And by virtue of these players alone, the program can have impact: Total floor space operated by these retailers is 1.7 billion square feet.

Energy efficiency begins with how the building wings are oriented toward the sun, and also determined the 60-foot width of each wing, an interior breadth that enables thorough day-lighting and natural ventilation for all occupants. Windows are optimally sized, placed, and shaded to maximize daylight while minimizing unwanted heat losses and excessive gains. A below-building labyrinth of massive concrete structures stores thermal energy. Precast concrete insulated panels provide significant thermal mass to moderate the building’s internal temperature.

Although energy improvements in new homes are critical, more than 70% of the U.S. housing stock was built before 1990, before the most energy- efficient building codes were put in place.

Industry represents 31 percent of U.S. energy consumption, and there exists huge potential for energy savings in the U.S. industrial and manufacturing sector.

The average American family spends over $1,800 per year on energy, which equates to over $200 billion. This represents 22% of all US energy consumption, 35% more energy than is used for passenger cars and trucks combined.

A regrettable but profoundly important lesson for contractors and program champions in the US relates to what happened in the failed Australian program in 2009-2010 under a stimulus-driven energy efficiency home retrofit program. In summary the program was halted prematurely in large part due to the fact that there was little to no risk management practices applied to the work being done – which resulted in deaths of workers and claims of widespread fraud in the program. After the program was halted, the insulation industry had to be bailed out by the government as it had ramped up to meet the expected long-term demand for energy efficiency home improvements. The negative implications impacted the entire manufacturing and supply chain, not to mention insulation contractors large and small. As a result of a lack of focus on contractor qualifications and a minimum standard of care for the work done, and the unchecked rush to create “stimulus” jobs, the energy efficiency home retrofit industry in Australia may be set back a generation. Congress needs to bake into any performance based tax credit, credible contractor qualifications – to protect consumers, workers, contractors, and tax payers.

Generally, in the program in Australia, a minimum standard of care, built on a foundation of quality, was not prevalent and consistent at all levels. Our industry cannot afford to have a program go bad and set us back. As such, Efficiency First is supportive of programs that “do no harm” to occupants and workers and have consistency with respect to: 1. Qualified Auditors & Contractors (the right people) 2. Quality Standards & Specifications (doing the right work) 3. Qualified Software and other Tools (using the right tools), and 4. Oversight by a Credible and Robust Quality Assurance Infrastructure (verification)

Energy costs are regressive by nature, with lower income homeowners paying a substantially higher portion of their income towards energy costs. Helping these families reduce their expenses puts money directly into needed services and into local economies. Americans should never be put into a situation of having to decide to pay their utility bill going to the doctor and paying for their critically needed medication. By improving the energy efficiency in homes, Americans are then free to spend those savings on other critical needs. According to the National Association for State Community Services Programs (NASCSP) Over 51,000 New Mexican households fall below 50% of the poverty level, paying around 52% of their annual income towards their energy bills alone. Another 70,000 New Mexican households fall between 50-100% of the poverty line, paying on average 18% of their annual income towards their energy bills. By comparison, the average middle-income family pays 3% of their annual income towards their energy bills.

Since 2009, New Mexico has weatherized over 3,700 homes with Recovery Act funds alone, enabling these families to save between $250 to $400 annually on the energy bills depending on the type of dwelling and fuel.

Due to the inability of many lower income homeowners to maintain equipment such as HVAC and water heaters there is a resulting increase in dangerous indoor air quality issues that can lead to asthma and allergies. Simply stabilizing the temperature in a home or building may help reduce incidents of mold and reduce dust mites, which are both major triggers of respiratory health problems. Both home performance and weatherization apply building science principles that treat the house as a system, it is common to see significant improvements not just in energy, but also in air quality and comfort.

British Thermal Unit (BTU) is the standard unit of energy measurement in the United States. A 100 W light bulb burning for 2900 hours consumes about a million Btu’s.

Energy, water and pumps.  Pumps account for 10% of global electricity demand. With the latest available technology, we can cut this figure in half, assuming universal adoption of high-efficiency pump systems. Upgrading pumps and pump systems in domestic and commercial buildings, industrial applications, and municipal water and wastewater systems can yield significant energy savings.

Many of the pumps currently used in buildings were designed more than 50 years ago. These pumps are often highly inefficient, running continuously at top speed regardless of actual performance demand.

Another example of energy-saving technology is demand-driven distribution of water in municipal water systems. The existing water infrastructure is outdated in many parts of the United States, leading to leaking pipes and significant water loss.

A recent survey by the Chicago-based Center for Neighborhood Technology of 55 water utilities in the Great Lakes region showed annual leaks totaling 66.5 billion gallons of water. This number is equivalent to the annual water consumption of more than 500,000 households. Intelligent pump systems can reduce these kinds of leakages by up to 50%. Electricity consumption in the distribution system can also be reduced by up to 50%. The problems with outdated water infrastructure and high levels of water loss illustrate the importance of looking at water efficiency as an integral part of policies to promote energy efficiency.

Efficiency standards and tax incentives.  A major challenge in the adoption of intelligent pump technology is lack of commonly accepted efficiency standards and lack of awareness among users. While energy efficient light bulbs, windows and many other appliances are highly visible, pumps tend to be hidden in mechanical rooms. In this sense, pumps are among the last unexplored frontiers of energy efficiency. Greater awareness about the energy efficiency of pumps and pump systems should be a part of any comprehensive strategy to boost energy efficiency in the US. In Europe, the pump industry developed a voluntary measuring and labeling system for energy efficiency in 2005. In 2009, this action was followed by official EU minimum standards for energy efficiency in pumps. These standards are expected to save the equivalent of the residential electricity consumption of 14 million people in the EU.

There are currently no energy efficiency standards for pumps in the US,

We must look at the over 95 million rental and owner-occupied homes that were built before modern energy codes in 1991. Without effective tax incentives, those homes will continue to waste energy and cost the consumer money.

The U.S. Department of Energy (DOE) reports that housing built after 2000 used 14% less energy per square foot than the housing built in the 1980’s and 40% less than housing built before 1950.  As such, there is considerable room for improvement in energy performance even among well designed, constructed and maintained properties. According to the American Housing Survey (2009) almost 81% of the Nation’s stock of apartment properties (with 5 or more units) was constructed prior to 1990, which marks the decade in which the first building energy codes were implemented. This older stock of housing, which is an important source of affordable housing, represents a significant opportunity for achieving energy savings while at the same time adding to the available spending capacity of individuals who live in these apartment homes. This is a significant consideration since in 2010, approximately 70 percent of renter households had incomes below the national median and more than 40 percent had incomes in the bottom quartile. Furthermore, “energy costs as a share of gross rents rose from 10.8 percent to 15.0 percent between 2001 and 2009.

A particular challenge for apartment properties comes in the fact that 80% of apartment residents pay their own utilities so any financial savings due to lowered utility consumption is largely unavailable to the property owner to offset the cost of investment in more efficient systems.”


National Propane Gas Association (APGA).  The National Propane Gas Association (NPGA) is the national voice for the odorized propane gas industry.  Propane’s most well-known use in 42 million American backyard grills, nearly 10 million U.S. households rely on propane for space heating, cooking, hot water and many other needs. These households are predominantly non-urban and off the natural gas main, and they depend on propane gas as a clean-burning, efficient, low-cost and reliable alternative to fuel oil and/or electricity.

Because propane is derived from natural gas liquids, the boom in American natural gas production has brought with it a boom in propane gas. In fact, 5 years ago propane was considered as a net import, with half of the supply produced from oil refining and the remainder from natural gas. Today, propane gas has grown to he considered a net export.

Nearly 100% of propane is produced domestically with over 70% coming from natural gas sources. In 2011, the U.S. exported 12.7% of the total U.S. propane supply, and for 2012 that number is expected to be higher. These are supplies that could, and should, be used here at home.

NPGA believes that any lax incentives for appliance or equipment efficiency contemplated by Congress should require the use of a Full Fuel Cycle analysis as part of the energy efficiency equation. A Full Fuel Cycle (FFC) analysis is the most accurate way to calculate energy use as “ell as environmental emissions. FFC accounts for: Energy consumed in the extraction, processing and transport of primary fuels; Energy losses in electric power-generation or gas processing plants; Energy losses associated with transmission and distribution of fuel to the end user; Greenhouse gas (GHG) emissions associated with each step within this process.

An FFC analysis differs from a site energy, or point of use, analysis because efficiency measurements based on site, or point of use, do not account for the efficiency of all the upstream energy use and emissions associated with delivering the fuel to its point of use. Therefore, it fails to provide a complete energy efficiency, energy consumption and greenhouse gas profile.

The U.S. Department of Energy (DOE) announced on August 18,2011 that it would adopt the recommendations of a study performed by the National Academy of Sciences, which concluded:

“DOE should consider moving over time to use a full-fuel cycle measure of energy consumption for assessment of national and environmental impacts, especially levels of greenhouse gas emissions, and to providing more comprehensive information to the public through labels and other means such as an enhanced website”.

NPGA supports the idea that FFC measurement enables a more comprehensive analysis of the total energy use and environmental impacts and should be included in any energy efficiency rating, building energy consumption, energy use, and energy savings test. It can be applied to everything from appliances to motor vehicles to small or large buildings.

By lowering its building energy costs, the U.S. can be a much more effective global competitor.


Posted in Conserve Energy, U.S. Congress Energy Policy | Tagged | Comments Off on Tax reform & federal energy policy: incentives to promote energy efficiency. U.S. Senate hearing.

Gail Tverberg: Why peak coal, oil, and natural gas will all happen at the same time

The world’s coal resources are clearly huge. How could China, or the world in total, reach peak coal in a timeframe that makes a difference?

If we look at China’s coal production and consumption in BP’s 2016 Statistical Review of World Energy (SRWE), this is what we see:

Figure 1. China's production and consumption of coal based on BP 2016 SRWE.

Figure 1. China’s production and consumption of coal based on BP 2016 SRWE.

Figure 2 shows that the quantities of other fuels are increasing in a pattern similar to past patterns. None of them is large enough to make a real difference in offsetting the loss of coal consumption. Renewables (really “other renewables”) include wind, solar, geothermal, and wood burned to produce electricity. This category is still tiny in comparison to coal.

Figure 2. China's energy consumption by fuel, based on BP 2016 SRWE.

Figure 2. China’s energy consumption by fuel, based on BP 2016 SRWE.

Why would a country selectively decide to slow down the growth of the fuel that has made its current “boom” possible? Coal is generally cheaper than other fuels. The fact that China has a lot of low-cost coal, and can use it together with its cheap labor, has allowed China to manufacture goods very inexpensively, and thus be very competitive in world markets.

In my view, China really had no choice regarding the cutback in back coal production–market forces were pushing for less production of goods, and this was playing out as lower commodity prices of many types, including coal, oil, and natural gas, plus many types of metals.

China is mostly self-sufficient in coal production, but it is a major importer of natural gas and oil. Lower oil and natural gas prices made imported fuels of these types more affordable, and thus encouraged more importing of these products. At the same time, lower coal prices made many of China’s mines unprofitable, leading to a need to cut back on production. Thus we see the rather bizarre result: consumption of the cheapest energy product (coal) is falling first. We will discuss this issue more later.

China’s Overall Historical Production of Energy Products

With the pattern of energy consumption shown in Figure 2, growth in China’s total fuel consumption has slowed, as shown in Figure 3.

Figure 3. China energy consumption by fuel, based on BP 2016 SRWE.

Figure 3. China energy consumption by fuel, based on BP 2016 SRWE.

The indicated increases in total fuel consumption in Figure 3 are as follows: 8.1% in 2011; 4.0% in 2012; 3.9% in 2013; 2.3% in 2014; 1.5% in 2015.

Unless there is a huge shift to a service economy, we would expect China’s GDP to decrease rather rapidly as well, perhaps staying 1% or 2% higher than the growth in fuel consumption. Such a relationship would suggest that China’s reported GDP for 2014 and 2015 may be overstated.

The Problem of Low Coal Prices

Most of us don’t pay attention to coal prices around the world, but according to BP data, coal prices have been following a similar pattern to those of oil and natural gas.

Figure 4. Coal prices since 1999 based on BP 2016 SRWE data.

Figure 4. Coal prices since 1999 based on BP 2016 SRWE data.

Oil prices tend to cluster more closely than those of coal and natural gas because there is more of a world market for oil than for the other fuels. Coal and natural gas have relatively high delivery costs, making it more expensive to trade these products internationally.

Figure 5. World oil prices since 1999 for various oil types, based on BP 2016 SRWE. (Prices not adjusted for inflation.)

Figure 5. World oil prices since 1999 for various oil types, based on BP 2016 SRWE. (Prices not adjusted for inflation.)

Figure 6. Historical prices for several types of natural gas, from BP 2016 SRWE.

Figure 6. Historical prices for several types of natural gas, from BP 2016 SRWE

The one place where natural gas prices failed to follow the same pattern as oil and coal prices was in the United States. After 2008, shale producers extracted more natural gas for the US market than it could easily absorb. This overproduction, together with a lack of export capacity, led to falling US prices. By 2014 and 2015, prices were falling everywhere for oil, coal and natural gas.

Why Prices of Fossil Fuels Move Together

The reason why prices of fossil fuels tend to move together is because commodity prices reflect “demand” at a given time. This demand is determined by a combination of wage levels and debt levels. When wage levels are high and debt levels are increasing, consumers can afford more goods, such as new homes and new cars. Building these new homes and cars takes many different kinds of materials, so commodity prices of many kinds tend to rise together, to encourage production of these diverse materials.

Why Fossil Fuel Prices Don’t Necessarily Rise Indefinitely

Rising fossil fuel prices depend on rising demand. Wages are not really rising fast enough to increase fossil fuel prices to the levels shown in Figures 4, 5, and 6, so the world has had to depend on rising debt levels to fill the gap. Unfortunately, there are diminishing returns to adding debt. We can witness the poor impact that Japan’s rising debt level has had on raising its GDP.

Adding more debt is like using an elastic rubber band to increase the world output of goods and services. Adding debt works for a while, as the relatively elastic economy responds to growing debt. At some point, however, the amount of debt required becomes too high relative to the benefit obtained. The system tends to “snap back,” and prices fall for many commodities at the same time. This seems to be what happened recently in late 2008, and what has happened again recently. The challenge is to restore world economic growth, since it is really robust world economic growth that allows commodity prices to rise to high levels.

Some Historical Perspective on Rising Energy Prices and Rising Debt

In “normal” times, a small increase in demand will increase production of fossil fuels by several percentage points–generally enough to handle the rising demand. Prices can then fall back again and there is no long-term rise in prices. This situation occurred for quite a long time prior to about 1970.

After about 1970, we found that it became more difficult to raise production levels of energy products, without permanently raising prices. US oil production began to decline in 1970. This started an energy crisis that has been simmering beneath the surface for 45 years. Various workarounds for our energy shortage problem were tried, such as adding nuclear, drilling for oil in new areas such as the North Sea, and building more energy efficient cars. Another approach used was reducing interest rates, to make high-priced homes, cars and factories more affordable.

By the late 1990s, even these workarounds were no longer providing the benefit needed. Another idea was tried: encourage more international trade. This would allow the world access to untapped energy sources, including coal, in the less developed parts of the world, such as China and India.

This too, worked for a while, but resource depletion tended to continue to raise the cost of energy extraction. Also, the competition with low-cost labor in India, China, and other countries tended to hold down the wages of the less-educated workers in the developed countries. Higher prices at the same time that wages for some of the workers were depressed is, of course, a bad mismatch.

One way of “fixing” the problem was with cheaper debt, and more debt, so that consumers could buy homes and cars with lower incomes. This fix of more debt stopped working in 2008, as repayment on “subprime” debt faltered, and all fossil fuel prices collapsed.

Figure 7. World Oil Supply (production including biofuels, natural gas liquids) and Brent monthly average spot prices, based on EIA data.

Figure 7. World Oil Supply (production including biofuels, natural gas liquids) and Brent monthly average spot prices, based on EIA data.

To “re-inflate” the world economy, world leaders began to try to add even more debt. They did this by fixing interest rates even lower, starting in late 2008, using a program called Quantitative Easing (QE). This program was successful in raising commodity prices again, although its effect seemed to diminish with time. China’s huge growth in debt during this period helped as well.

Energy prices turned downward again in mid-2014, when the United States discontinued its QE program, and China (under new leadership), decided not to continue increasing debt as quickly as before. The result was a second sharp drop in commodity prices, without a corresponding drop in the cost of producing these fossil fuels. This shift was devastating from the point of view of energy supply producers.

Impact of Lower Prices on China’s Coal Producers

China has a lot of coal resources, but not all of these resources can be produced cheaply. Generally, the least expensive resources tend to be produced first. When prices are high, it may look like deeper, thinner seams can be extracted, in addition to the easier and cheaper to extract seams, but this is never certain. At some point, prices may fall and thus issue a “stop mining” instruction.

When coal prices drop, producers are likely to encounter debt problems, as loans related to coal operations become due. The reason why this happens is because loans taken out when coal prices were high are likely to reflect an optimistic view of how much can be extracted. Once prices drop, operators discover that they have committed themselves to paying back more in loans than their coal mines can actually produce. This seems to be happening now.

What Are the Implications for Future World Coal Production?

If we look at a chart showing world consumption of energy products by fuel, we see that world coal production has turned down in a similar manner to the downturn in Chinese coal production.

Figure 8. World energy consumption by fuel, separately by major groupings.

Figure 8. World energy consumption by fuel, separately by major groupings.

There are many large areas of the world that seem to be beyond their peak in coal production, including the United States, the Eurozone, the Former Soviet Union, and Canada. Note that the United States’ coal production “peaked” in 1998. This added to pressures for globalization.

Figure 9. Areas where coal production has peaked, based on BP 2016 SRWE.

Figure 9. Areas where coal production has peaked, based on BP 2016 SRWE. FSU means “Former Soviet Union.”

If we consider the rest of the world excluding the areas shown separately in Figure 9 as the “Non-Peaking Portion of the World,” we find that China’s current coal production far exceeds that of the Non-Peaking portion of world production.

Figure 9. Coal production in China compared to world production minus production shown in Figure 8.

Figure 10. Coal production in China compared to world production minus production shown in Figure 8.

Figure 10 indicates that even the non-peaking portion of the world is showing a downturn in production in 2015, no doubt relating to current low prices.

Another issue is that India’s coal production now falls far short of its consumption. Thus, India is becoming a major coal importer. In 2015, India’s consumption of coal slightly exceeded that of the United States, making it the second largest consumer of coal after China, and the largest coal importer. If China should decide to increase its coal consumption by adding imports, it would need to compete with India for supplies.

Figure 14. India's production and consumption of coal, based on BP 2016 SRWE.

Figure 11. India’s production and consumption of coal, based on BP 2016 SRWE.

India’s hope for continued economic growth is also tied to coal, even though it doesn’t produce enough itself. India’s use of natural gas is declining, because its own locally-produced natural gas supplies are declining, and imports are expensive.

Figure 11. India's energy consumption by fuel based on BP 2016 SRWE.

Figure 12. India’s energy consumption by fuel based on BP 2016 SRWE.

Imported coal is more expensive than locally produced coal, because of the transportation costs involved. Thus, adding an increasing portion of imported coal will eventually make India’s products less price competitive. India started from a lower wage level than China, so perhaps it can temporarily withstand a somewhat higher average coal price. At some point, however, it will reach limits on how much of its mix can be imported, before workers cannot afford its products made with this high-priced coal.

As noted above, India and China will be competing for the same exports, if they both expect to grow using imported coal. We can modify Figure 9 to show what the size pool producing imports might now look like, if the countries needing imports is “China + India,” and the part with perhaps extra coal to export is the Non-Peaking Areas from Figure 9, less India.

Figure 12. Coal production for China plus India, compared to production from non-peaking group used in Figure 9, minus India. Based on BP 2016 SRWE.

Figure 12. Coal production for China plus India, compared to production from non-peaking group used in Figure 9, minus India. Based on BP 2016 SRWE.

This comparison shows an even a worse mismatch between the peaking areas, and the current production of areas that might raise their supply.

Is Future Coal Production a Function of Resources Available, or of Prices?

Future coal production is clearly a function of both the amount of resources available and future prices. If there are no resources available, it is pretty clear that no resources can be extracted.

What most researchers have not understood is that future prices are important as well. We can’t expect that prices will rise indefinitely, because low-paid workers, especially, find themselves in a squeeze. They find homes and cars increasingly unaffordable, unless the government can somehow manipulate interest rates down to never heard of levels. Because of this lack of understanding of the role of prices, most of today’s models don’t considered the possibility that price levels may cut back production, at what seems to be an early date relative to the amount of resources in the ground.

Part of the confusion comes the view economists have regarding prices, innovation, and substitution. Economists seem to be firmly convinced that prices will always rise to fix the problem of future shortages, but their models do not seem to take into account the major role that energy plays in the economy, and the lack of available substitutes. Certainly, the history of energy prices does not support this claim.

If I am correct in saying that prices cannot rise indefinitely, then all three of the fossil fuels are likely to peak, more or less simultaneously, when prices can no longer stay high enough to enable extraction. The downslope after the peak will be based on financial outcomes, such as the bankruptcies of coal operators, not on the exhaustion of reserves or resources in the ground. This dynamic can be expected to produce a much sharper downturn than modeled by the Hubbert Curve.

If analysts consider the possibility that prices will never again rise very high for very long, they realize such a low-price scenario would be a catastrophe. That is why we hear very little about this possibility.

Conclusion

It appears likely that China’s coal production has “peaked” and has begun to decline. This is especially likely if energy prices stay low, or never rise very high for very long.

If I am correct about energy prices not rising high enough in the future, all fossil fuels may reach peak production more or less simultaneously in the not too distant future. Widespread debt defaults seem likely if this happens.

If we are, in fact, reaching peak coal, even before peak oil, this is disconcerting for those who believe that the Hubbert Model is the only way of viewing the world. Maybe we are expecting too much from the model; maybe we need a model that considers prices, and how prices depend on wages and rising debt. Falling energy prices are especially bad for the system; they seem to lead to debt defaults.

Posted in China, Gail Tverberg, Peak Coal, Peak Natural Gas, Peak Oil | Tagged , , | Comments Off on Gail Tverberg: Why peak coal, oil, and natural gas will all happen at the same time

Why studies come up with different Energy Returned on Invest (EROI) results: can it be fixed?

[ There are many issues with biofuels beyond their trivial to negative energy return on investment (EROI). In Peak Soil I point out that current industrial farming techniques are destroying topsoil about 15 times faster than pre-fossil fuel economies — Iowa has some of the best topsoil in the world, but in the past century, half of it’s been lost, from an average of 18 to 10 inches deep (Pate 2004 May Rains Cause Severe Erosion in Iowa) and it’s hard to grow food in less than 6 inches of soil. In the past it took an average of 1500 years to deplete topsoil enough to cause a society to collapse (Montgomery 2007 Dirt: The Erosion of Civilizations).  The Ogallala and Califiornia aquifers are also getting permanently depleted.

Alice Friedemann   www.energyskeptic.com  author of “When Trucks Stop Running: Energy and the Future of Transportation, 2015, Springer]

Hall, C.A.S., Dale, B.E., Pimentel, D. 2011. Seeking to Understand the Reasons for Different Energy Return on Investment (EROI) Estimates for Biofuels. Sustainability 3:2413-2432.

Excerpts from this 20 page paper follow  (see the original here)

Abstract: The authors of this paper have been involved in a contentious discussion of the EROI of biomass-based ethanol. This contention has undermined, in the minds of some, the utility of EROI for assessing fuels. This paper seeks to understand the reasons for the divergent results.

Introduction

We are in a time of profound transition in how the world will be fueled and fed. The fossil energy resources (petroleum, coal and natural gas) that have powered the world’s economy since the initiation of the industrial revolution are increasingly problematic in terms of their price (and price volatility), security of supply, declining energy return on investment (EROI) and environmental impacts [1]. These issues are well known and will not be discussed further here.

There is a less well known, but very important, positive correlation between the amount of energy that a society has at its disposal and the wealth of that society. Richer societies invariably have more energy available to them than do poorer societies [2-5] Energy consumption is a key factor associated with the greater wealth of richer societies, which makes sense if economic production is thought of as a work process, with more economic production requiring more energy. Billions of people have no access to modern energy services and they are almost invariably poor in economic terms. If fossil fuels are increasingly problematic in cost, availability and environmental impacts, what energy resources, if any, are available to help lift these billions of humankind from their poverty?

Biofuels (liquid fuels made from plant matter) might be affordable alternatives to petroleum with a low carbon footprint and therefore appear to some investigators attractive as a petroleum alternative.

One downside is that this organic matter might have other good functions, such as maintaining soil fertility or forest biodiversity.

The only large scale petroleum alternatives currently available for liquid transportation fuels are biofuels, principally ethanol made from cane sugar or corn starch, and smaller amounts of biodiesel produced from oilseeds. At present corn-based ethanol provides for about 10% by volume of US motor “gasoline” [5], although this is clearly for gross energy and not net energy. The sustainable resource base could be expanded considerably if we were able to use cellulosic biomass as a feedstock (e.g., some portion of crop residues (although coauthor Pimentel believes that no portion of crop residues should be harvested [6], woody materials, grasses and herbaceous crops) in addition to starch and sugar feedstocks.

However, biofuels are controversial. Their environmental impacts, cost, potential scale and EROI have all been questioned. If we are to make informed and rational choices between our alternatives to petroleum, these questions must be addressed and resolved.

This article focuses on the EROI for biofuels. The different results derived from different investigators (including, perhaps especially, ourselves) have caused some prominent analysts to disparage EROI as not being useful because of the highly divergent results of different investigators [7,8.  We emphasize here corn ethanol, for which most of the EROI analyses have been done, and cellulosic ethanol, a possibly promising new alternative to petroleum gasoline. Indeed the controversy about EROI for corn-based ethanol, usually formulated as whether or not corn-based ethanol makes a positive energy gain relative to the fossil fuels used to produce them, is probably the issue by which most scientists and policy makers have encountered EROI.

It is important that we determine whether it is possible to get reliable estimates of EROI for a given fuel. The corn-based ethanol industry is mature and we can derive reasonable empirical results. A number of corn ethanol EROI (or “net energy”) studies have been performed) which are reported in metastudies by Farrell et al. [7], Hammerschlag (2005, [9]) and Chavas (2008, [10]). From among these studies, a large difference in values can be found by comparing the results of Kim and Dale [11], who give an EROI for corn-based ethanol of 1.73:1 and Pimentel and Patzek [12] (who give a value of 0.82:1).

[ My comment Although 1.73 is a positive EROI, it is not nearly enough!  Other researchers estimate that an EROI of 7, 11, or 12 to 14 might be needed to maintain civilization at its current level:

  • Charles Hall, one of the founders of EROI methodology, initially thought an EROI of 3 was enough to run modern civilization, which is like investing $1 and getting $3 back. But after decades of research, Hall concluded an EROI of 12 to 14 might be needed as illustrated in the figure below (Lambert, Jessica G., Hall Charles A. S. et al. 2014. Energy, EROI and quality of life. Energy Policy 64:153–167).
  • Murphy (2013) found that society needed at least an EROI of 11. So much net energy is provided by any energy resource with an EROI of 11 or higher, that the difference between an EROI of 11 and 100 makes little difference. But once you go below 11, there is such a large, exponential difference in the net energy provided to society by an EROI of 10 versus 5, that the net energy available to civilization appears to fall off a cliff when EROI dips below 10 (Mearns 2008).
  • Weissbach (2013) found that it is not economic to build an electricity generating power source with an EROI of less than 7. ] 

In this paper we seek the reasons for these large differences, and explore whether they are due to the measured, verifiable process-related energy consumption for individual processes or instead primarily on boundary and/or other philosophical assumptions or, perhaps, something else. If the reason is the former then indeed there may be some basis for the criticisms leveled at EROI methodology, if the second then these issues are readily accommodated within the EROI protocol format put forth in this issue by Murphy et al. [13].

Procedural/Supply Chain Issues

We use the term supply chain to refer to issues pertaining to the derivation of energy costs, measured per unit input, per unit product or per ha, associated with the various inputs to the production processes. For example if we know that to grow 60 kg (approximately 1 MJ) of maize requires, on average, about one kg of fertilizer, there are various studies that have been done that can give a fairly unambiguous and limited range of energy values associated with that production (Table 1). Similarly it is possible to derive straightforward estimates of the energy to run a tractor pulling a standard plow for one hour, and to derive the hours required per ha. It becomes more difficult to derive other factors that are not based on simple physical variables; for example, the energy that was used to make and maintain the tractor used, and even the building in which the tractor was produced. But while we do not have look up tables for the energy to make a kg or a unit of a certain tractor, we do have various estimates of energy used per dollar of product in various machinery production facilities, often gathered, when it is possible, from national aggregate statistics. Then that has to be prorated over the useful life of the tractor. We include some of these estimates and their ranges in Table 1 also.

Table 1. Energy Costs Per Physical Unit or Per Dollar of Input to Agriculture or Biorefining


Table 1. Energy Costs Per Physical Unit or Per Dollar of Input to Agriculture or Biorefining

Philosophical and Boundary Issues

A second issue relating to different energy costs among different authors pertains to boundaries and philosophies of inclusion/exclusion. It is nearly universally accepted that one should include direct (on site) energy use and basic indirect (e.g., energy used to make equipment used on site) energy inputs. However, the agreement tends to evaporate when considering whether or not to include other possible energy terms, for example; allocation to coproducts, energy for labor or finance and so on. We do not believe that there is a single acceptable boundary although one should undertake a standard assessment for fuel alone and then clearly specify procedures for each additional analysis). However, comparative studies must use the same boundaries if they are to provide useful results. This issue is addressed in the protocol paper by Murphy et al. [13] in this volume. Good arguments for including all components associated with expenditures are found in [14]. If the different published EROIs for biofuel are due principally to such philosophical issues then this would not undermine the value of EROI as a key metric for analyzing energy systems, or at least not very much. In fact the different approaches can be viewed as a means of gaining greater flexibility and hence utility for EROI by specifying the conditions of the process under consideration, especially if a standard procedure is also done [13]. In addition the different investigations highlight the importance of clearly defining the assumptions made during the EROI analysis and how allocations are handled for multiproduct energy systems.

Quality Adjustment Issues

Not all energy is of the same quality, for example liquid fuels are normally thought of as higher quality than solid fuels (hence we transform corn to alcohol). Electricity is higher quality than fossil fuels, hence we burn some three heat units of fossil fuel to generate one heat unit of electricity. Gasoline has higher energy density than alcohol and so on. We believe that these are the three main reasons that contribute to differences among different estimates of the EROI of the same fuel. The main objective of this paper is to take two very different estimates of EROI and dissect the reasons for the differences.

Methods

Our methods are very simple. We examine the importance of each of the above three factors quantitatively in Kim and Dale [11] and Pimentel and Patzek [12] by comparing each energy-related component in tabular form. Our main activity was to list energy consuming operations and to convert units, for example from Pimentel and Patzek’s kilocalories to megajoules (MJ, multiply kilocalories by 4.186/1000). In all cases energy operations were given in, or converted to, estimates of MJ/L of alcohol generated.

The second main procedure was to examine the importance of the allocation (or not) of energy costs to co-products. The energy costs of producing corn ethanol can be partially offset by allocating the energy used to various products and by-products, such as the dry distillers grains (DDG) made from dry-milling of corn. From about 10 kg of corn feedstock, about 3.3 kg of DDG with 27% protein content can be harvested [15]. This DDG is suitable for feeding cattle that are ruminants, but has only limited value for feeding hogs and chickens. In practice, this DDG is generally used as a substitute for soybean meal that contains 49% protein [15]. This allocation issue is somewhat complex. Soybean production for livestock feed requires less energy per kg than does corn production, because little nitrogen fertilizer is needed for the production of the soybean. However considerable energy is required to remove oil from soybeans and thereby produce the soybean meal that is actually fed to animals. In practice 2.1 kg of soybean protein provides the equivalent nutrient value of 3.3 kg of DDG.

In the system expansion approach used in Kim and Dale [11], the system boundaries were expanded to include corn dry milling, corn wet milling, and soybean crushing systems. Simultaneous linear equations representing the displacement scenarios for co-products of each system were solved as recommended by the International Standards Organization [16]. The underlying assumption is that coproducts that deliver an equivalent function (DDG as an animal feed, in this case) from different product systems displace each other. The fraction of energy allocated to co-products (26%) was then estimated through system expansion. Pimentel and Patzek [12], in contrast, assume that 7% of the overall energy inputs will be allocated to co-products. Consequently, we examined the effect of allocating zero, 7% (coauthor Pimentel’s value) or 26% of the energy used (coauthor Dale’s value) to produce ethanol to DDG (see the Results section).

Results. Since the methods and the results for the corn based ethanol EROI and the cellulosic ethanol EROI are quite different we give first the results for corn-based ethanol, then we include additional methods and new results for cellulosic ethanol.

Results for Corn-Based Ethanol.   The two procedures gave a very different EROI for corn based ethanol, 1.73:1 from Kim and Dale [11] and 0.82:1 from Pimentel and Patzek [12]. Obviously Kim and Dale estimate that a positive energy balance can be generated by turning inputs into ethanol. Pimentel and Patzek [12] conclude that investing fossil energy to make ethanol from corn is senseless because the process of generating ethanol consumes more energy than is derived from the product ethanol.

The principal reason for the large difference between the EROIs derived from these two papers was the difference in the allocation approaches used for coproducts. Kim and Dale used the “system expansion” approach to estimate that only 74% of the total energy costs should be allocated to generating the ethanol and the remainder to the co-product, the protein rich DDG. In brief, the system expansion allocation employed by Kim and Dale assigned the energy “cost” of producing soy bean meal, the major commodity with which DDG competes in the market, to DDG. About a half (approximately, depending on assumption used) of the difference between the EROI given in the Pimentel and Patzek and the Kim and Dale papers was due to co-product allocation issues (i.e., philosophical and boundary issues). About a third was due to differences in estimates of the energy intensity of the inputs (i.e., supply chain issues), and about 15% was due to the greater inclusivity of costs by Pimentel and Patzek. These results are considered in greater detail next.

Supply Chain Issues: Energy per Unit Inputs.  Table 1 gives the energy intensities per unit used in their analyses by the two sets of authors. The inputs are listed side by side in Table 1 so that they can be compared easily. The per unit values used in making subsequent calculations are almost universally within 10 or at most 20% of one another (Table 1). The values used by Pimentel and Patzek tend to be often, but not always, higher than those of Kim and Dale. For example, the former give diesel fuel as 42.6 and the latter 47.5 MJ/L. Since Pimentel and Patzek include the energy required to refine the fuels, which is about 10% of the output value [17], and Kim and Dale do not, this seems to be the reason for the difference.

Exceptions to the general similarities are the energy costs per ton of potassium fertilizer, which differ by 30%, and transport energy which differ by 70%. Neither of these energy inputs is especially large, so we do not think that differing per unit energy costs are likely to contribute in any important way to the final results with the exception of items included by one study but not the other.

Energy Cost Entity Units Kim & Dale. Since there was no consistent pattern of one or the other authors using higher or lower estimates the energy input estimates tend to “come out in the wash”. The estimates of the total energy used to generate a liter of ethanol differ more because of the inclusion or not of different costs.

Pimentel and Patzek include more categories of inputs and hence estimate the total energy input to generating a liter of ethanol as 28.1 MJ, while Kim and Dale estimate 16. 7 MJ, which is 59% of Pimentel and Patzek’s value. If one assigns additional energy costs (based on Pimentel and Patzek’s numbers) for the factors used by Pimentel and Patzek but not by Kim and Dale the latter’s energy costs would be 19.5 MG/L, 69% of the former’s value.

Sensitivity Analysis.  Both Kim and Dale [11] and Pimentel and Patzek [12] allocate some energy costs to coproducts. For the Kim and Dale this is 26% (about 445 kcal or 1. 86 MJ) per liter, while for Pimentel and Patzel it is 7% (about 120 kcal or 0.5 MJ) per liter. In the case of Pimentel and Patzek factoring this credit for a non-fuel source in the production of ethanol reduces the negative energy balance from 46% to 39% (See tables). For Kim and Dale it increases the positive value by about 18%. Some scientists, such as Shapouri et al. [18], would give an even larger credit for DDG of 4, 400 kcal (18.4 MJ) / kg and thereby further increase the positive value of EROI relative to Kim and Dale. Shapouri’s values are based on surveys of operating corn ethanol plants.

Procedural/Metric Issues: Total Energy Costs. The estimated total energy costs to generate ethanol from corn derived by Kim and Dale are about 16.6 MJ/L, and about 28.1 MJ/L as derived by Pimentel and Patzek. Thus Pimentel and Patzek’s estimates are about 170% of those of Kim and Dale (2005). About 2.65 MJ/L of the 11.6 MJ/L difference between the two estimates, or 23%, is due to what might be considered boundary (or perhaps more accurately inclusionary) issues (i.e. Pimentel and Patzek include more categories, such as the energy cost of seeds), and the rest due to the frequently somewhat higher estimates of energy costs at each step by Pimentel and Patzek. For most of the items the estimates of energy costs are similar, again within 10-20%, although usually higher in Pimentel and Patzek’s work. The largest differences are for fuels used in the field for production and for fertilizer plus herbicides/pesticides. The difference of energy used for fuels is mostly Pimentel and Patzek’s inclusion of the energy cost of refining in the cost of oil. Fertilizer energy inputs are also a significant source of difference, with Kim and Dale estimating fertilizer energy inputs at about 1.4 MJ/L ethanol less than Pimentel and Patzek, or about 8% (0.93/11.6) of the difference in total energy inputs between the two sets of authors.

Allocation Issues. Pimentel agrees with Dale that it may be appropriate under some circumstances to include adjustments for co-products. For example the energy and dollar costs of producing corn ethanol can be partially offset by allocating some of the energy used to generate by-products, like the DDG made from dry-milling of corn.

Estimating EROI for Cellulosic Ethanol.  Due to the inherent problems with corn ethanol, including as both Dale and Pimentel acknowledge its low or negative EROI and hence low profitability if and as subsidies are removed, there is a growing interest in using cellulosic biomass from non-food biological material to produce ethanol. However, such cellulosic biomass materials have fewer carbohydrates and more complex matrices of lignin and hemicellulose, thus complicating the ethanol conversion processes. In terms of biomass energy produced per hectare (not liquid fuel), switchgrass and willow are more productive and, of importance here, more efficient than corn in terms of fossil energy inputs versus biomass energy output [12]. The problem is that they are also more difficult to turn into liquid fuel. This analysis focuses on the potential of cellulosic biomass to serve as a liquid fuel.

Willow for cellulose: Heller et al. 2003 (Bruce Dale) Heller’s study used strict life cycle analysis methodologies to evaluate the environmental and energetic performance of willow biomass crop production in the state of New York for electricity generation. The base case analysis was founded on field data from establishment of a 65 hectare willow plantation in western NY under current (as of 2000) silvicultural practices in that state. Overall the system produced 55 units of biomass energy output (raw wood) per unit of fossil energy input over a 23 year lifetime of the willow plantation, or an EROI of 55:1 at the farm gate. As with the Schmer et al. study described above, fertilizer nitrogen and diesel fuel for farm operations were the largest single energy inputs for willow production according to Heller et al. (37% and 46%, respectively of total direct energy inputs, see Figure 3 of their paper) for willow production. EROI for liquid fuel production was not calculated by Heller et al.

Estimates of Energy Costs of Processing Cellulosic Biomass (Bruce Dale). Cellulosic biomass consists of three major components, cellulose, hemicellulose and lignin, in a roughly 40:30:20 mass ratio, depending on the species, plus a host of other components such as ash, protein, etc. Cellulose and hemicellulose are structural carbohydrates composed of sugars that can be fermented to ethanol, at least potentially. The lignin is a complex aromatic polymer and cannot be fermented using current technology. In practice, not all the sugars in cellulose and hemicellulose are fermented. So at the end of the fermentation the residual material contains the lignin plus the residual carbohydrates that were not successfully fermented. It is often assumed that this residual material will be burned to provide all the electricity and steam required to run the processing facility.

In contrast, Pimentel and Patzek believe that at this time the technology to generate cellulosic ethanol at a commercial scale is quite unproven, and even speculative. They assume that if the cellulosic ethanol technology can be made to scale (which they think is very speculative) then all the energy needed for distillation steam will have to come from fossil fuels [25].

[ My note: it is now June 2016 and Commercial scale cellulosic ethanol is still not happening – why?  ]

Bruce Dale bases his EROI estimates for cellulosic ethanol from switchgrass on the work of Schmer et al., who, in addition to estimates of the energy used in the field to grow switchgrass, used modeling to explore the crop conversion (biorefining) portion of the system. Schmer’s calculations were based on models for the biorefinery and the overall system derived by the Energy and Resources Group Biofuel Analysis Meta-Model (EBAMM, University of California-Berkeley). EBAMM assumes that all energy used by the biorefinery will come from residual biomass (i.e., that portion not converted to ethanol). This residue is burned to produced electricity and to generate steam to run the biorefinery, i.e., to distill the alcohol from the mash. EBAMM also estimates an electricity export of 4.79 MJ/L of ethanol produced in the biorefinery. Thus Schmer estimates that the overall energy output is 21.2 MJ/L of ethanol plus (3 (a factor for the quality of electricity) × 4.79 equals 14.4) MJ of electricity for a total of 35.8 MJ/L of ethanol. To check the EBAMM model, Dale used the Schmer data to calculate the energy used for the agricultural system and the Laser et al. [26] modeling information (see Figure 1 in the Laser paper) to describe the conversion (biorefinery) part of the system. Assuming the only energy input to the biorefinery is the energy contained in the biomass, he multiplied the EROI of the agricultural system by the overall thermal energy efficiency of the biorefinery (correcting for electricity quality) and then subtracted the energy costs of biomass transport to the biorefinery to get the system EROI.

Figure 1 from the Laser et al. paper provides an estimate of 43.3% overall thermal efficiency of conversion of feedstock cellulosic biomass (39.5% ethanol and 3.8% surplus electricity) for mature cellulosic ethanol based on biochemical conversion to ethanol combined with electricity generation. (In effect, this means that 43.3 MJ of useful energy products are derived from 100 MJ of feedstock energy delivered to the biorefinery.) Transport energy was estimated from the Heller et al paper as 0.1 kJ per MJ of delivered biomass over a 96 km average transport distance. Using these data, an EROI for cellulosic ethanol from switchgrass is estimated to be 18.1:1, similar to the value of 17.8:1 calculated in Table 3.

There is obviously a substantial difference in the EROI of cellulosic biofuels between Pimentel and Patzek (0.78:1) and Dale (this work) (17.8:1). There are various reasons for this difference. Most importantly, Pimentel and Patzek use 25.5 MJ/L of energy derived from fossil or other outside fuel sources to distill the ethanol from the fermentation residue while Dale assumes that this energy can be derived from the fermentation residue itself. This accounts for 90% (25.5/27.7) of the difference in energy costs and correspondingly most of the difference in the EROIs. The second largest difference is that Dale estimates that there will be 4.79 MJ/L of surplus electricity derived from the process. This is based on the assumption that the residual biomass will be enough to not only distill the ethanol but also to generate some residual electricity. This electricity is weighted by a factor of three representing its quality. Thus Dale’s overall energy output is 21.2 MJ/L of ethanol plus 14.4 MJ of electricity for a total of 35.6 MJ/L of ethanol. These data for energy inputs and outputs for switchgrass ethanol are summarized in Table 3. Table 3. Comparing Different EROI Calculations for Switchgrass.

Discussion: Cellulosic Ethanol

Pimentel believes that since cellulosic biomass, like straw and wood, clearly have very few of the simple starches found in corn, this means that 2 to 3 times more cellulosic material must be produced and processed to obtain a similar amount of cellulosic ethanol as corn (Patzek [27]). Dale responds that corn grain has about 80% carbohydrate (starch), and it is the starch that is converted to ethanol. Switchgrass has about 70% carbohydrate (almost all cellulose and hemicellulose, but very little starch), and these are the carbohydrates that are converted to ethanol. Dale believes that it is incorrect to assert that 2 to 3 times more cellulosic material must be processed to make a similar amount of ethanol.

Current ethanol yields from corn grain are about 2.7 gallons per bushel, or approximately 470 L per MG dry grain. Depending on the species used for biomass and conversion technology, current ethanol yields from cellulosic biomass are about 240–350 L per dry MG of biomass ([28-30], with a rough upper limit at about 400 L per dry MG as the technology improves. The upper limit of the current ethanol yield range quoted above (350 L/MG) was obtained by DDCE, LLC (DuPont Danisco Cellulosic Ethanol, LLC) at their 250, 000 gallon per year cellulosic ethanol demonstration plant in Vonore, Tennessee [30].

At the yields obtained by DDCE, LLC Dale estimates that it takes about 1.3 tons of cellulosic biomass to provide the same amount of ethanol as a ton of grain, not 2 to 3 times as much, as Pimentel suggests and that eventually it may take only about 10% more cellulosic biomass to provide the same amount of ethanol. Actually, since the residual (unfermented) biomass will be burned to produce electricity, for the sake of a higher EROI we may not want to push the ethanol yield any higher than it is right now.

The 3 to 1 multiplier for the quality of the electricity generated from the biomass residual above that required for distillation will push the EROI higher than it would be if more of the carbohydrate were converted to ethanol. The key seems to be getting the right balance of ethanol and electricity to meet our society’s needs for both liquid fuels and electricity at sufficiently high EROI.

Potential Scale of Cellulosic Ethanol Industry

While David Pimentel certainly hopes that the proposal to convert cellulosic biomass into liquid fuel will achieve the goal of generating a significant amount of net energy, he is not optimistic that even if this were possible it could make a sufficient difference. Green plants collect and convert less than 0.1% of the incident sunlight into plant matter [12,31,32]. In the United States all green plants collectively produce biomass equivalent to about 53 exajoules of energy per year from sunlight, only about half of our total fossil energy use. Hence even if we were able to use all agricultural, forest , grassland and aquatic plants, with no production of food or fiber, at an impossible 100% efficiency this would be barely enough energy to displace oil.

Bruce Dale responds that the biofuel industry is not trying to replace all energy used in the United States, but only a portion of our liquid fuel, most of which is currently derived from petroleum. He does agree that a high EROI by itself is not sufficient to give us a useful alternative to petroleum— scale also matters. The latest Department of Energy study indicates that around 1.3 billion metric tons of cellulosic biomass can be sustainably produced each year in the U.S.  2011 https://bioenergykdf.net/content/billiontonupdate . This much biomass is equivalent to about 20 exajoules (or 20 quadrillion BTUs, or 20 × 10 to the 15th power BTUs), roughly 20% of total U.S. energy consumption). Even if only half of the energy content of biomass can be converted to liquid fuel that would still give us a lot of energy. Relatively simple agricultural changes such as double cropping (growing a winter annual grass following corn) could increase the amount of biofuel produced still further [33] as could increasing the yield of energy crops such as switchgrass and willow. David Pimentel believes that the DOE claim that 1.3 billion tons of cellulosic biomass can be harvested sustainably cannot possibly be true based on data that he and his graduate students have gathered. This would mean harvesting 72% of total U.S. biomass production per year including all food, grass, and forests. Food crops and grass alone total 92%.

Estimates of Energy Cost of Cellulosic Feedstock Production (Schmer vs. Sampson). While David Pimentel believes that Schmer’s data on costs and gains of switchgrass production are generally

believable, he points out that there have been several criticisms of that report [21,22,31,32]. Pimentel prefers the assessment of Roger Samson who has more than 15 years of field experience with switchgrass and has a business producing pelletized switchgrass. Samson et al. [21] report that they were able to produce nearly 15 kcal of switchgrass output per 1 kcal of fossil energy input . The main problem David Pimentel has with Schmer et al.’s report is their statement that “Switchgrass produced 540% more renewable energy than nonrenewable energy consumed”. They achieve this projection by using an extraordinary high estimated yield of ethanol from switchgrass processing of 0.38 L/kg (or 380 L per ton). This is the same yield of ethanol produced from 1 kg of corn grain, a much more fermentable feedstock. Pimentel believes that no one else in the world has achieved even a small portion of the return reported by Schmer et al. from switchgrass. Bruce Dale responds that, on the contrary, the current yield of ethanol from corn grain is about 0.47 L/kg of dry corn grain and that many laboratories and commercial operations have already gotten yields approaching 0.35 L/kg of cellulosic biomass, as referenced above. Coauthor Hall wishes to remain neutral in this and other discussions but believe that his coauthors are setting up some very researchable questions for a more mature biofuels industry.

David Pimentel and his collaborator Tad Patzek give several additional arguments about the, in their view, inadvisability of large scale production of fuel from switchgrass in addition to their calculation that it was likely to have an EROI of less than one for one. Patzek in 2010 reported that even if the entire total 140 million hectares of U.S. cropland were planted to switchgrass and converted to ethanol, the gross yield would be only 20% of U.S. gasoline consumption. Also, Smith [34] reported that the cost of producing a liter of ethanol from cellulosic feedstock is ¢54/L ($3.09/gal). Bruce Dale responds that the values of switchgrass productivity and ethanol yield assumed by Patzek are unjustifiably low, since we are already able to produce about 10% (by volume) of our gasoline consumption from about one third of our corn grain, which is about one sixth of the total mass of corn grain and corn residue produced on about 36 million hectares of cropland. Bruce Dale agrees that the Sampson and Schmer data are not that different in terms of the farm level operations. Sampson’s data gives an EROI of about 23:1 for solid biomass delivered to the farm gate while the corresponding farm gate EROI for Schmer is about 38:1. (Interestingly, the Heller et al. data give an EROI of 55:1 at the farm gate, but that is for wood from trees.) These differences can be reasonably attributed to the different yields and agronomic practices employed in the Sampson study (eastern Canada) versus the Schmer study (midwestern US). As with Schmer, Sampson shows that the energy inputs from the fertilizer and the harvesting operations represent the greatest farm level energy inputs, 58% and 29%, respectively, of the overall energy required to grow, harvest and transport switchgrass to the fuel production facility.

Where Dale and Pimentel disagree strongly is on the ethanol yield from switchgrass. Dale notes that, in fact, DDCE and other firms have already achieved ethanol yields similar to or greater than those used by Schmer. Dale notes that over 100 years ago the Germans developed a wood to ethanol process based on sulfuric acid that achieved about 0.21 L/kg. During World War II, the US used this process to produce cellulosic ethanol for conversion to butadiene to produce synthetic rubber. The Vulcan Copper and Supply Company was contracted to construct and operate a plant to convert sawdust into ethanol. This plant achieved an ethanol yield of about 0.21 L/kg over several years but was not profitable in an era of cheap oil and was closed after the war [35]. Bruce Dale notes that there are a number of smaller (e.g., Mascoma, Gevo, KL Energy, Coskata) and larger (e.g., Shell, BP, DuPont, Chevron, ConocoPhillips) firms that are actively developing cellulosic ethanol and other biofuels from different materials including corn stover, wheat straw, mixed hardwood chips, sugar cane bagasse, etc. [36]. Although process data are generally confidential, these firms are working to increase these yields and seem to be making real progress. Some of them are already operating large demonstration plants. For example, DDCE, a cellulosic ethanol firm owned by DuPont, publicly states that they are achieving 85 gallons per ton (350 L per dry MG or 0.35 L/kg) at their demonstration plant in Vonore, Tennessee [30].

Large Differences in Distillation Energy. Finally, there is a clear difference in opinion on whether or not we will be able to use residuals for fuel for distillation, and this is the main reason that the EROI estimates are so different. Of course because the technology is barely operational at a commercial scale we cannot check which assumption is correct. Coauthor Dale believes that many different estimates by the National Renewable Energy Laboratory (NREL) and others have shown that more than enough energy is contained in the biomass to run the biorefinery and even have enough left over to export surplus electricity [26,37,38]. The NREL calculations in particular have been extensively vetted by industry and the latest NREL report is coauthored by six practicing engineers from the Harris Group, a large, diversified engineering services and design firm [39]. Also, if the residuals are not burned to provide process heat and electricity, they will have to be disposed of in some way, probably by landfilling. It does not seem reasonable to suppose that industry will not use the ready source of fuel available but will instead opt to pay for its disposal. Furthermore, the Kraft pulp and paper industry is powered largely by its biomass residuals and newer sugar cane to sugar-ethanol-electricity system is completely powered by its residue, sugar cane bagasse, while exporting surplus electricity [40]. Both of these are highly developed, well-established industries. So we have the example of two very large scale industries that show that it is indeed possible to use biomass residuals to provide most or all of the energy needed for biofuel production, presumably including cellulosic biomass.

Pimentel, on the other hand, believes that only some of the residual can be burned. Much of the lignin cannot be extracted and burned. According to the website Lignoworks [41] “Most schemes propose to use the separated lignin as a fuel to run the plant. However, a process that converts all of the input biomass to fuel is unlikely to be economically feasible”. Further support for the statement that only a small portion of the lignin can supply energy comes from specialists in paper production in Alabama [42]. They stated that separating the lignin from the water was too costly in terms of both energy and dollars. What they do is spray the water-lignin mixture into the boilers. They claim only a little net energy from this. The same would be true for cellulosic ethanol production.

Coauthor David Pimentel further states that “There is no evidence that the suggested potential improvements in cellulosic ethanol are possible. Examine the multi-billion dollars that have been spent for the past 5 years with no result.” [43,44]). He also believes that the GREET model is very optimistic, and generates high yield estimates that have not been verified in the field.

Conclusions and Summary

An important objective of this paper has been realized. The coauthors agree that the EROI concept is valuable and can provide important insights about the desirability of particular energy systems. The reasons for the published differences between coauthors Dale and Pimentel with regard to corn ethanol’s EROI have been dissected and are shown to be primarily due to allocation issues, not to inherent problems with the underlying concept of EROI.

These results highlight the importance of performing EROI using transparent methodologies and allocation approaches, clearly defined system boundaries, and using the best data possible.

Lack of crucial data for operating cellulosic ethanol systems makes these EROI calculations inherently more speculative than those for corn ethanol. However, farm level EROI’s are relatively high for cellulosic biomass production (ranging from 10:1 to about 50:1 in this analysis). Therefore it is the efficiency of energy conversion in the biorefinery, in particular the practicality of using residual biomass to power the biorefinery, which will determine whether cellulosic ethanol systems can reach the very attractive EROIs that seem possible.

Acknowledgments

The first author greatly appreciates the good will of the second and third author to attempt to deal with their differences in an open and friendly manner through a joint publication. It was not easy for anyone.

References and Notes

  1. US Energy Information Agency. International Energy Outlook. www.eia.doe.gov/oiaf/ieo/ index.html
  2. Oh, W.; Lee, K. Causal relationship between energy consumption and GDP revisited: The case of Korea 1970- 1999. Energy Econ. 2004, 26, 51-59.
  3. Skov, A.M. National health, wealth and energy use. J. Pet. Technol. 1999, 51, 48-60.
  4. Hall, C.A.S.; Klitgaard, K.A. Energy and the Wealth of Nations: Understanding the Biophysical Economy; Springer: New York, NY, USA, 2011.
  5. US Energy Information Agency. Short Term Energy Outlook; US Energy Information Agency: Washington, DC, USA, 2011.
  6. Lal, R.; Pimentel, D. Soil erosion: A carbon sink or source? Science 2008, 318, 1040-1042.
  7. Farrell, A.E.; Plevin, R.J.; Turner, B.T.; Jones, A.D.; O’Hare, M.; Kammen, D.M. Ethanol can contribute to energy and environmental goals. Science 2006, 311, 506-508.
  8. Patzek, T. Thermodynamics of the corn-ethanol biofuel cycle. Crit. Rev. Plant Sci. 2004, 23, 519-567.
  9. The conclusions of some of these papers on corn ethanol’s EROI have been subject to debate (e.g., see responses to that article in Science 2006, 312:1746). Kammen, an important contributor to the basically positive view given in Farrell et al., seems to have become less positive as seen in an article in Time magazine (7 June 2007).
  10. Hammerschlag, R. Ethanol’s energy return on investment: A survey of the literature 1990– present. Environ. Sci. Technol. 2006, 40, 1744-1750.
  11. Kim, S.; Dale, B.E. Life cycle assessment of various cropping systems utilized for producing biofuels: Bioethanol and biodiesel. Biomass Bioenergy 2005, 29, 426-439.
  12. Pimentel, D.; Patzek, T. Ethanol production using corn, switchgrass and wood; biodiesel production using soybean. In Biofuels, Solar and Wind as Renewable Energy Systems: Benefits and Risks; Pimentel, D., Ed.; Springer Science+Business Media B.V.: Dordrecht, the Netherlands, 2008; pp. 357-394.
  13. Murphy, D.J.; Hall, C.A.S.; Dale, M.; Cleveland, C. Order from chaos: A preliminary protocol for determining the EROI of fuels. Sustainability 2011, 3, 1888-1190.
  14. Henshaw, P.; King, C.; Zarnikau, J. System Energy Assessment (SEA), defining a standard measure of EROI for energy businesses as whole systems. Sustainability 2011, 3, 1908-1943.
  15. Stanton, T.L. Feed composition for cattle and sheep. Colorado State University. Cooperative Extension. 1999, Report No. 1.615. 7 pages.
  16. International Organization for Standardization (ISO). International Organization for Standardization 14041: Environmental Management – Life Cycle Assessment – Goal and Scope Definition and Inventory Analysis; ISO: Geneva, Switzerland, 1998.
  17. Szklo, A.; Schaeffer, R. Fuel specification, energy consumption and CO2 emission in oil refineries. Energy 2007, 32, 1075-1092.
  18. Shapouri, H.; Duffield, J.A.; Wang, M. The energy balance of corn ethanol: An update. Agricultural Economic Report 813, US Department of Agriculture: Washington, DC, USA. 2002.
  1. Patzek, T.W. Thermodynamics of the corn-energy biofuel cycle. Crit. Rev. Plant Sci. 2004, 23, 519-567.
  2. Hermans, J.; Reinemann, D. Integrating bio-fuel production with Wisconsin dairy feed requirements. ASABE J. 2006, Paper number 066036.
  3. Samson, R.; Duxbury, P.; Drisdale, M.; Lapointe, C. Assessment of pelletized Biofuels. PERD Program, Natural Resources Canada, 2000, Contract 23348-8- 3145/001SQ.
  4. Samson, R.; Duxbury, P.; Mulkins, L. Research and development of fibre crops in cool season regions of Canada. Resource Efficient Agricultural Production- Canada. Box 125, Sainte Anne de Bellevue, Quebec H9X 3V9, Canada, 2004.
  5. Schmer, M. R.; Vogel, K.P.; Mitchell, R.B.; Perrin, R.K. Net energy of cellulosic ethanol from switchgrass. Proc. Natl. Acad. Sci. U. S. A. 2008, 105, 464-469.
  6. Heller, M.C.; Keolian, G.A.; Volk, T.A. Life cycle assessment of a willow bioenergy cropping system. Biomass Bioenergy 2003, 25, 147-165.
  7. Arkenol. Our technology. Concentrated acid hydrolysis. http//:www.arkenol.com/ Arkenolpercent20Increch01.html
  8. Laser, M.; Larson, E.; Dale, B.; Wang, M.; Greene, N.; Lynd, L.R. Comparative analysis of efficiency, environmental impact, and process economics for mature biomass refining scenarios. Biofuels Bioprod. Biorefin. 2009, 3, 247-270.
  9. Patzek, T.W. A probabilistic analysis of the switchgrass ethanol cycle. Sustainability 2010, 2, 3158-3194.
  1. Lau, M.W.; Dale, B. Cellulosic ethanol production from AFEX-treated corn stover using Saccharomyces cerevisiae 424A(LNH-ST). Proc. Natl. Acad. Sci. U. S. A. 2009, 6, 1368-1373.
  2. Kazi, F.K.; Fortman, J.A.; Anex, R.P.; Hsu, D.D.; Aden, A.; Dutta, A.; Kothandaraman, G. Techno-economic comparison of process technologies for biochemical ethanol production from corn stover. Fuel 2010, 89, 520-528.
  3. Provine, W. DDCE, Inc. Personal communication, 2011.
  4. Pimentel, D.; Patzek, T. Editorial: Green plants, fossil fuels, and now biofuels. Bioscience 2006, 56, 875.
  5. Pimentel, D.; Trager, J.; Palmer, S.; Zhang, J.; Greenfield, B.; Nash, E.; Hartman, K.; Kirshenblatt, D.; Kroeger, A. Energy production from corn, cellulosic, and algae biomass. In Global Economic and Environmental Aspects of Biofuels; Pimentel, D., Ed.; Taylor & Francis: Boca Raton, FL, USA, 2012.
  6. Dale, B. ; Bals, B.; Kim, S.; Eranki, P. Biofuels done right: Land efficient animal feeds enable large environmental and energy benefits. Environ. Sci. Technol. 2010, 44, 8385-8389.
  7. Smith, C.H. When long cycles and depletions interest. 2008.http//:www.oftwominds.com/blogmay08/cycle-depletion.html
  1. Katzen, R.; Schell, D.J. Lignocellulosic feedstock Biorefinery: History and plant development for biomass hydrolysis. In Biorefineries—Industrial processes and Products; Kamm, B., Gruber, P.R., Kamm, M., Eds.; Wiley-VCH: Weinheim, Germany, 2006; Volume 1, pp. 129-138.
  2. Sims, R.E.H.; Mabee, W.; Saddler, J.N.; Taylor, M. An overview of second generation biofuel technologies. Bioresour. Technol. 2010, 101, 1570-1580.
  3. Laser, M.; Jin, H.; Jayawardhana, K.; Dale, B.E.; Lynd, L.R. Projected mature technology scenarios for conversion of cellulosic biomass to ethanol with coproduction of thermochemical fuels, power, and/or animal feed protein. Biofuels Bioprod. Biorefin. 2009, 3, 231-246.
  4. National Renewable Energy Laboratory (NREL). Enzymatic Hydrolysis: Current and Futuristic Scenarios; NREL: Golden, CO, USA, 1999; Report NREL/TP-580-26157.
  5. Humbird, D.; Davis, R.; Tao, L.; Kinchin, C.; Hsu, D.; Aden, A.; Schoen, P.; Lukas, J.; Olthof, B.; Worley, M.; et al. Process Design and Economics for Biochemical Conversion of Lignocellulosic Biomass to Ethanol Dilute-Acid Pretreatment and Enzymatic Hydrolysis of Corn Stover, 2011. Technical Report NREL/TP-5100-47764.
  6. Leal, M.R.L.V. Tecnological evolution of sugarcane processing for ethanol and electric power generation. In Sugarcase Bioethanol: R&D for Productivity and Sustainability; Cortez, L. A.B., Ed.; Editora Edgard Blucher Ltda.: São Paulo, SP, Brazil, 2010; pp. 561-582.
  7. Lignoworks. What is Lignin? 2011. Available online: www.lignoworks.ca/content/what- lignin
  8. Eden, M.R. et al. Auburn University. Personal communication, 21 October 2006.
  9. Abelard Organization. http://www.abelard.org/briefings/biofuels.php
  10. Ratliff, E. One Molecule Could Cure Our Addiction to Oil. Wired Magazine 2009, 15. Available online: www.wired.com/science/planetearth/magazine/15-10/ff_plant?
  11. Wang, M. Greet 1.5a–Transportation fuel-cycle model. Argonne National Laboratory, IL, USA. 2000.
  12. University of Nebraska-Lincoln.http://cropwatch.unl.edu/web/cropwatch/archive?articleID= 4585476
  1. Vogel, K.P.; Brejda, J.J.; Walters, D.T.; Buxton, D.R. Switchgrass biomass production in the Midwest USA: Harvest and nitrogen management. Agron. J. 2002, 94, 413-420.
  2. Mooney, D.F.; Roberts, R.K.; English, B.C.; Tyler, D.D.; Larson, J.A. Yield and breakeven price of ‘Alamo’ switchgrass for biofuels in Tennessee. Agron. J. 2009, 101, 1234-1242. 49.
  3. Cook, D.; Shinners, K. 227 Agricultural Engineering Building, University of Wisconsin-Madison, 460 Henry Mall Madison,


Posted in Biofuels, Biomass EROI, Charles A. S. Hall | Tagged , , , | Comments Off on Why studies come up with different Energy Returned on Invest (EROI) results: can it be fixed?

Murphy & Hall 2011 Adjusting the economy to the new energy realities of the second half of the age of oil

[ Below are excerpts from this 5 page paper, slightly rearranged, go here to see all of the text, figures, and tables.   Alice Friedemann   www.energyskeptic.com  author of “When Trucks Stop Running: Energy and the Future of Transportation, 2015, Springer]

Murphy, D.J., Hall, C.A.S.  2011. Adjusting the economy to the new energy realities of the second half of the age of oil. Ecol. Model. doi:10.1016/j.ecolmodel.2011.06.022

fig 8 peak era model of the economy

Fig 8 Peak era model of the economy

Is Growth still Possible?

Due to the depletion of conventional, and hence cheap, crude oil supplies (i.e. peak oil), increasing the supply of oil in the future would require exploiting lower quality resources (i.e. expensive),and thus will most likely occur only at high prices. This situation creates a system of feedbacks where economic growth, which requires more oil, would require high oil prices that will undermine that economic growth. We conclude that the economic growth of the past 40 years is unlikely to continue unless there is some remarkable change in how we manage our economy.

Numerous theories have been posited over the past century that have attempted to explain business cycles, or to generate some means of accelerating a return to rapid growth during slow or non-growth times. Many offer a unique explanation for the causes of and solutions to recessions. They include ideas based on: Keynesian Theory, the Monetarist Model, the Rational Expectations Model, Real Business Cycle Models, Neo- Keynesian models, etc. (Knoop, 2010).

Yet, for all the differences amongst these theories, they all share one implicit assumption: that there will be a return to a growing economy, i.e. growing GDP. Historically, there has been no reason to question this assumption as GDP, incomes, and most other measures of economic growth have in fact grown steadily over the past century.

But if we are entering the era of peak oil, then for the first time in history we may be asked to grow the economy while simultaneously decreasing oil consumption, something that has yet to occur in the U.S. for 100 years.

Oil more than any other energy source is vital to today’s economies because of its ubiquitous application as nearly the only transportation fuel, as a portable and flexible carrier and as feedstocks for manufacturing and industrial production.

Historically, spikes in the price of oil have been the primary cause of most recessions. On the other hand, expansionary periods tend to be associated with the opposite oil signature: prolonged periods of relatively low oil prices that increase aggregate demand and lower marginal production costs, all leading to, or at least associated with, economic growth.

By extension, for the economy to sustain real growth over time there must be an increase in the flow of net energy (and materials) through the economy. Quite simply economic production is a work process and work requires energy. This logic is an extension of the laws of thermodynamics, which state that: (1) energy cannot be created nor destroyed, and (2) energy is degraded during any work process so that the initial inventory of energy can do less work as time passes. As Daly and Farley (2003) describe, the first law places a theoretical limit on the supply of goods and services that the economy can provide, and the second law sets a limit on the practical availability of matter and energy. In other words, the laws of thermodynamics state that to produce goods and services, energy must be used, and once this energy is used it is degraded to a point where it can no longer be reused to power the same process again. Thus to increase production over time, i.e. to grow the economy, we must either increase the energy supply or increase the efficiency with which we use our source energy. This is called the energy-based theory of economic growth, which was advanced significantly by the work of Nicolas Georgescu-Roegen (GeorgescuRoegen, 1971), amongst many others (Costanza, 1980; Cleveland et al., 1984; Ayres, 1999; Hall et al., 2001; Daly and Farley, 2003; Ayres and Ware, 2005; Hall and Day, 2009).

An energy-based theory of economic growth

This energy-based theory of economic growth is supported by data: the consumption of every major energy source has increased with GDP since the mid-1800s at nearly the rate that the economy has expanded (Fig. 1). Throughout this growth period, however, there have been numerous oscillations between periods of growth and recessions.

Fig 1 energy production and GDP for the world from 1830 to 2000


Fig. 1. Energy production and GDP for the world from 1830 to 2000.

Cleveland et al. (2000) analyzed the causal relation between energy consumption and economic growth and their results indicate that, when they adjusted the data for quality and accounted for substitution, energy consumption caused economic growth. Other subsequent analyses that adjusted for energy quality support the hypothesis that energy consumption causes economic growth, not the converse (Stern, 1993, 2000).

In sum, our analysis indicates that about 50% of the changes in economic growth over the past 40 years are explained, at least in the statistical sense, by the changes in oil consumption alone. In addition, the work by Cleveland et al. (2000) indicates that changes in oil consumption cause changes in economic growth. These two points support the idea that energy consumption, and oil consumption in particular, is of the utmost importance for economic growth. Yet changes in oil consumption are rarely used by neoclassical economists as a means of explaining economic growth. For example, Knoop (2010) describes the 1973 recession in terms of high oil prices, high unemployment and inflation, yet omits mentioning that oil consumption declined 4% during the first year and 2% during the second year. Later in the same description, Knoop (2010) claims that the emergence from this recession in 1975 was due to a decrease in both the price of oil and inflation, and an increase in money supply. To be sure, these factors contributed to the economic expansion in 1975, but what is omitted, again, is the simple fact that lower oil prices led to increased oil consumption and hence greater physical economic output. Oil is treated by economists as a commodity, but in fact it is a more fundamental factor of production than either capital or labor (Hall et al., 2001).

Thus we present the hypothesis that higher oil prices and lower oil consumption are both precursors to, and indicative of, recessions. Likewise, economic growth requires lower oil prices and simultaneously an increasing oil supply. The data support these hypotheses: the inflation-adjusted price of oil averaged across all expansionary years from 1970 to 2008 was $37 per barrel compared to $58 per barrel averaged across recessionary years, whereas oil consumption grew by 2% on average per year during expansionary years compared to decreasing by 3% per year during recessionary years (Figs. 2 and 4). Although this analysis of recessions and expansions may seem like simple economics, i.e. high prices lead to low demand and low prices lead to high demand, the exact mechanism connecting energy, economic growth, and business cycles is rather more complicated. Hall et al. (2009) and Murphy and Hall (2010) report that when energy prices increase, expenditures are re-allocated from areas that had previously added to GDP, mainly discretionary consumption, towards simply paying for the more expensive energy. In this way, higher energy prices lead to recessions by diverting money from the economy towards energy only. The data show that recessions occur when petroleum expenditures as a percent of GDP climb above a threshold of roughly 5.5% (Fig 5).

  1. [Every] time the U.S. economy emerged from a recession over the past 40 years, there was always an increase in the use of oil while a low oil price was maintained.
  2. Oil is a finite resource.

In light of these two realities, the following two questions become particularly germane: What are the implications for economic growth if (1) oil supplies are unable to increase with demand, or (2) oil supplies increase, but at an increased price?

There is a clear trend in the literature on energy return on (energy) invested (EROI) of global oil production towards lower EROIs. Gagnon et al. (2009) report that the EROI  for global oil extraction declined from about 36:1 in the 1990s to18:1 in 2006. This  downward trend results from at least two factors: first, increasingly supplies of oil are  originating from sources that are inherently more energy-intensive to produce simply  because firms have developed cheaper resources before expensive ones. For example, in  the early 1990s fewer than 10% of oil discoveries were located in deep water areas. By  2005 the number jumped to greater than 50%.

Enhanced oil recovery techniques are being implemented increasingly in the world’s largest conventional oil fields. For example, nitrogen injection was initiated in the once supergiant Cantarell field in Mexico in 2000, which boosted production for four years, but since 2004 production from the field has declined precipitously. Although enhanced oil recovery techniques increase production in the short term, they also increase significantly the energy inputs to production, offsetting much of the energy gain for society.

Roughly 60% of the oil discoveries in 2005 were in deep water locations (Fig. 6). Based on estimates from Cambridge Energy Research Associates (CERA, 2008), the cost of developing that oil is between $60 and $85 per barrel, depending on the specific deep water province. Oil prices therefore, at a minimum, must exceed roughly $60 per barrel to support the development of even the best deep water resources. But the average price of oil during recessionary periods has been $57/bbl, so it seems that increasing oil production in the future will require oil prices that are associated with recessionary periods.

All of this data indicates that an expensive oil future is necessary if we are to expand our total use of oil. In other words, growing the economy will require oil prices that will discourage that very growth.  Indeed, it may be difficult to produce the remaining oil resources at prices the economy can afford, and, as a consequence, the economic growth witnessed by the U.S. and globe over the past 40 years may be a thing of the past.

EROI and the price of fuels

EROI is a ratio comparing the energy produced by an extraction process to that used to produce that energy (Murphy and Hall, 2010). As such it can be used as a proxy to estimate generally whether the cost of production of a particular resource will be high or low, and it also is probably a good determinant of the monetary costs of various energy resources. For example, the oil sands have an EROI of roughly 3:1, whereas the production of conventional U.S. crude oil has an average EROI of about 12:1 and Saudi crude probably much higher

The production costs for oil sands are roughly $85 per barrel compared to roughly $40 for average global oil and perhaps $20 (or less) per barrel for Saudi Arabian conventional crude (CERA, 2008). As we can see from this data there is an inverse relation between EROI and price, indicating that low EROI resources are generally more expensive to develop whereas high EROI resources are on average relatively inexpensive to develop (Fig. 7). As oil production continues, we can expect to move further towards the upper right of Fig. 7. In summary, relatively low EROI appears to translate directly into higher oil prices.

It is important to emphasize that these models assume that society will continue to pursue business-as-usual economic growth, i.e. the models assume that business persons will continue to assume that oil demand will continue to increase indefinitely in the future (whether or not they understand the role of the oil).

For the economy of the U.S. and any other growth-based economy, the prospects for future, oil-based economic growth are bleak. Taken together, it seems clear that the economic growth of the past 40 years will not continue for the next 40 years.

Summary

The main conclusions to draw from this discussion are:

  • Over the past 40 years, economic growth has required increasing oil consumption.
  • The supply of high EROI oil cannot increase much beyond current levels for a prolonged period of time.
  • The average global EROI of oil production will almost certainly continue to decline as we search for new sources of oil in the only places we have left: deep water, arctic and other hostile environments.
  • Increasing oil supply in the future will require a higher oil price because mostly only low EROI, high cost resources remain to be discovered or exploited, but these higher costs are likely to cause economic contraction.
  • Using oil-based economic growth as a solution to recessions is untenable in the long-term, as both the gross and net supplies of oil has or will begin, at some point, an irreversible decline.

Due to the depletion of high EROI oil the economic model for the peak era, i.e. roughly 1970-2020, is much different from the  pre-peak model, and can be described by the following feedbacks ( Fig. 8): (1) economic growth increases oil demand, (2) higher oil demand increases oil production from lower EROI resources, (3) increasing extraction costs leads to higher oil prices, (4) higher oil prices stall economic growth or cause economic contractions, (5) economic contraction leads to lower oil demand, and (6) lower oil demand leads to lower oil prices which spur another short bout of economic growth until this cycle repeats itself.

This system of insidious feedbacks is aptly described as a growth paradox: maintaining business as usual economic growth will require the production of new sources of oil, yet the only sources of oil remaining require high oil prices, thus hampering economic growth. This growth paradox leads to a highly volatile economy that oscillates frequently between expansion and contraction periods, and as a result, there may be numerous peaks in oil production. Campbell (2009) has referred to this as an undulating plateau. In terms of business cycles, the main difference between the pre and peak era models is that business cycles appear as oscillations around an increasing trend in the pre-peak model while during the peak-era model they appear as oscillations around a flat trend. It is important to emphasize that these models assume that society will continue to pursue business-as-usual economic growth, i.e. the models assume that businesspersons will continue to assume that oil demand will continue to increase indefinitely in the future (whether or not they understand the role of the oil).

But what if economic growth was no longer the goal? What if society began to emphasize energy conservation over energy consumption? Unlike oil supply, oil demand is not governed by depletion, and incentivizing populations to make incremental changes that decrease oil consumption can completely alter the relation between oil and the economy that was described in the aforementioned model. Decreasing oil consumption in the U.S. by even 10% would release millions of barrels of oil onto the global oil markets each day.

For the economy of the U.S. and any other growth-based economy, the prospects for future, oil-based economic growth are bleak. Taken together, it seems clear that the economic growth of the past 40 years will not continue for the next 40 years unless there is some remarkable change in how we manage our economy.

References

  • Ayres, R., Ware, B., 2005. Accounting for growth: the role of physical work. Structural Change and Economic Dynamics 16, 181–209.
  • Ayres, R.U., 1999. The second law, the fourth law, recycling and limits to growth. Ecological Economics 29, 473–483.
  • Campbell, C., 2009. Why dawn may be breaking for the second half of the age of oil. First Break 27, 53–62.
  • CERA, 2008. Ratcheting Down: Oil and the Global Credit Crisis. Cambridge Energy Research Associates.
  • Cleveland, C.J., Costanza, R., Hall, C.A.S., Kauffmann, R., 1984. Energy and the U.S. economy: a biophysical perspective. Science 225, 890–897.
  • Cleveland, C.J., Kaufmann, R.K., Stern, D.I., 2000. Aggregation and the role of energy in the economy. Ecological Economics 32, 301–317.
  • Costanza, R., 1980. Embodied energy and economic valuation. Science 210, 1219–1224.
  • Daly, H.E., Farley, J., 2003. Ecological Economics: Principles and Applications. Island Press.
  • Faber, M., Manstetten, R., Proops, J., 1996. Ecological Economics: Concepts and Methods. Edward Elgar, Cheltenham. Federal, R., 2009. St. Louis Federal Reserve.
  • Gagnon, N., Hall, C.A.S., Brinker, L., 2009. A preliminary investigation of the energy return on energy invested for global oil and gas extraction. Energies 2, 490–503.
  • Georgescu-Roegen, N., 1971. The Entropy Law and the Economic Process. Harvard University Press, Cambridge.
  • Hall, C.A., Balogh, S., Murphy, D.J., 2009. What is the minimum EROI that a sustainable society must have? Energies 2, 1–25.
  • Hall, C.A.S., Day, J.W., 2009. Revisiting the limits to growth after peak oil. American Scientist 97, 230–237.
  • Hall, C.A.S., Lindenberger, D., Kummel, R., Kroeger, T., Eichhorn, W., 2001. The need to reintegrate the natural sciences with economics. Bioscience 51, 663–673.
  • Hayward, T., 2010. BP Statistical Review of World Energy. Report, British Petroleum. Jackson, P.M., 2009. The Future of Global Oil Supply. Energy Research Associates, Cambridge.
  • Knoop, T.A., 2010. Recessions and Depressions: Understanding Business Cycles. Praeger, Santa Barbara.
  • Murphy, D.J., Hall, C.A.S., 2010. Year in review – EROI or energy return on (energy) invested. New York Annals of Science 1185, 102–118.
  • NBER, 2010. US Business Cycle Expansions and Contractions. National Bureau of Economic Research.
  • Smil, V., 2010. Energy Transitions: History, Requirements, Prospects. Praeger, Santa Barbara, CA.
  • Stern, D.I., 1993. Energy use and economic growth in the USA, a multivariate approach. Energy Economics 15, 137–150. S
  • Stern, D.I., 2000. A multivariate cointegration analysis of the role of energy in the US macroeconomy. Energy Economics 22, 267–283.
Posted in Charles A. S. Hall, EROEI Energy Returned on Energy Invested, How Much Left | Tagged , , | 2 Comments

U.S. House hearing on how to get Central Asian oil before Russia and China do, 2006

[ Make no mistake: one of the main focuses of the U.S. government is to keep crude oil flowing, because without oil, civilization as we know it collapses. This is because the transportation that matters most – heavy-duty diesel-engine trucks (tractors, harvesters, 18-wheelers, cranes, construction, logging, etc), rail, and ships, don’t run on electricity.  They run on oil. This hearing focuses on Central Asia.  As Zeno Baran, director at the Center for Eurasian Policy at the Hudson Institute notes:  “On the United States energy interests in Central Asia, I think we see Central Asia energy infrastructure and resources once again becoming a source of competition for great powers”.  

October 12, 2017: I put my notes from the following hearing below the 2006 hearing. It is full of energy independence talk. Yeah, right.

House 113–169. June 11, 2014. Assessing energy priorities in the Middle East and North Africa. House of Representatives. 41 pages.

Alice Friedemann   www.energyskeptic.com  author of “When Trucks Stop Running: Energy and the Future of Transportation”, 2015, Springer and “Crunch! Whole Grain Artisan Chips and Crackers”. Podcasts: Practical Prepping, KunstlerCast 253, KunstlerCast278, Peak Prosperity , XX2 report ]

House 109-219. July 25, 2006. Assessing energy and security issues in Central Asia. House of Representatives.   86 pages.

Ms. ROS-LEHTINEN. The developments in Central Asia are of a tremendous significance to United States energy and security interests in the region. Since gaining their independence from the Soviet Union in 1991, United States focus on Central Asia has increased dramatically, as indicated by American efforts to protect the sovereignty, freedom and democracy of these newly independent states.

Unfortunately, the region’s ability to profit from their energy resources in the past has been limited by Russia’s monopoly over transporting Central Asia’s oil and gas. By continuing to support diversification of pipelines, we will ensure a free flow of energy supplies to Western consumers and expand Central Asia’s economy through investment and development. We will ask our witnesses today to describe the range of U.S. energy concerns and energy interests in the region, in themselves, and their relationship to broader U.S. strategic objectives and needs.

Russia and China have intensified their efforts to isolate the United States politically, militarily and economically from Central Asia. Moscow and Beijing were successful in convincing the Uzbek leadership that the United States sought to overthrow their government. This resulted in the closing of an American military base in Uzbekistan last year. Though unsuccessful, similar efforts were made by Russia and China to pressure Kyrgyzstan to close a strategic United States air base in its country that is currently being used in the counter-terrorism efforts in Afghanistan.

If we allow ourselves to be marginalized by Moscow and Beijing, we could lose our influence in the region and could fail in achieving our immediate security goals and protecting our energy interests in Central Asia.

Gary Ackerman of New York.  As energy demand continues to increase globally, the strategic importance of Central Asia will become clearer than it is today. In truth, the development of the former Soviet republics into more important energy exporters is probably the only region that has received much attention, inadequate as it may be.

To understand why Central Asia hasn’t been on the radar screen in Washington political circles, I think we should recall the glib promises that were made about the abundance of Iraqi oil that were promised in a post-Saddam utopia. There is no way to deny that our misadventure in Iraq has distracted our Government from a host of issues that have not gone away, while our attention has been fixed on the bloody train wreck that amounts to Bush Administration policy in Iraq.

While Washington has been distracted, Iran and China have made greater inroads in Central Asia, seeking commercial and security agreements that ensure the flow of petroleum and natural gas to be used or refined and resold. Russia, too, has been active in trying to establish by commerce the dominance it used to enjoy by force. Russia’s appetite for control of petroleum resources in the region is barely concealed. The reality is that most Central Asia petroleum—after transit through Russia—is on its way to the West, and in light of the winter cutoff of Ukraine, this fact should give us some pause for thought. Moreover, the regimes that have emerged since the end of the Soviet Union are, broadly speaking, friendly kleptocracies. Every one of them has adopted a government model built around what is politely referred to as a ‘‘strongman,’’ a position commonly known as a dictator.

Mr. CARNAHAN.  Issues related to energy and security have become increasingly intertwined in recent years. Though we need to decrease our dependence on foreign oil, we must also make certain that investments in U.S. energy resources are protected throughout the world. Moreover, we need a firm hand to ensure that Iran does not further infiltrate Central Asia, which would have a direct impact on United States and international security.

STEVEN R. MANN, Principal deputy assistant secretary, BUREAU OF SOUTH & CENTRAL ASIAN AFFAIRS, U.S. DEPARTMENT OF STATE. This discussion of engaging Central Asian countries on energy cooperation is very timely as the world confronts tight oil markets and as we consider ways to deepen energy security nationally and globally. This hearing’s focus on Central Asia is particularly appropriate given the inauguration of the Baku-Tbilisi-Ceyhan pipeline on July 13.

U.S. policy for the development of oil and gas reserves in Central Asia is predicated on the use of best commercial standards and transparency to ensure that energy resources are developed efficiently and for the benefit of the countries concerned. In line with this, we have pursued a policy of encouraging multiple pipelines to afford the countries of the region options for export of their oil and gas. The completion of the Caspian Pipeline Consortium (CPC) pipeline from Kazakhstan to Novorossiisk on the Black Sea in Russia and the inauguration of the Baku-TbilisiCeyhan (BTC) pipeline from Azerbaijan to Turkey are signal successes of this policy. We all can be especially proud of the role that American firms have played in these endeavors. BTC in particular represents a new environmental, social, and design benchmark for energy transport worldwide. The construction of the South Caucasus Pipeline will bring Azerbaijani natural gas to European markets and, ultimately, Turkmen and Kazakhstani gas may cross the Caspian and share this route.

In line with these promising developments, the United States welcomes the June 16 signing by Azerbaijan and Kazakhstan of an agreement to facilitate access of Kazakhstani oil to the BTC pipeline. Such an agreement provides Kazakhstan additional capacity to export the large volumes of crude that will need to reach markets starting in 2009–10, when the Kashagan field is slated to come on stream.

U.S. firms are among the biggest investors in Central Asia’s energy sector, and this is a welcome development in many ways. Major U.S. oil and gas firms such as Chevron, ConocoPhillips, and ExxonMobil have extensive investments in the Tengiz, Karachaganak, and Kashagan fields. In addition, U.S. oil services companies and equipment providers such as Parker Drilling, McDermott, and Baker Hughes Services International have found promising opportunities. When speaking of oil and gas development, we must keep in mind that regionally Kazakhstan and Turkmenistan hold the largest reserves. Kyrgyzstan and Tajikistan have significant hydroelectric resources, but little oil and gas. Uzbekistan is largely closed to Western companies and has more limited potential.

The extent of Turkmenistan’s gas reserves remains unclear, and Turkmenistan is completely dependent on the Russian pipeline system to bring its gas to market. A proposed trans-Caspian pipeline foundered in 2000 when the parties could not reach an acceptable commercial agreement, and little has changed since then.

With the completion of the first phase of the East-West Energy Corridor, we must now press on with the second phase of supporting new energy routes out of Central Asia.

Countries bordering the Caspian Sea—Azerbaijan, Iran, Kazakhstan, Russia, and Turkmenistan—are significant oil and gas suppliers to world markets, and their importance is growing. The countries of the north Caspian have reached delimitation agreements, but Iran and Turkmenistan have not yet joined these agreements, among other reasons, because of Iranian insistence on its claim to one-fifth of the Sea. Lack of agreement has impeded exploration and development of hydrocarbon resources in disputed waters, and there remains the potential for conflict in the southern Caspian where promising offshore deposits of oil and gas remain to be developed.

Kazakhstan—Energy.   Given the scope of the energy supply and demand challenges we face today and in years ahead, Kazakhstan can play a very helpful role in addressing the world’s energy needs. Kazakhstan and the entire North Caspian region have tremendous resources. At Tengiz, Kashagan, and other fields, nearly 30 billion barrels of reserves are proven; there is potential for up to 100 billion barrels. Natural gas reserves generally range from 65–70 trillion cubic feet, and could be as high as 100 trillion cubic feet. We strongly support the work of U.S. energy companies and their international partners, who are now focused on ramping up production and improving transportation to markets. U.S. energy companies were among the first non-CIS foreign investors in Kazakhstan; we expect American companies to be active in the region for many years to come.

Overall, Kazakhstan produced about 1.29 million barrels of oil per day (b/d) in 2005, and exported, through CPC and other routes, about one million b/d. The Kazakhstani Government expects production to increase to about 3 million b/d by 2015, especially as the huge Kashagan field comes into production. Moreover, Kazakhstan has expanded production of natural gas in recent years, and expects to reach 570 billion cubic feet this year. A lack of export infrastructure—plus a focus on oil—has limited gas production in Kazakhstan; previously, gas had been flared or re-injected into oil wells to maintain production pressure.

The United States and Kazakhstan enjoy a vigorous strategic partnership with a constant stream of high-level visitors. Energy Secretary Bodman met with President Nazarbayev and Energy Minister Izmukhambetov in March,Vice President Cheney met with President Nazarbayev in May, Secretary Rice saw Foreign Minister Tokayev on July 6.  We have made progress on enabling countries in Central Asia to bring their energy resources to world markets. Much remains to be done, however, and continued robust U.S. engagement is required to push forward the next phase of energy development

LANA EKIMOFF, DIRECTOR, Office of Russian & Eurasian Affairs, U.S. Department of Energy.

I will focus on the opportunity that Central Asia presents for enhancing energy security by adding supply and diversity to world markets.  Data on oil and gas reserves for the Central Asia-Caspian region vary widely. The EIA indicates proven oil reserves are between 17 and 50 billion barrels [my note: the world burns 30 billion barrels a year]. The regions natural gas production is expected to nearly double from 14 bcf per day in 2005 to 24 bcf in 2010.

The countries in this region run the gamut on energy wealth. Azerbaijan, Kyrgyzstan, Turkmenistan and Uzbekistan are endowed with oil and gas resources. Tajikistan and Kyrgyzstan are resource-poor except for hydropower. These countries provide 2 million barrels of oil per day to the global market and are expected to add 4 million barrels by 2010. Their gas production is expected to increase by 60 percent in 2010. However, the full resource potential of this region is still unknown, and reserve figures vary widely. Better data will become available as more exploration takes place.

Developing resources in this region is not without obstacles. There is a lack of export outlets, and we have supported the development of new transit projects.

Our goal is to promote regional partnerships among producing and transit countries. It is important that the countries take responsibility for encouraging the development of new, commercially viable export routes and find ways together, and with commercial entities, to create a win-win situation. We also consistently support the creation of sound legal, fiscal and regulatory policies that will encourage investment in the energy sector.

The Department of Energy maintains ongoing dialogues with officials from Kazakhstan and Azerbaijan. Energy Secretary Bodman recently visited Kazakhstan, where he met with President Nazerbayev and the energy minister. He and Deputy Secretary Sell recently met separately with Azerbaijani President Aliyev in Washington and Istanbul. Their discussions focus on advancing our energy cooperation and recognizing the important role it plays in the global energy market.

The Department has formal dialogues with both countries. As these bilateral dialogues have matured, we have changed the focus from oil and gas issues and expanded our cooperation to a broad range of technologies—energy efficiency, renewable power, nuclear power and environmental concerns. It is important that these countries understand that we are not just interested in their oil and gas contribution to global markets, but also share a common goal of building an energy sector in these countries that is diversified, cost-effective and secure to support their growing economies.

What are our next steps? We will continue to work with countries in the region to facilitate the development of commercially viable oil and gas export infrastructure. We will encourage more surveys to better understand the resource potential in the region, which will help attract investment. We support the full involvement of Kazakhstan and the BTC pipeline, now that Azerbaijan and Kazakhstan have completed an intergovernmental agreement and they begin negotiations on host government agreements with the companies.

We also plan to hold formal energy dialogues this fall in Kazakhstan and Azerbaijan to broaden and deepen our energy cooperation.

Ms. BERKLEY. This is a part of the world that, until recently, I knew so little about and now realize how strategically important it is to our country and, I believe, security in many very sensitive parts of the world. I have also come recently to appreciate how vast their oil and gas reserves are, and how extraordinarily important that is to our economic well-being and security needs. Can you give me some idea of where we fit into this? What would their natural inclination be as a region? Would they gravitate toward Muslim countries? Would they be more interested in coming into the American orb and being stronger allies of ours? Are these issues being determined by their governments on pure economic basis? Are they factoring in other security needs, religious needs? Give me some idea of what is happening there and what is the best-case scenario for the United States and how we can go about achieving that scenario. Because, lately, we are not doing well achieving any best-case scenario anywhere in the world.

Ambassador MANN. Kazakhstan is a good friend of the United States. Overall, there is a powerful Soviet imprint. The countries were Soviet republics for 70 years. Russian, in those years, was the language of the educated, the language of the elites. There is a powerful Soviet legacy, also an infrastructure, not just in oil and gas pipelines, but the rail routes, the air routes, telecommunications, so much of it still links through Moscow and the Russian heartland. That is a fact that just exists in Central Asia. Now, what the countries have said to us in so many ways is: we have greater opportunities now. We want not merely to be a part of the USSR as we were, we want to link to the global economy. The United States, in so many ways, has done this; not to create a sphere of our own, we reject that approach. But what we believe very strongly in is working with the governments and the people to strengthen their independence, strengthen their decision-making autonomy, strengthening their sovereignty and assisting in a process of stable development. One of the other aspects of this Soviet legacy was a forced atheism on the countries that had been Muslim for so many centuries. What we have now in Central Asia, fundamentally, are secular governments. So I think that is what they are left with after those Soviet years.

Ms. ROS-LEHTINEN. What goes on in Kazakhstan stays. Let me ask you about your thoughts on continued military assistance in Kazakhstan and Azerbaijan. Do you believe that it is a priority to help these two countries strengthen their capabilities so that they can independently defend the Caspian Sea energy platforms and interest? In my last question, I wanted to ask you about Iranian influence. You had talked about how close geographically these countries are. To what extent do you believe that the embrace of the Iranian regime in Shanghai implies a degree of legitimacy for and a Russian and Chinese acceptance of Tehran’s current policy? So, Iranian influence and also the United States military assistance to Kazakhstan and Azerbaijan.

Ambassador MANN. In each of those two countries, I think we have a good program of military cooperation and training; and a good part of that is strengthened at precisely that issue you have identified, Caspian security. It is not Central Asia per se, but I will say that I know it is a concern for Azerbaijan, which, in the summer of 2001, had oil field workers chased off of the Alov deposit by an Iranian gunboat. So it is a lively concern for the Azerbaijanis.

ZENYO BARAN, Director, Center for Eurasian Policy, Hudson Institute. On the United States energy interests in Central Asia, I think we see Central Asia energy infrastructure and resources once again becoming a source of competition for great powers. In this new rush, the two most important regional players are China and Russia. Energy-hungry China is actively working to reach long-term oil and gas agreements, and has billions of dollars to spend in order to obtain them. Russia is also spending considerable sums in the region in order to ensure it can maintain its monopoly over Caspian gas transportation to Western markets.

The U.S., however, is missing in action. In the 1990s, the United States had a very successful Caspian energy policy and identified the region as an important non-OPEC source of oil. The United States policy also correctly identified the direct transportation of Central Asian gas to new markets, rather than via the Russian monopoly Gazprom network or through a potential Iranian pipeline, as the best strategy for the region’s energy transportation future. To this end, the United States has already supported several non-Russian and non-Iranian oil and gas pipelines from the Caspian Sea, one of which, as we just heard, the Baku-Tbilisi-Ceyhan oil pipeline, was just recently inaugurated. Securing the East-West flow of Caspian gas has been much more difficult and, so far, efforts have not been successful.

Russia clearly won the first round of Central Asian gas competition. While the United States backed a trans-Caspian gas pipeline to transport Turkmen gas via an undersea pipeline to Azerbaijan and, from there, via Georgia, Turkey and onwards to European markets, Russia was able to finalize a gas pipeline agreement with Turkey to send its gas via Turkey via the Blue Stream gas pipeline underneath the Black Sea.

In part, because of the authoritarian rule of Turkmen President Niyazov until recently, the United States had abandoned its Central Asian gas strategy. The standard arguments were that the U.S. should not engage in energy dialogue with Niyazov until and unless he made improvements to the democracy of the human rights situation in the country. Given that he is not likely to do so, it was deemed best to wait him out and begin energy talks with his successor, no matter how far in the future. This policy was clearly not working. In fact, while the United States waited, we see the Chinese and the Russians have moved in to fill the vacuum. More recently, the trans-Caspian gas pipeline idea was revived by the United States Administration, but this time starting with Kazakhstan.

According to the new strategy, Turkmen gas will be added only later if at all. The logic is that there is already plenty of flared gas in Kazakhstan that could be transported to Western markets. Given Kazakhstan’s pragmatic energy development policy and demonstrated interest in the East-West corridor, this option seems to be a good way forward. Yet, this too may not materialize unless the United States is seriously committed to changing the energy dynamics in Eurasia, which ultimately means confrontation with Russia’s regional energy strategy. To come up with a coherent and pragmatic strategy, it is necessary to look at the broader Eurasian energy picture, specifically at the activities and plans of Gazprom.

While many have wanted to turn a blind eye to the possibility that United States and Russia may not have a win-win option in Central Asian energy, it is clear that Russia is playing it all.

For the United States to ensure its energy and security interests in Central Asia a new framework is needed. In the short term the U.S. will not have much influence in the democratic reform process in the region. The carrots the United States and EU can offer the Central Asians will simply not be attractive enough for them to bite, while the sticks the West can use will not be painful to induce change. We need to recognize also that

There is no win-win strategy possible with Russia and Central Asia regarding energy given the Kremlin’s use of energy as a political weapon and Gazprom’s need to obtain as much of the Central Asian gas as it can to keep Russian domestic gas prices low and to provide uninterrupted gas supply to its European consumers. The United States has two options, it can either give up, which is not advisable, or it can become directly engaged at the top levels on this issue.,

Anti-American developments.   These sentiments are a by-product of two factors, first, competition for energy resources with China and Russia, competition with Russia over the construction of new pipelines, and second, the perceived American promotion of democratic revolutions throughout the region. While its partners all have shared security concerns about the so-called three evils of separatism, terrorism and radicalism, it is of course ironic that Russia and China seem to disregard the longer term impact of their anti-American stand in Central Asia. By opposing the U.S. the way they do, they are effectively bolstering the position of the Islamists.

STEVEN BLANK, PH.D., Research Professor of National Security Affairs,  U.S. ARMY War college.

Today American interests in Central Asia, a region of growing strategic importance, are under attack from three sources: Russia, China, the authoritarian misrule of the Central Asian rulers themselves in many cases, and thirdly from the resurgence of the Taliban in Afghanistan.  Victory in Afghanistan there is the only option for us. If we lose then we will be facing another terrorist upsurge like we did 5, 7 years ago which will threaten all of Central Asia.

Because the security of Central Asia has become connected to the vital security interests of the United States, our presence in Central Asia in all of its dimensions, economic, military, political and so on, is regarded by Moscow and Beijing and to a lesser degree Tehran as a threat to their vital interests and they have spared no effort to try to oust us from Central Asia.

Russia, as has been noted here, has attempted to create a gas monopoly. They failed to create an oil pipeline monopoly, but the gas monopoly is vital to Russian politics in general.

At the same time the Russians have their own military bloc, the CSTO, which I alluded to, and they are also trying to exclude us from the Caspian by creating what they call a CASFOR, a naval force under Russian domination that would exclude non-littoral states from any participation in the defense of the area, defense of world platforms, counter-proliferation and counter-smuggling operations.

We need a broader economic policy than simply ensuring energy access. While we have been successful in energy access with regard to oil in Kazakhstan, we have failed with gas.

Secretary Rice’s initiative with regard to linking up South Asian and Central Asian electricity networks is a commendable example of what needs to be done, but it needs to be thought of in terms of a comprehensive economic policy involving not just the United States Government but the EU and international financial institutions. Similarly, military assistance and training through the Partnership for Peace and getting our allies’ support in Afghanistan, and the situation in Afghanistan is quite critical at the moment, is also an essential aspect of policy because if we fail in Afghanistan we put the whole of Central Asia at risk.

In conclusion I would say that we are facing a coordinated attack on our policies in energy with regard to democratization, with regard to defense and security in Central Asia from Moscow, Beijing and to a lesser degree Tehran, as well as from the Taliban in Afghanistan and their supporters, and also facing obstacles due to the authoritarian misrule or fragility of several, if not all, of the Central Asian Governments.

This makes the obstacles to our policy quite considerable in their extent and scope, but because of the fact that Central Asia is so important strategically and in energy terms, it is essential that we find and devise policy mechanisms and frameworks which will enable us to overcome those challenges in the near and long-term future.

Since 9/11/2001 a second vital interest for the United States has appeared, namely defense of the United States and of Europe from Islamic terrorism personified by Bin Laden and expressed by the Taliban and their allies. Consequently victory in Afghanistan is an unconditional vital interest which must be achieved just as much if not more than as in Iraq. The other important interests of the United States apply first of all to what might be called an open door or equal access for U.S. firms in regard to energy exploration, refining, and marketing. To the extent that these states’ large energy holdings are restricted to Russia due to the dearth of pipelines or oil and gas, they will not be able to exercise effective economic or foreign policy independence.

Today all these interests are under attack and the U.S. policy in Central Asia is embattled and under siege. Moscow and Beijing, as well as to a lesser degree Tehran, view our political and strategic presence in Central Asia with unfeigned alarm. Despite their protestations of support for the U.S. war on terrorism, in fact they wish to exclude us from the area and fear that we mean to stay there militarily as well as in all other ways indefinitely.

Russia has also waged a stubborn campaign to prevent Central Asian states from affiliating either with the U.S. or Western militaries. It seeks to gain exclusive control of the entire Caspian Sea and be the sole or supreme military power there while states like Kazakhstan and Azerbaijan rely upon Western, and especially American assistance to help them develop forces that could protect their coastlines, exploration rigs, and territories, from terrorists, proliferation operations, and contraband of all sorts. Second, Russia has formed the Collective Security Treaty Organization (CSTO) to prevent local states from aligning with NATO or getting too involved with its Partnership for Peace (PfP) program. Another purpose of the CSTO is to create legal-political grounds for permanently stationing Russian forces and bases in Kyrgyzstan, Tajikistan, and possibly Uzbekistan ostensibly to defend these regimes against terrorism. And the CSTO, under Russian leadership is constantly seeking to augment the scope of its missions in Central Asia in order to cement a Russian dominated security equation there. So in reality these forces are there to defend Russian interests and/or keep the current authoritarian regimes in power. Despite Russia’s relative military weakness and unbroken military decline in 1991–2000, Russia now has bases in 12 of the former Soviet republics and the expansion of its capability to project power into these areas if not beyond is one of the leading drives of current Russian military policy. Similarly another key drive of Russian military policy is the effort to develop, sustain, and project the land, sea (Caspian), and air capabilities needed to prevent local governments from either receiving U.S. weapons and assistance or allowing U.S. military bases in their territories. For example this program is the driving force behind Russia’s proposals for a Caspian Sea Force (CASFOR). The practical outcome of so exclusive a force made up only of littoral states would be to confirm the littoral states as dependencies of Russia, put Iran in a subordinate position in the Caspian, and exclude foreign military or energy presence there.

Simultaneously, Moscow and Beijing have also waged an unrelenting campaign beginning in 2002 to impose limits on the duration and scope of America’s presence in Central Asian bases and more generally in the region. They succeeded in Uzbekistan thanks to our misconceived policies there and are constantly bringing enormous pressure on Kyrgyzstan to force us out of the base at Manas. Probably the combination of our deep pockets, high-level intervention by Secretaries Rice and Rumsfeld, and renewed fighting in Afghanistan has allowed us to stay at Manas on condition of paying ever higher rents for its use. Russia has also sought to forestall these states from buying Western equipment by selling them Russian weapons at subsidized prices. And in return for their debts it has sought to restore the Soviet defense industrial complex by buying equity in strategic defense firms located there. Russia and China have also engaged in training programs for Central Asian officers.

Most significantly Moscow and Beijing have utilized the Shanghai Cooperation Organization (SCO) as a platform for a collective security operation in Central Asia, sponsoring both bilateral and multilateral Russian and Chinese exercises with local regimes and with each other on an annual and expanding basis since 2003. The SCO’s utility to Moscow and Beijing does not end here. While there are significant differences between Russia and China and among the other members and observers (India, Pakistan, Iran, Mongolia) as to what the SCO’s primary purpose and function ought to be, i.e. whether its main function should be promotion of trade and economic development; or to be a provider of hard security and another energy forum that Russia would dominate; or to be a genuine basis for regional cooperation as Kazakhstan and the smaller states would prefer, it clearly has been envisioned by Beijing and Moscow as a basis for attempting to unite Central Asian governments in an anti-American regional security organization. There are also divisions among the members as to whether its membership should expand to include the new observer states of Iran, Pakistan, India, and Mongolia. Nevertheless, Beijing openly and consistently proclaims the SCO to be a model for what it is trying to do in regard to Asian security in Southeast Asia and beyond, i.e. replace the U.S.-led alliance system in Asia with one of its own creation that is attuned to its rather than to our and our allies’ stated values and interests. Therefore we should take this organization and its development seriously as a template for China’s and Russia’s, if not Iran’s broader foreign policy objectives.

Thus U.S. policies in regard to security, energy access, and democratization are all under attack in Central Asia from the local dictators, Presidents Putin, and Hu Jintao, and their governments. Adding to the difficulties are the facts that we face a resurgent Taliban, backed up with enormous drug revenues, Pakistani support, and an inconsistent international effort to rebuild Afghanistan while its government remains weak and unsure of itself. As a result, we have lost the base at Karshi Khanabad, face constant pressure in Kyrgyzstan and elsewhere, and are fighting a revived and strengthened Taliban under conditions that are in many ways less favorable than in 2001.

The State Department emphasizes democracy as its main priority.   While such statements make powerful rhetoric; in Central Asia, according to expert observers, they are empty and irrelevant. Moreover, they contribute to the undermining of our security objectives because they feed the belief that we are seeking to unseat reigning rulers, and second, since they believe that the only real opposition is Islamic terrorists, our position fuels their belief that we neither understand the region nor their interests. If democratization is our first priority here than we have given the region over to Russia and China for we have convinced local leaders that these aforementioned beliefs of theirs are correct whatever the real truth might be.

Our utter lack of a viable information policy that is tailored to this region’s mores, cultures, and special needs, has reinforced all those previous negative feelings while also leaving the Russians and Chinese to operate with total freedom in support of retrogressive rulers or corrupt dictators.

We have failed to foresee what might happen in states that are so misgoverned that violence is likely, either through economic distress, or through a succession crisis. Thus our reactions have been uncoordinated and haphazard with resulting negative consequences for U.S. policy that we can all see today. Uzbekistan and Turkmenistan are likely to be failed states when the present rulers leave the scene and in Uzbekistan we have already seen, as has the Uzbek government, that it is vulnerable to both violent incitement and to outbreaks of pubic violence.

NATO’s continuing dilatoriness about sending troops to Afghanistan and giving them sufficiently robust rules of engagement has slowed our ability to counter the Taliban resurgence, especially as we are reducing the number of troops there. Since it appears that more troops might be needed, this is again a wrong sign. Eighth, we have failed to press the international community sufficiently strongly to make good its pledges to Afghanistan, without which reconstruction there will be greatly prolonged if it even is successful.

The State Department’s office of Reconstruction and Stabilization, under Ambassador Herbst, must be directed, if it not already doing so, to begin planning for contingencies having to do with the real possibility of state failure in Central Asia, particularly Uzbekistan and Turkmenistan. If and when that occurs it will usher in violent responses to that condition of state failure. And we cannot allow this chaos to go on in uncontrolled fashion or to abdicate our real interests in the region. Adequate forecasting, and rapid response policies, not only military ones either, must be thought through and implemented so that we are ready to move here on a moment’s notice if necessary.

ARIEL COHEN, PH.D., SENIOR RESEARCH FELLOW, HERITAGE FOUNDATION.  In the last 5 years real and present danger to U.S. national security, especially Islamist terrorism and threats to energy supply, have affected United States policy in Central Asia.  What is needed in Central Asia is a policy that allows the United States to continue to diversify its energy supplies, station its military forces in close proximity to most immediate threats, Afghanistan,

The aim of this testimony is to outline Central Asia’s strategic importance, particularly in terms of energy security, and to assess how our energy issues fit into wider United States strategic interests in the region.

The hydrocarbon reserves are concentrated in the Caspian region. As such, a discussion of Central Asian hydrocarbon resources would be incomplete without including Azerbaijan, which has considerable oil and gas resources in its own right and is central to non-Russian energy transit from Central Asia to points west.

The bulk of Central Asian Caspian hydrocarbons are located in Kazakhstan, Azerbaijan, and to a lesser degree Uzbekistan with a lot of gas in Turkmenistan. Both Tajikistan and the Kyrgyz Republic have limited reserves of oil and gas, but in amounts that thus far have not warranted much attention from foreign investors.

The outlook for Western investment in Central Asia is mixed. Especially the gas sector, investment was low. The leaders of the biggest gas producing countries are not friendly to the United States and their investment climates can be characterized as abysmal.

The Central Asian national gas sector has seen very little outside investments until recently and Russia continues to benefit from the bulk of gas exports from Central Asia as it buys Central Asian gas at prices as low as one-quarter to one-third of market prices in Europe, then resells at market rates. To put things in perspective, it must be noted that Caspian Sea production levels even in their peak will be much smaller than the OPEC, Organization of Petroleum Exporting Countries, combined output. Production levels are expected to reach 4 million barrels a day in 2015 compared to 45 million barrel a day for OPEC countries in that year. Clearly Central Asia is not the largest source of oil and gas nor it’s most successful.

Despite all these difficulties, investors and governments are rushing to lay claim to hydrocarbon reserves of Central Asia.

Geopolitical location is a keen concern as Central Asia continues to evolve as a highly important strategic area, especially for Russia, United States, China, Iran and India. Political instability in other major oil and gas production locations is very much in the news, the Middle East, Venezuela, where President Hugo Chavez just visited Belarus and is signing a $1 billion arms agreement with Russia, including the sale of sophisticated Soho 30 fighter bombers and building of a Kalashnikov machine gun factory in Venezuela.

All these factors of instability are fueling the drive to claim a share of Central Asian resources.

The role of the United States focusing on numerous factors that I mentioned before is also preventing the United States from being a hegemonistic power in the region. The more we are involved, the more Russia and China and Iran are resisting our presence there.

Even if the U.S. has the capacity to limit the presence of other large powers in the region, to do so would be an error, just as it was a mistake for the United States to support an oil and steel embargo on Japan in the 1930s, triggering its southern expansion of the Pacific. The U.S. and other great powers share the goals of stability, economic development and preventive religious radicalization of terrorism.

The United States does not want to openly antagonize China, Russia or India over their involvement in Central Asia but is likely to derive benefits from regional cooperation with them in the region.

Mr. COHEN. If Iran joins SCO or, even without that, if Iran and Russia get together to create what they call a gas OPEC, that will be a step in the wrong direction because they will be controlling together massive production capacity. I do not remember off the top the top of my head after Russia, which is number one, which one is number two in terms of reserves. Either Qatar or Iran. It is Iran. So if you think about a number one and number two producers of gas getting together, it is like Russia and Saudi Arabia getting together. That says it all. In terms of Iran being part of SCO, I think also it is going to be geopolitically a step in a wrong direction, directly affecting American interests if you take Russia and China and Iran to the west, to the east, and to the south because it will be a step to creating a geopolitical bloc essentially aimed at the United States. So we need to fight that.

House 113–169. June 11, 2014. Assessing energy priorities in the Middle East and North Africa. House of Representatives. 

Ileana Ros-Lehtinen, Florida. The Middle East and North Africa region produces over 35% of the world’s oil supply and over 20% of the global natural gas production. We know that energy resources are vital for the region, and as such, they play an important role in the shaping of the geopolitical landscape that impacts our foreign policy.  We also know that the Middle East and North Africa is one of the world’s most volatile regions, prone to unrest, instability, political upheaval, and conflict. In Libya, we saw armed groups occupying many of the strategically important oil fields and export terminals for nearly a year until a partial agreement was reached in April. And in Iraq, we have only recently begun to see that country tap the potential of its proven oil reserves, which is the source of 90% of its budget. But now that Iraq’s second-largest city, Mosul, fell this week to al-Qaeda-affiliated Islamic State of Iraq and the Levant, ISIL, and the increased deterioration of the security situation in that country, there is no telling what the future has in store for its energy sector.

But that just highlights the problem. Most of these countries rely heavily on the sale of oil or gas as their main driver for their economies, and anything that upsets the delicate balance can be extremely detrimental to their economic outlook and has the potential to upend the global energy market.

The instability in Egypt over the last few years, coupled with the large energy subsidies provided to Egyptians, has seen overconsumption in Egypt and has harmed its energy outlook. Both Israel and Jordan had been reliant on gas from Egypt, but now that Israel has the potential to export large sums of gas that Jordan needs, this could be an opportunity for those nations to strengthen their ties.

Israel’s potential could also transform its relationship with Egypt and other Middle Eastern countries as they look for regional solutions to their energy needs. Yet Israel’s natural gas boon hasn’t just affected its relationship in the Middle East and North Africa region, it has also seen a promising and expanding relationship with Greece and Cyprus. The recent discoveries of large hydrocarbons in the Eastern Mediterranean has helped forge an emerging and strategic relationship between these three countries, and this relationship has the potential to completely alter the political, economic, and security situation in the region. Their cooperation has the potential to increase the global supply of energy from friendly, more stable nations, and reduce the world’s dependence on some of these rogue regimes.

And by rogue regimes, we always mean Iran.

Theodore E.  Deutch, Florida.   For decades oil was synonymous with the Middle East. Energy resources and needs have long had a significant impact on the state of play in the region. According to OPEC, its member countries control 81% of the world’s proven oil reserves, with 66% of that coming from the Middle East. But developments over the past several years have dramatically altered the world’s energy supply. For many years, critics of American foreign policy accused the United States of being beholden to certain Middle East oil producers because of our reliance on imports for our energy needs. The discovery of significant energy finds here in our own country have set us on the course toward energy independence. The International Energy Agency predicts the U.S. will be oil independent by 2035.

To help offset the reduction in Iranian oil, Saudi Arabia has increased its production, pledging to make up the difference to avoid a shock to oil prices. The Saudis sit on 25% of the world’s oil reserves and produce roughly 8 billion barrels per day. We hope to see a return to prewar levels in Libya’s output, yet continued fighting and instability has production levels at 10 percent of capacity.

In a stunning development, Israel, long dependent on imports, has found itself sitting on a tremendous amount of hydrocarbons. For years, Israel received most of its gas from the Egyptian pipeline in the Sinai. As a result of the turmoil in Egypt, the pipeline has been attacked 15 times since 2011. The finds in the Tamar and Leviathan offshore fields now stand to make Israel energy independent within 20 years. Last year, the Israeli Government voted to mark 40% of Israel’s gas lines for export. Now, it is Israel that finds itself in the position of being the supplier to its more vulnerable neighbors. Israel and Jordan recently signed a deal for Jordan to receive $500 million worth of gas over 15 years from the Tamar field, which started producing last year. Jordan has faced a serious energy crisis, compounded by the state of affairs in its biggest supplier, Egypt, and the increased strain placed on resources by the influx of over 600,000 Syrian refugees. Jordan is set to begin receiving Israeli gas in 2016. The Leviathan field, which has yet to come on line, is said to be twice as big as Tamar.

Steve Chabot, OhioPolitical unrest and unstable energy supplies in the Middle East and North Africa will have a serious impact global energy markets. This is only intensified by an enormous growing demand for energy in Asia and an uncertain supply of energy in Europe. I hope this hearing will address the changing energy sector in the Middle East and its effect on U.S. policy in the region. I am particularly interested in how the administration plans to improve Iraq’s reliability in the production of oil, especially with some of the political instability going on there. Secondly, what progress has been made in resolving the maritime disputes between Lebanon and Israel and the energy claims in the East Mediterranean. And thirdly, Iran is limited to a million barrels of production of oil a day under the Joint Plan of Action. They are producing 1.3.

Mr. CONNOLLY.   The shift going on here in the United States toward energy independence, really, we are going to rival Saudi Arabia as a producer, what impact does that have on the region? How does that change U.S. foreign policy from being dependent on Middle East oil to now being a net exporter potentially ourselves. And what are we doing to help our allies identify alternative supplies and suppliers? You look at Turkey, 65% of its crude oil comes from 3 countries, Iran, Iraq, and Saudi Arabia; 74% of its natural gas comes from Russia and Iran. How are we helping allies like Turkey look toward alternative sourcing for political stability purposes?

Amos J. Hochstein, Deputy Assistant secretary for Energy Diplomacy, Bureau of Energy Resources,  U.S. Department of State. Energy resources play a critical role in the Middle East and North Africa. As you have mentioned, for decades the fortunes of governments and societies in the region have been closely tied to the availability of energy resources and their ability to bring them to market. Today we find ourselves living in a transformational era for energy markets and the geopolitics of energy, and the capacity of any country to be dynamic and play in this changing global context will determine its success going forward.

I would like to address how countries in the Middle East and North Africa fit into this global energy puzzle and how the United States, in particular the State Department, is working to encourage the development of global LNG markets, build energy linkages in the Eastern Mediterranean, stabilize Libya’s oil and gas sector, and support commercial opportunities in countries such as Algeria.

Energy demand around the world is changing rapidly. Consumption growth has shifted away from the traditional OECD markets and consuming countries and moved increasingly toward the world’s emerging economies. Even as Europe, North America, and the advanced economies in Asia reach increasing levels of efficiency in use of energy, high growth rates in China and India and elsewhere have led to rises in energy consumption. Increasingly, we are in a world where prices and commodity flows are driven by the demands of emerging non-OECD consumers. Around the world new energy suppliers are entering the market. We are moving from a world with a small number of well-defined producers, many of them in OPEC, to a world that welcomes new supplies and production increases from North America, Africa, Asia, and South America. New technology and improved production methods have unlocked previously inaccessible energy resources, fundamentally altering the energy landscape. North America has seen major increases in oil production, as has West Africa, and recent discoveries in East Africa and the Mediterranean are frontier areas with bountiful new energy and gas resources. New suppliers are emerging, including countries such as Israel, that were until very recently assumed to be bereft of energy resources. As all of you keenly are aware, the United States is in the heart of this supply shift around the world. We have added 2 million barrels a day of oil production just in the last 2 years, an amount greater than Nigeria’s crude oil production in total. We have become the world’s largest producer of natural gas and now anticipate that we will become a net exporter of LNG in 2016 and an overall net exporter of natural gas by 2018.

Our relations and interests in the Middle East have always been and will continue to be strong, multifaceted, deep, complex, and strategic. We live in an international global economy with interdependent energy markets, and even if all products we at home consume would originate beneath our own soil and oceans, we would still not be ‘‘independent.’’ A disruption anywhere in the world would have consequences everywhere, including here at home. The American economy is intricately linked to the global market, and we are dependent on the prosperity of others, as they are on us.

Developing frontier resources is a risky and capital-intensive undertaking, and companies will be deterred from making necessary investments if they believe that risk is too high. When investments can be made in places like North Dakota with little or no political risk, it becomes very difficult to convince boards of directors to approve investment in high-risk areas. In North Africa, Algeria is pursuing the next phase of development in its oil and gas fields and producing from its offshore and unconventional resources, but it has to get that investment climate right for that to work and to encourage companies to come and invest.

Mr. HOCHSTEIN. From an economic perspective, two LNG facilities in Egypt that are basically running dry at the moment because Egypt has taken all its gas destined for exports and using it for domestic, it makes sense, if you have the infrastructure already built and the capital investment is there, to use that. Can the geopolitics manage it is the next question. On Turkey, there are only two ways to get a pipeline from offshore Israel to Turkey. One would have to go through the EEZ of Lebanon and Syria, which is less than likely at the moment, or go through the EEZ of Cyprus. So for that there are other geopolitical hurdles that have to be reached. I think we have to sometimes take a step back from enormous amount of statements and conferences and books that are being written about the potential and agree on one thing. The cooperation in the Eastern Mediterranean, energy is a huge boost for that, and that is the way that this region will monetize and capitalize on these new resources. But it is going to take a lot of work and it is going to take a lot of effort and creative thinking to be able to get there.

Condensates are not oil, they are not crude oil, and that is why we don’t count them together. They are a liquid product that you get when you extract natural gas. Some countries are importers of condensate only and they don’t import crude oil, and they use it because they need it for the refining in gasoline, to create gasoline, when they are using crude oil from something else. Some countries develop gas that is very dry gas. Israel is a good example. Their gas doesn’t include much condensate. The United States has a lot of condensate in our gas.

Mr. HOCHSTEIN. Unfortunately, as I said in my testimony, I think that the term ‘‘independent’’ that is used often, in my opinion misused often, in natural gas we are becoming self-reliant and we have become a net exporter. In oil, we are still an importer. But even if we were not, if there was a crisis anywhere in the world that created a major disruption, whether it was a national security disruption, such as a closure of a strait, or a natural one, if Macondo in the Gulf Coast happened in the Persian Gulf, that would have a significant impact on the global markets. Any impact such as those on the global markets will have the same impact here at home. Even if we are producing all that we consume here, you will still have a price shock in the United States. We are an integrated market, and oil and gas are commodities.

Mr. YOHO. Is there a way to mitigate that or soften that if we were to team up with Canada more and Mexico to where we could supply this region that would be more isolated from a world market? And I understand we are all tied together, but it seems like it would soften that more. Because every time we see a spike in gas prices diesel goals up, everything on the shelves of the grocery stores goes up. Is there were a way, if we were to team and have a consortium between Canada and Mexico, the North Americas, to where we supplied the demand for our continent, in this region, we would be less affected by Middle Eastern conflicts.

Mr. HOCHSTEIN.  Condensates are not a crude oil or a product of crude oil. They are a product of natural gas. They are a liquid product of natural gas. They are exported mostly separately and occasionally they are exported together with crude oil. That does not make them the same product.

Mr. WEBER. Coming from Texas, LNG, lots of Petro-Tex Chemical in my district. Liquid gas, ethanes, propanes, propylenes, methanes, products that are used to produce plastic products. And that has ramifications for plastic explosives, by the way.

Mr. CONNOLLY. Could you talk a little bit about how does the growing independence, the growing self-reliance, because of a huge exponential increase in domestic production here in the United States, how does that shift affect your job? I mean, when we look down the road, how will U.S. energy policy in the Middle East be different, say, 15 years from now, 10 years from now than it is today? Clearly, that has got to have some impact in our relations in the region with respect to energy policy.

Mr. HOCHSTEIN. Without a doubt, we are in a new world, not only around the world, but in the United States. And as we look to transition from a major consumer to an exporter, that changes not only the dynamic of our own energy economy at home, but the position that we have broadly and globally.

I think that people are drawing the wrong conclusions from that, as you have heard around in the media and even today in this hearing, that we are somehow changing or reducing our engagement in the Middle East. As I said before, nothing could be further from the truth. We have very complex and strong relations in the Middle East and they will continue. But that is true globally. What we can do, what we are in the position to do today, in the years to come as we become an exporter, is think about how that provides part of the answer to some of the questions that we are seeing playing out. We would like to see a world where no country is reliant on a single source of energy. And if we can be helpful in diversifying the energy mix for countries and sources, I think that will benefit not only those countries, but our own national security and global economic security. And that is true whether we are talking about Europe or whether we are talking about nearer to home in Central America and the Caribbean. The reliance on a single source creates great political difficulties, as we have seen played out over the last 3 months, and the United States is going to be part of that as we start exporting.

Mr. CONNOLLY. Okay. A noble goal, and I am thinking of Turkey as an example as I think I said in my opening statement. But, so what does that mean? Does that mean the United States is going to try to help build alternative pipelines? Does it mean the United States is going to find alternative shipments, LNG, or whatever it may be to try to assist these countries to diversify and lessen their reliance on sole or primary sources of energy?

Mr. HOCHSTEIN. We have and will continue to strengthen our work with countries to identify what other kind of infrastructure and mechanisms within their own regulatory systems that would allow and to ease that pressure and to make them more secure.

Mr. WEBER.   In Texas we have lots of LNG and lots of oil obviously. Things are just bigger and better in Texas, and so we are very honed in and keen on energy and the kinds of benefits that it gives to our country and I would say internationally. With the current prevailing attitude that somehow fossil fuels are bad, and I want to make the distinction that I understand the difference between petroleum products, as I kind of laid out, and natural gas products. We see natural gas products, as you know, in plastic bags, plastic bottles, as I say even plastic explosives they have raifications.


Mr. WEBER. But they do make money by exporting things, those liquids, those ethanes, methanes, propylenes, propanes, everything that we named, they are able to make money when they export that stuff to help underpin their economy. True or not?

Mr. HOCHSTEIN. No.

Mr. WEBER. How is that? They sell those products and they don’t get paid for them?

Mr. HOCHSTEIN. They get paid into accounts that are in banks in foreign countries.

Mr. WEBER. The assets are frozen?

Mr. HOCHSTEIN. The assets then can only be used in very restricted ways and cannot underpin their economy.

Mr. WEBER. Do you think that if America becomes totally energy independent, self-sufficient, it makes for better international security around the world?

Mr. HOCHSTEIN.   I do think it would enhance security, yes.


Posted in U.S. Congress Energy Dependence, U.S. Congress Energy Independence, U.S. Congress Energy Policy | Tagged , | Comments Off on U.S. House hearing on how to get Central Asian oil before Russia and China do, 2006