Why can’t we have a global government?

MacKenzie, D. September 6, 2014. Imagine there’s no countries…it isn’t hard to do, sang John Lennon. Actually it is. Is there an alternative?  NewScientist.

Nation states cause some of our biggest problems, from civil war to climate inaction.

Try, for a moment, to envisage a world without countries. Imagine a map not divided into neat, colored patches, each with clear borders, governments, laws. Try to describe anything our society does – trade, travel, science, sport, maintaining peace and security – without mentioning countries. Try to describe yourself: you have a right to at least one nationality, and the right to change it, but not the right to have none.

Those colored patches on the map may be democracies, dictatorships or too chaotic to be either, but virtually all claim to be one thing: a nation state, the sovereign territory of a “people” or nation who are entitled to self-determination within a self-governing state. So says the United Nations, which now numbers 193 of them.

Even as our economies globalize, nation states remain the planet’s premier political institution.

Yet there is a growing feeling among economists, political scientists and even national governments that the nation state is not necessarily the best scale on which to run our affairs. We must manage vital matters like food supply and climate on a global scale, yet national agendas repeatedly trump the global good. At a smaller scale, city and regional administrations often seem to serve people better than national governments.

How, then, should we organize ourselves? Is the nation state a natural, inevitable institution? Or is it a dangerous anachronism in a globalized world?

Before the late 18th century there were no real nation states, says John Breuilly of the London School of Economics. If you travelled across Europe, no one asked for your passport at borders; neither passports nor borders as we know them existed. People had ethnic and cultural identities, but these didn’t really define the political entity they lived in.

But they also had limits. Robin Dunbar of the University of Oxford has shown that one individual can keep track of social interactions linking no more than around 150 people. Evidence for that includes studies of villages and army units through history, and the average tally of Facebook friends.

But there was one important reason to have more friends than that: war. “In small-scale societies, between 10 and 60 per cent of male deaths are attributable to warfare,” says Peter Turchin of the University of Connecticut at Storrs. More allies meant a higher chance of survival.

Turchin has found that ancient Eurasian empires grew largest where fighting was fiercest, suggesting war was a major factor in political enlargement. Archaeologist Ian Morris of Stanford University in California reasons that as populations grew, people could no longer find empty lands where they could escape foes. The losers of battles were simply absorbed into the enemy’s domain – so domains grew bigger.

How did they get past Dunbar’s number? Humanity’s universal answer was the invention of hierarchy. Several villages allied themselves under a chief; several chiefdoms banded together under a higher chief. To grow, these alliances added more villages, and if necessary more layers of hierarchy.

Hierarchies meant leaders could coordinate large groups without anyone having to keep personal track of more than 150 people. In addition to their immediate circle, an individual interacted with one person from a higher level in the hierarchy, and typically eight people from lower levels, says Turchin.

These alliances continued to enlarge and increase in complexity in order to perform more kinds of collective actions, says Yaneer Bar-Yam of the New England Complex Systems Institute in Cambridge, Massachusetts. For a society to survive, its collective behaviour must be as complex as the challenges it faces – including competition from neighbours. If one group adopted a hierarchical society, its competitors also had to. Hierarchies spread and social complexity grew.

Larger hierarchies not only won more wars but also fed more people through economies of scale, which enabled technical and social innovations such as irrigation, food storage, record-keeping and a unifying religion. Cities, kingdoms and empires followed.

But these were not nation states. A conquered city or region could be subsumed into an empire regardless of its inhabitants’ “national” identity. “The view of the state as a necessary framework for politics, as old as civilization itself, does not stand up to scrutiny,” says historian Andreas Osiander of the University of Leipzig in Germany.

One key point is that agrarian societies required little actual governing. Nine people in 10 were peasants who had to farm or starve, so were largely self-organizing. Government intervened to take its cut, enforce basic criminal law and keep the peace within its undisputed territories. Otherwise its main role was to fight to keep those territories, or acquire more.

Even quite late on, rulers spent little time governing, says Osiander. In the 17th century Louis XIV of France had half a million troops fighting foreign wars but only 2000 keeping order at home. In the 18th century, the Dutch and Swiss needed no central government at all. Many eastern European immigrants arriving in the US in the 19th century could say what village they came from, but not what country: it didn’t matter to them.

Before the modern era, says Breuilly, people defined themselves “vertically” by who their rulers were. There was little horizontal interaction between peasants beyond local markets. Whoever else the king ruled over, and whether those people were anything like oneself, was largely irrelevant.

Such systems are very different from today’s states, which have well-defined boundaries filled with citizens. In a system of vertical loyalties, says Breuilly, power peaks where the overlord lives and peters out in frontier territories that shade into neighboring regions. Ancient empires are coloured on modern maps as if they had firm borders, but they didn’t. Moreover, people and territories often came under different jurisdictions for different purposes.
Simple societies

Such loose control, says Bar-Yam, meant pre-modern political units were only capable of scaling up a few simple actions such as growing food, fighting battles, collecting tribute and keeping order. Some, like the Roman Empire, did this on a very large scale. But complexity – the different actions society could collectively perform – was relatively low.

Complexity was limited by the energy a society could harness. For most of history that essentially meant human and animal labor. In the late Middle Ages, Europe harnessed more, especially water power. This boosted social complexity – trade increased, for example– requiring more government. A decentralised feudal system gave way to centralised monarchies with more power.

But these were still not nation states. Monarchies were defined by who ruled them, and rulers were defined by mutual recognition – or its converse, near-constant warfare. In Europe, however, as trade grew, monarchs discovered they could get more power from wealth than war.

In 1648, Europe’s Peace of Westphalia ended centuries of war by declaring existing kingdoms, empires and other polities “sovereign”: none was to interfere in the internal affairs of others. This was a step towards modern states – but these sovereign entities were still not defined by their peoples’ national identities. International law is said to date from the Westphalia treaty, yet the word “international” was not coined until 132 years later.

By then Europe had hit the tipping point of the industrial revolution. Harnessing vastly more energy from coal meant that complex behaviors performed by individuals, such as weaving, could be amplified, says Bar-Yam, producing much more complex collective behaviors.

End of nations: Is there an alternative to countries?

This demanded a different kind of government. In 1776 and 1789, revolutions in the US and France created the first nation states, defined by the national identity of their citizens rather than the bloodlines of their rulers. According to one landmark history of the period, says Breuilly, “in 1800 almost nobody in France thought of themselves as French. By 1900 they all did.” For various reasons, people in England had an earlier sense of “Englishness”, he says, but it was not expressed as a nationalist ideology.

Part of the reason was a pragmatic adaptation of the scale of political control required to run an industrial economy. Unlike farming, industry needs steel, coal and other resources which are not uniformly distributed, so many micro-states were no longer viable. Meanwhile, empires became unwieldy as they industrialised and needed more actual governing. So in 19th-century Europe, micro-states fused and empires split.

These new nation states were justified not merely as economically efficient, but as the fulfilment of their inhabitants’ national destiny. A succession of historians has nonetheless concluded that it was the states that defined their respective nations, and not the other way around.

France, for example, was not the natural expression of a pre-existing French nation. At the revolution in 1789, half its residents did not speak French. In 1860, when Italy unified, only 2.5% of residents regularly spoke standard Italian. Its leaders spoke French to each other. One famously said that, having created Italy, they now had to create Italians – a process many feel is still taking place.

Sociologist Siniša Maleševic of University College Dublin in Ireland believes that this “nation building” was a key step in the evolution of modern nation states. It required the creation of an ideology of nationalism that emotionally equated the nation with people’s Dunbar circle of family and friends.

That in turn relied heavily on mass communication technologies. In an influential analysis, Benedict Anderson of Cornell University in New York described nations as “imagined” communities: they far outnumber our immediate circle and we will never meet them all, yet people will die for their nation as they would for their family.

Such nationalist feelings, he argued, arose after mass-market books standardized vernaculars and created linguistic communities. Newspapers allowed people to learn about events of common concern, creating a large “horizontal” community that was previously impossible. National identity was also deliberately fostered by state-funded mass education.

The key factor driving this ideological process, Maleševic says, was an underlying structural one: the development of far-reaching bureaucracies needed to run complex industrialized societies. For example, says Breuilly, in the 1880s Prussia became the first government to pay unemployment benefits. At first they were paid only in a worker’s native village, where identification was not a problem. As people migrated for work, benefits were made available anywhere in Prussia. “It wasn’t until then that they had to establish who a Prussian was,” he says, and they needed bureaucracy to do it. Citizenship papers, censuses and policed borders followed.

That meant hierarchical control structures ballooned, with more layers of middle management. Such bureaucracy was what really brought people together in nation-sized units, argues Maleševic. But not by design: it emerged out of the behaviour of complex hierarchical systems. As people do more kinds of activities, says Bar-Yam, the control structure of their society inevitably becomes denser.

In the emerging nation state, that translates into more bureaucrats per head of population. Being tied into such close bureaucratic control also encouraged people to feel personal ties with the state, especially as ties to church and village declined. As governments exerted greater control, people got more rights, such as voting, in return. For the first time, people felt the state was theirs.
Natural state of affairs?

Once Europe had established the nation state model and prospered, says Breuilly, everyone wanted to follow suit. In fact it’s hard now to imagine that there could be another way. But is a structure that grew spontaneously out of the complexity of the industrial revolution really the best way to manage our affairs?

According to Brian Slattery of York University in Toronto, Canada, nation states still thrive on a widely held belief that “the world is naturally made of distinct, homogeneous national or tribal groups which occupy separate portions of the globe, and claim most people’s primary allegiance”. But anthropological research does not bear that out, he says. Even in tribal societies, ethnic and cultural pluralism has always been widespread. Multilingualism is common, cultures shade into each other, and language and cultural groups are not congruent.

Moreover, people always have a sense of belonging to numerous different groups based on region, culture, background and more. “The claim that a person’s identity and well-being is tied in a central way to the well-being of the national group is wrong as a simple matter of historical fact,” says Slattery.

Perhaps it is no wonder, then, that the nation-state model fails so often: since 1960 there have been more than 180 civil wars worldwide.

Such conflicts are often blamed on ethnic or sectarian tensions. Failed states, such as Syria right now, are typically riven by violence along such lines. According to the idea that nation states should contain only one nation, such failures have often been blamed on the colonial legacy of bundling together many peoples within unnatural boundaries.

But for every Syria or Iraq there is a Singapore, Malaysia or Tanzania, getting along okay despite having several “national” groups. Immigrant states in Australia and the Americas, meanwhile, forged single nations out of massive initial diversity.

What makes the difference? It turns out that while ethnicity and language are important, what really matters is bureaucracy. This is clear in the varying fates of the independent states that emerged as Europe’s overseas empires fell apart after the second world war.

According to the mythology of nationalism, all they needed was a territory, a flag, a national government and UN recognition. In fact what they really needed was complex bureaucracy.

Some former colonies that had one became stable democracies, notably India. Others did not, especially those such as the former Belgian Congo, whose colonial rulers had merely extracted resources. Many of these became dictatorships, which require a much simpler bureaucracy than democracies.

Dictatorships exacerbate ethnic strife because their institutions do not promote citizens’ identification with the nation. In such situations, people fall back on trusted alliances based on kinship, which readily elicit Dunbar-like loyalties. Insecure governments allied to ethnic groups favour their own, while grievances among the disfavored groups grow – and the resulting conflict can be fierce.

Recent research confirms that the problem is not ethnic diversity itself, but not enough official inclusiveness. Countries with little historic ethnic diversity are now having to learn that on the fly, as people migrate to find jobs within a globalized economy.

How that pans out may depend on whether people self-segregate. Humans like being around people like themselves, and ethnic enclaves can be the result. Jennifer Neal of Michigan State University in East Lansing has used agent-based modelling to look at the effect of this in city neighborhoods. Her work suggests that enclaves promote social cohesion, but at the cost of decreasing tolerance between groups. Small enclaves in close proximity may be the solution.

But at what scale? Bar-Yam says communities where people are well mixed – such as in peaceable Singapore, where enclaves are actively discouraged – tend not to have ethnic strife. Larger enclaves can also foster stability. Using mathematical models to correlate the size of enclaves with the incidences of ethnic strife in India, Switzerland and the former Yugoslavia, he found that enclaves 56 kilometers or more wide make for peaceful coexistence – especially if they are separated by natural geographical barriers,

Switzerland’s 26 cantons, for example, which have different languages and religions, meet Bar-Yam’s spatial stability test – except one. A French-speaking enclave in German-speaking Berne experienced the only major unrest in recent Swiss history. It was resolved by making it a separate canton, Jura, which meets the criteria.

Again, though, ethnicity and language are only part of the story. Lars-Erik Cederman of the Swiss Federal Institute of Technology in Zurich argues that Swiss cantons have achieved peace not by geographical adjustment of frontiers, but by political arrangements giving cantons considerable autonomy and a part in collective decisions.

Similarly, using a recently compiled database to analyze civil wars since 1960, Cederman finds that strife is indeed more likely in countries that are more ethnically diverse. But careful analysis confirms that trouble arises not from diversity alone, but when certain groups are systematically excluded from power.

Governments with ethnicity-based politics were especially vulnerable. The US set up just such a government in Iraq after the 2003 invasion. Exclusion of Sunni by Shiites led to insurgents declaring a Sunni state in occupied territory in Iraq and Syria. True to nation-state mythology, it rejects the colonial boundaries of Iraq and Syria, as they force dissimilar “nations” together.
Ethnic cleansing

Yet the solution cannot be imposing ethnic uniformity. Historically, so-called ethnic cleansing has been uniquely bloody, and “national” uniformity is no guarantee of harmony. In any case, there is no good definition of an ethnic group. Many people’s ethnicities are mixed and change with the political weather: the numbers who claimed to be German in the Czech Sudetenland territory annexed by Hitler changed dramatically before and after the war. Russian claims to Russian-speakers in eastern Ukraine now may be equally flimsy.

Both Bar-Yam’s and Cederman’s research suggests one answer to diversity within nation states: devolve power to local communities, as multicultural states such as Belgium and Canada have done.

“We need a conception of the state as a place where multiple affiliations and languages and religions may be safe and flourish,” says Slattery. “That is the ideal Tanzania has embraced and it seems to be working reasonably well.” Tanzania has more than 120 ethnic groups and about 100 languages.

In the end, what may matter more than ethnicity, language or religion is economic scale. The scale needed to prosper may have changed with technology – tiny Estonia is a high-tech winner – but a small state may still not pack enough economic power to compete.

That is one reason why Estonia is such an enthusiastic member of the European Union. After the devastating wars in the 20th century, European countries tried to prevent further war by integrating their basic industries. That project, which became the European Union, now primarily offers member states profitable economies of scale, through manufacturing and selling in the world’s largest single market.

End of nations: Is there an alternative to countries?

What the EU fails to inspire is nationalist-style allegiance – which Maleševic thinks nowadays relies on the “banal” nationalism of sport, anthems, TV news programs, even song contests. That means Europeans’ allegiances are no longer identified with the political unit that handles much of their government.

Ironically, says Jan Zielonka of the University of Oxford, the EU has saved Europe’s nation states, which are now too small to compete individually. The call by nationalist parties to “take back power from Brussels”, he argues, would lead to weaker countries, not stronger ones.

He sees a different problem. Nation states grew out of the complex hierarchies of the industrial revolution. The EU adds another layer of hierarchy – but without enough underlying integration to wield decisive power. It lacks both of Maleševic’s necessary conditions: nationalist ideology and pervasive integrating bureaucracy.

Even so, the EU may point the way to what a post-nation-state world will look like.

Zielonka agrees that further integration of Europe’s governing systems is needed as economies become more interdependent. But he says Europe’s often-paralyzed hierarchy cannot achieve this. Instead he sees the replacement of hierarchy by networks of cities, regions and even non-governmental organizations. Sound familiar? Proponents call it neo-medievalism.

End of nations: Is there an alternative to countries?

“The future structure and exercise of political power will resemble the medieval model more than the Westphalian one,” Zielonka says. “The latter is about concentration of power, sovereignty and clear-cut identity.” Neo-medievalism, on the other hand, means overlapping authorities, divided sovereignty, multiple identities and governing institutions, and fuzzy borders.

“The future exercise of power will resemble the medieval model”

Anne-Marie Slaughter of Princeton University, a former US assistant secretary of state, also sees hierarchies giving way to global networks primarily of experts and bureaucrats from nation states. For example, governments now work more through flexible networks such as the G7 (or 8, or 20) to manage global problems than through the UN hierarchy.

Ian Goldin, head of the Oxford Martin School at the University of Oxford, which analyses global problems, thinks such networks must emerge. He believes existing institutions such as UN agencies and the World Bank are structurally unable to deal with problems that emerge from global interrelatedness, such as economic instability, pandemics, climate change and cybersecurity – partly because they are hierarchies of member states which themselves cannot deal with these global problems. He quotes Slaughter: “Networked problems require a networked response.”

Again, the underlying behavior of systems and the limits of the human brain explain why. Bar-Yam notes that in any hierarchy, the person at the top has to be able to get their head around the whole system. When systems are too complex for one human mind to grasp, he argues that they must evolve from hierarchies into networks where no one person is in charge.

Where does this leave nation states? “They remain the main containers of power in the world,” says Breuilly. And we need their power to maintain the personal security that has permitted human violence to decline to all-time lows.

Moreover, says Dani Rodrik of Princeton’s Institute for Advanced Study, the very globalized economy that is allowing these networks to emerge needs something or somebody to write and enforce the rules. Nation states are currently the only entities powerful enough to do this.

Yet their limitations are clear, both in solving global problems and resolving local conflicts. One solution may be to pay more attention to the scale of government. Known as subsidiarity, this is a basic principle of the EU: the idea that government should act at the level where it is most effective, with local government for local problems and higher powers at higher scales. There is empirical evidence that it works: social and ecological systems can be better governed when their users self-organize than when they are run by outside leaders.

However, it is hard to see how our political system can evolve coherently in that direction. Nation states could get in the way of both devolution to local control and networking to achieve global goals. With climate change, it is arguable that they already have.

There is an alternative to evolving towards a globalized world of interlocking networks, neo-medieval or not, and that is collapse. “Most hierarchical systems tend to become top-heavy, expensive and incapable of responding to change,” says Marten Scheffer of Wageningen University in the Netherlands. “The resulting tension may be released through partial collapse.” For nation states, that could mean anything from the renewed pre-eminence of cities to Iraq-style anarchy. An uncertain prospect, but there is an upside. Collapse, say some, is the creative destruction that allows new structures to emerge.

Like it or not, our societies may already be undergoing this transition. We cannot yet imagine there are no countries. But recognizing that they were temporary solutions to specific historical situations can only help us manage a transition to whatever we need next. Whether or not our nations endure, the structures through which we govern our affairs are due for a change. Time to start imagining.


Posted in GOVERNMENT | 2 Comments

Climate change effects on conflict, social unrest, health, mass migration, food, and national security

[ Since oil shortages from exponential decline rates of conventional oil will affect every aspect of civilization from farming to electricity to supply chains far harder and sooner than sea-level rise and other climate change problems, think “energy shortage” whenever climate change is mentioned below. Oil shortages can also arise suddenly from terrorism, war, blocking of oil tankers from key choke-points as well as declining imports as exporting nations keep more and more of their oil within their own country for their citizens. 

And when oil declines CO2 levels will begin to decline.  This is because oil is the master resource that makes all other resources available.  Conventional oil peaked in 2005, it’s highly unlikely unconventional deep ocean, tar sands, and fracked unconventional oil will be able to keep up with conventional oil rate decline (90% of our oil) and population growth, as soon as this year perhaps, and almost certainly by 2030. That means the dire predictions of CO2 increasing until 2100 are unfounded.  Anyhow, the one good thing about peak fossils now or soon is that we may be able to avoid a Permian-level extinction rate.  Though not, unfortunately, the ongoing 6th extinction as a still exponential birth rate forces human development to expand and pollute remaining (rain)forests, wild lands, wetlands, and other biodiverse habitat.

Alice Friedemann   www.energyskeptic.com  author of “When Trucks Stop Running: Energy and the Future of Transportation, 2015, Springer]

National Research Council. 2013. Climate and Social Stress: Implications for Security Analysis. Committee on Assessing the Impacts of Climate Change on Social and Political Stresses, J.D. Steinbruner, P.C. Stern, and J.L. Husbands, Eds. Board on Environmental Change and Society, Division of Behavioral and Social Sciences and Education. Washington, DC: The National Academies Press. 253 pages.

Excerpts:

How might climate change lead to new or increased risks to U.S. national security? Might it, for example, put new stresses on societies or on systems that support human well-being, such as supply chains for food or energy, and thus pose or alter security risks to the United States?

Unusually severe climate perturbations will be encountered in some parts of the world over the next decade with increasing frequency and severity thereafter. There is a compelling reason to presume that specific failures of adaptation will occur with consequences more severe than any yet experienced,

This report has been prepared at the request of the U.S. intelligence community with these circumstances in mind. The U.S. intelligence and security communities have begun to examine a variety of plausible scenarios through which climate change might pose or alter security risks.

First, we focused on social and political stresses outside the United States because such stresses are the main focus of the intelligence community. Second, we concentrated on security risks that might arise from situations in which climate events (e.g., droughts, heat waves, or storms) have consequences that exceed the capacity of affected countries or populations to cope and respond.

Growth in peer-reviewed literature on climate stress and armed political conflict1980–2012


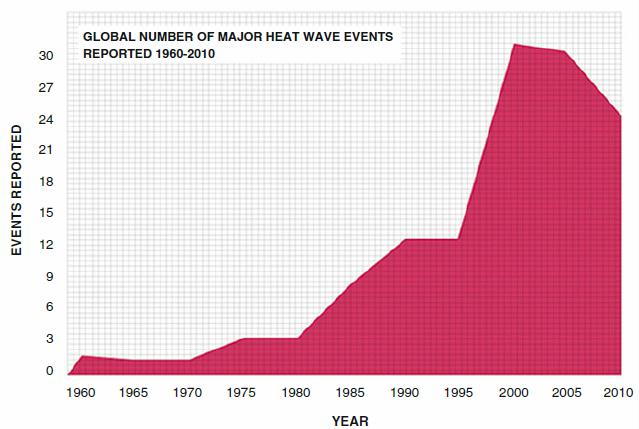
FIGURE 5-4 Growth in peer-reviewed literature on climate stress and armed political conflict, 1980–2012.

Events within the United States and those outside the country affect each other, indirect links between climate and conflict can be related to direct ones, and the effects of climate change will not stop beyond a 10-year horizon and, in fact, can be expected to increase at an increasing rate.

Many of these events will stress communities, societies, governments, and the globally integrated systems that support human well-being.

Conclusion: Given the available scientific knowledge of the climate system, it is prudent for security analysts to expect climate surprises in the coming decade, including unexpected and potentially disruptive single events as well as conjunctions of events occurring simultaneously or in sequence, and for them to become progressively more serious and more frequent thereafter, most likely at an accelerating rate. The climate surprises may affect particular regions or globally integrated systems, such as grain markets, that provide for human well-being. The conjunctions of events will likely include clusters of apparently unrelated climate events occurring closely in time, although perhaps widely separated geographically, which actually do have common causes; sequences or cascades of events in which a climate event precipitates a series of other physical or biological consequences in unexpected ways; and disruptions of globally connected systems, such as food markets, supply chains for strategic commodities, or global public health systems. The surprises are likely to appear first as unusually severe extensions of familiar experience.

Events of a magnitude that has not been disruptive in the past can cause major social and political disruption if exposure and susceptibility are sufficiently great and response is inadequate or widely seen as such.

Conclusion: It is prudent to expect that over the course of a decade some climate events—including single events, conjunctions of events occurring simultaneously or in sequence in particular locations, and events affecting globally integrated systems that provide for human well-being—will produce consequences that exceed the capacity of the affected societies or global systems to manage and that have global security implications serious enough to compel international response. It is also prudent to expect that such consequences will become more common further in the future.

Available knowledge is consistent with a model in which the link of climate events to the potential for significant violence, conflict, or breakdown depends on these factors:

  • the nature, breadth or concentration, and depth of pre-existing social and political grievances and stresses;
  • the nature, breadth or concentration, and depth of the immediate impacts of the climate event;
  • the socioeconomic, geographic, racial, ethnic, and religious profiles of the most exposed groups or subpopulations, as well as their susceptibilities and coping capacities;
  • the ability and willingness of the incumbent government and its internal and external supporters to devise, publicize, and implement effective, transparent, and equitable short-term emergency response and then longer-term recovery plans;
  • the extent to which emergent or established anti-government or anti-regime movements or groups are able to take strategic or tactical advantage of grievances or problems related to responses to the event;
  • the type, breadth, and depth of legitimacy and support for authorities, the government, the regime, or the nation–state; and
  • the coercive and repressive capacities of the government and its willingness and ability to engage and carry out repression.

Within the U.S. government, the entity charged with developing fundamental knowledge about climate vulnerabilities is the U.S. Global Change Research Program (USGCRP).

Countries, regions, and systems of particular security interest should be prime targets for periodic stress testing.

No more than 12 to 15 countries will need to be monitored and subjected to periodic stress tests over the next decade, many of which are likely to be in critical, and often shared, watershed areas in South Asia, the Middle East, and Africa. If the criteria for importance to the United States are expanded to include foreign policy and humanitarian concerns, then the number of countries to be monitored and stress-tested regularly over the next decade may rise to between 50 and 60. Stress testing should also be applied periodically to global systems that meet critical needs, including food supply systems, global public health systems, supply chains for critical materials, and disaster relief systems.

This mission covers a broad range of risks. It includes possible military attacks on the United States, its allies and partners, and American facilities overseas, but it is much broader. The intelligence community is also responsible for assessing the likelihood of violent subnational conflicts in countries and regions with extremist groups, dangerous weapons, critical resources, or other conditions of security concern. It must also anticipate and assess various other risks to the stability of states and regions

How might climate change lead to new or increased risks to U.S. national security? Might it, for example, put new stresses on societies or on systems that support human well-being, such as supply chains for food or energy, and thus pose or alter security risks to the United States?

The assessment itself is still classified, but the methodology and principal conclusions of the report were presented in the statement for the record prepared in conjunction with testimony to the House Permanent Select Committee on Intelligence and the House Select Committee on Energy Independence and Global Warming.

The National Intelligence Council also sponsored an extensive set of unclassified reports and conferences on the potential effects of climate change on key regions and countries; the materials may be found at http://www. dni.gov/index.php/about/organization/national-intelligence-council-nic-publications

While climate change alone does not cause conflict, it may act as an accelerant of instability or conflict, placing a burden to respond on civilian institutions and militaries around the world. In addition, extreme weather events may lead to increased demands for defense support to civil authorities for humanitarian assistance or disaster response both within the United States and overseas. The most frequently cited potential climate events include sea-level rise, the shrinking of glaciers and the Arctic icecap, an increase in extreme weather events, and increasingly intense droughts, floods, and heat waves. The scenarios and examples presented in the above reports address broad consequences for fundamental societal needs such as food, health, and water and also the likely implications for specific regions and countries. Although the reports generally agree that future climate events are likely to increase tensions and political instability within and between states and perhaps also increase internal conflicts, they do not forecast an increase in interstate conflict.

Statements About Climate and Security Connections from Previous Security Analysis

“Climate change acts as a threat multiplier for instability in some of the most volatile regions of the world.”

“[T]he United States can expect that climate change will exacerbate already existing north–south tensions, dramatically increase global migration both inside and between nations (including into the United States), spur more serious public health problems, heighten interstate tension and possibly conflict over resources, challenge the institutions of global governance, cause potentially destabilizing domestic political and social repercussions, and stir unpredictable shifts in the global balance of power, particularly where China is concerned. The state of humanity could be altered in ways that create strong moral dilemmas for those charged with wielding national power, and also in ways that may either erode or enhance America’s place in the world.” (Lennon et al., 2007:103)

“We assess that climate change alone is unlikely to trigger state failure in any state out to 2030, but the impacts will worsen existing problems—such as poverty, social tensions, environmental degradation, ineffectual leadership, and weak political institutions. Climate change could threaten domestic stability in some states, potentially contributing to intra- or, less likely, interstate conflict, particularly over access to increasingly scarce water resources.”

“Since climate change affects the distribution and availability of critical natural resources, it can act as a ‘threat multiplier’ by causing mass migrations and exacerbating conditions that can lead to social unrest and armed conflict.”

“While climate change alone does not cause conflict, it may act as an accelerant of instability or conflict, placing a burden to respond on civilian institutions and militaries around the world. In addition, extreme weather events may lead to increased demands for defense support to civil authorities for humanitarian assistance or disaster response both within the United States and overseas.”

“Climate change is likely to have the greatest impact on security through its indirect effects on conflict and vulnerability.”

“Climate change is not happening in a vacuum: in many areas of the world it will be accompanied by rapid population growth, resource shortages, and energy price increases. Analytically, it is difficult to separate the effects of climate change from other factors, such as food shortages, migration, ethnic tensions and other issues that could drive violence. However, the potential impacts of climate change on water, energy, and agriculture will make it a central driver of conflict. The impacts of climate change combine to make it a clear threat to collective security and global order in the first half of the 21st Century.”

Declines in food and water security are among the most frequently cited kinds of harm, and sub-Saharan Africa is often singled out as the region most likely to experience the greatest effects on security. For example, Fingar (2008) wrote: We judge that sub-Saharan Africa will continue to be the most vulnerable region to climate change because of multiple environmental, economic, political, and social stresses. . . . Many African countries already challenged by persistent poverty, frequent natural disasters, weak governance, and high dependence on agriculture probably will face a significantly higher exposure to water stress owing to climate change.

In some of the scenarios increasing food and water insecurity interact to increase risks to health. In others health risks result from changes in weather patterns that shift the ranges for vector-borne diseases. Several scenarios see such declines in food or water security or disease outbreaks as likely drivers of population migrations, both within and across borders, that result in political or social stress, usually in the countries that receive the immigrant populations.

Two of the most-often cited scenarios are increased flooding or a rise in sea level forcing millions of Bangladeshis into India and an increasing desertification and drought forcing people from northern and sub-Saharan Africa into Europe. In both scenarios immigration issues are already a source of major tension.

Energy security also figures prominently in several projected climate–security scenarios, in which climate change is seen not only as yielding potential benefits for natural gas and perhaps biofuels producers but also as increasing the vulnerability of countries and industrial systems that rely on imported fuel.

The paths envisioned from climate events to specific security consequences are often complicated. For example, tensions could increase over access to increasingly scarce resources, and that escalation, especially if it led to overt conflict, could in turn further limit access to resources so that people who had not previously been affected would now face shortages. Some scenarios suggest that diminished national capacity or outright state failure would create increasing opportunities for extremism or terrorism. Again, sub-Saharan Africa is often cited as the most vulnerable region. In addition to these specific scenarios, many of the reports foresee increasingly frequent and increasingly severe natural disasters that will strain the capacity to cope with the resulting humanitarian emergencies, both in the United States and overseas.

These climate–security analyses raise concerns about several security issues beyond those of inadequate adaptation leading to humanitarian disasters, political instability, or violent conflict.

One class of scenarios involves direct threats of climate change to the ability of the U.S. military to conduct its missions. An example is the threat that sea level rise, possibly in combination with more intense coastal storms, poses to naval bases in low-lying coastal areas. More generally, analyses foresee climate change having broad negative effects on military organization, training, and operations—for example, by exacerbating operational difficulties for troops and equipment in already difficult locations. Other concerns include the vulnerability of U.S. Department of Defense (DOD) fuel supplies to severe weather that disrupts supply lines and the possibility of droughts restricting access to water for forces and facilities overseas. Perhaps the most frequently cited security risk from climate change is the possibility of melting Arctic sea ice leading to increased international tensions over newly accessible sea routes and natural resources in the Arctic. A recent NRC study, addresses these and other security issues of interest to the U.S. naval forces.

INCREASING RISKS OF DISRUPTIVE CLIMATE EVENTS

It is now clear from an accumulation of scientific evidence that the risks of potentially disruptive climate events are increasing.

The rate of carbon dioxide buildup in the atmosphere is now a factor of 10,000 greater than it was during any period on geological record prior to human civilization, and sea levels during prior interglacial periods with comparable average surface temperatures were substantially higher than they currently are. The unprecedented rate of carbon dioxide accumulation means that Earth’s climate system—and likely its ecological system as well—will continue to undergo a very large energy balance adjustment, possibly at an unprecedented rate. One can confidently expect that there will be significant consequences. Although we do not know the exact magnitude, timing, or character of all of these consequences, it is prudent to assume that some of them will appear as surprises in the form of unanticipated events that compel some reaction. National security decision makers do not like surprises and expect the intelligence community to provide sufficient warning to make it possible to avoid, ameliorate, or alter the undesired consequences of emerging developments.

Another factor limiting confidence in the projections of extreme climate events is that the fundamental attributes of Earth’s climate system have moved or very soon will move beyond the bounds of experience on which models are based. For example, the concentrations of greenhouse gases (GHGs) in the atmosphere are now greater than they have been for at least 800,000 year, and the current rate of carbon dioxide accumulation in the atmosphere is at least an order of magnitude greater than the natural rate that prevailed prior to the rise of human civilizations

As climate moves outside the range of experience, models of the effects of higher GHG concentrations cannot be validated against the kinds of high-resolution observational data that provide the most desirable basis for model testing.

Global average temperature already is or soon will be higher than it has been at any time in recorded human history, and it is increasing at an unprecedented rate

This does not mean that climate science has nothing to say about the future of extreme events that can be useful to the intelligence community. What it means is that there are multiple scenarios of the future of climate events that are each likely enough that they deserve consideration by the intelligence community. They should not be treated as predictions but rather as possibilities for evaluation in terms of the social and political scenarios they might set in motion, the security issues that might ensue, and the preparedness of the U.S. government to deal with the consequences.

In security policy the practice for deciding whether to take a hazard seriously is much different from the practice in making scientific claims. Security analysts are focused on risk, which is usually understood to be the likelihood of an event multiplied by the seriousness of the consequences if it should occur. Thus security analysts become seriously concerned about very high-consequence negative events even if scientists cannot estimate the probability of their occurrence with confidence and, indeed, sometimes even if they are fairly confident that the probability is quite low. During the Cold War, for example, most people thought that deterrence was robust, and few thought the likelihood that the Soviet Union would actually initiate a nuclear attack against the United States was anything but minuscule. But because the consequences would have been so dire, tremendous efforts were made by the intelligence and national security communities to monitor events that might provide early warning of the possibility of such a strike. The same is true of threats of terrorist attacks on the U.S. homeland today. Even though there have been few terrorist attacks altogether—and no major ones on the United States since 2001—substantial resources are allocated to identifying threats and reducing risks.

The kind of process that could lead to surprising and very extreme events can be drawn from evidence in the paleoclimate records combined with recognition of enhanced polar temperature variations due to changes in GHG concentrations. Citing an observation by Bintanja et al. (2005) that over the past 800,000 years a 1°C increase in global mean temperature was associated with increased equilibrium sea levels of about 20 meters, Hansen and Sato (2012) have suggested that the sea level rise in the next century may well be on the order of 5 meters. They argue that an increase of 3.6°F (2°C) over pre-industrial temperature levels, which is highly likely to occur in this century, would commit the planet to sea level rise of many meters. Given the considerable uncertainty in the science of glaciology about the stability of major ice sheets, it is unclear whether their contribution to sea level rise over the next century will be linear or will follow a nonlinear trajectory with an increasing rate of change over time. If nonlinear processes prevail, then the common projection of up to 1 meter by the end of the century may be a lower bound rather than an upper bound. The rate at which the sea level rise would occur is critically important, of course, in terms of the social and political consequences.

To better evaluate the import for U.S. national security of scenarios like this, which have some scientific plausibility but which extend beyond the current scientific consensus, the intelligence community might benefit from several types of knowledge that could be developed in the coming decade to help analysts anticipate security issues that might arise if such a scenario is realized.

These would include improved measures of rates of change in temperature and glacier ice cover in the polar regions; the use of existing climate models to project how this degree of ice melting would affect such outcomes as coastal inundation, extreme precipitation, and cyclonic storm severity; and assessments of the exposure, vulnerability, and response capacity of key countries and regions to these outcomes. Several other examples of potential rapid-onset extreme climate event scenarios can readily be found. For instance, models of changes in the Indian summer monsoon indicate that several sharply different but potentially dangerous shifts in the intensity of the monsoon are plausible, with the changes possibly occurring with a transition time of only a year or so. From a security perspective it may make sense to take each of the model-projected futures through a what-if scenario mode. Similarly, projections of the West African monsoon point to a Sahel (the east–west stretch of Africa south of the Sahara desert and north of the Sudanian savannahs) that is either wetter or drier or else has no average change in rainfall but has a doubling of the number of anomalously dry years—three scenarios that could be examined in terms of their social and political implications.

The expanded use of nuclear power in some countries to replace fossil fuels could increase risks of nuclear proliferation. Some policies to increase biofuel production could contribute to food price spikes and thus reduce effective food availability to low-income populations around the world. A single country’s decision to counter global warming by geoengineering, perhaps by fertilizing the ocean to grow photosynthetic organisms or by injecting sulfate particles into the stratosphere, could create conflict with other countries.

An upstream country might impound water from a river to guard against drought and thus reduce water supplies for its downstream neighbors. Or one country might purchase land in another country to produce food for its domestic consumption, creating conflict if a future food shortage hits the country where the food is being produced for export.

Our study focuses largely on developments and vulnerabilities external to the United States, a drought in U.S. agricultural areas that led to a spike in the global price of corn or wheat could lead indirectly to a humanitarian or political crisis elsewhere that could become a national security issue for the United States. Our study does examine such scenarios, but it does not examine the social and political consequences such events might have within the United States, nor does it examine the social and political consequences within the United States of climate events occurring elsewhere that disrupt global systems such as public health or the supply systems for critical commodities.

We emphasize, however, that such a separation between domestic and foreign impacts reflects only the division of missions among federal agencies, not the characteristics of climate phenomena or their consequences.

People and societies depend for their lives and well-being on a number of complex and interrelated systems that may be affected by climate variability and change. The most important systems are those that meet critical human needs by protecting health and providing water, food, energy, shelter, transportation, and essential commercial products. Each of these human life-supporting systems is affected by physical and biological systems, including climate, and by the socioeconomic and political conditions that

organize how people and societies interact with those systems to meet their needs. It is important to recognize that some human life-supporting systems, including international disaster assistance, protections against pathogens, and markets for key commodities such as grains and petroleum, are global. This means that climate-related events anywhere that affect these systems have the potential to create disruptions elsewhere on the planet.

Disputes about the proper attribution of the events can themselves contribute to social disruption. For example, between 2010 and 2012 Pakistan experienced a series of electrical blackouts and shortages of irrigation water, both attributable in part to decreased flows in the Indus River. The decreased flows occurred in the context of a long-term decline in per capita water availability, which by 2010 was less than a third of what it had been in the 1950s as a result of the increasing demands for irrigation water to feed a rapidly growing population, inefficient drainage practices, and possibly inequitable water allocation between regions and uses. Drought arrived on top of these stresses. Protest demonstrations and riots occurred with increasing frequency and intensity during 2010 and 2011, tied mainly to the power blackouts. The blackouts and water shortages themselves were disruptive enough, but, in addition, their cause became a contentious political issue with the potential to inflame Pakistan–India relations. The Pakistani foreign minister blamed the decreased flows on illegal water withdrawals upstream by India.

A simple example is the growing risk to human populations in coastal areas from storm surge and sea level rise. Climate and environmental change are exposing more land to these hazards, but in many regions rapid population growth and infrastructure development resulting from birth rates exceeding death rates, net migration, and economic development are putting people and property in harm’s way faster than climate and environmental change alone.

In many developing countries economic development and urbanization are making large populations less dependent on subsistence agriculture and local food supplies. This trend will decrease these populations’ vulnerability to extreme climate events affecting local crops and meat supplies. At the same time the dependence of low-income populations on imported food supplies provided by global markets may increase their vulnerability to climatic or economic events in other parts of the world that sharply increase the prices of the foods they have come to depend upon.

Disaster researchers point out that both “social capital” in the affected communities and formal emergency response institutions and infrastructure play important roles in mediating the net degree of loss, disruption, and stress that result from extreme environmental events, including climate events. Effective response also depends on the economic and other resources available to the governments of the affected populations and on the governments’ allocation of those resources. Whether or not climate events become social and political stresses serious enough to destabilize a government or generate violent conflict may depend on whether or not governments’ disaster response efforts are perceived to be under-resourced, poorly managed, or characterized by favoritism, corruption, and lack of compassion.

Thresholds or tipping points have received much attention in the literature of physical climate science. In Chapter 3 we discuss evidence on the likelihood, in the next decade, of crossing important physical thresholds that could lead to a sharply altered climate regime. Less commonly examined are the ways in which changes in human systems might sharply alter vulnerabilities and thus contribute to the potential of even small climate events to have major impacts. Such changes could contribute to social and political stresses.

Relatively slow climatic, ecological, or economic changes can shift the balance of supply and use of natural systems at a local or regional level to the point that adequate supply can be achieved only with favorable climate conditions. The effects may not be noticeable until an unusual climate event occurs,

Increasing Dependence on Global Markets

Economic development in most countries has generally been marked by a pattern in which livelihoods depend decreasingly on subsistence agriculture and the local manufacture of essential products and increasingly on wage labor and the purchase of necessities in global markets. This transition usually includes a rural–urban shift in national populations as well. Historically, these changes have tended to decrease vulnerability of food supplies to local climate events because when destructive climate events occur locally, necessities can be purchased from places where such events have not occurred. But while direct vulnerability to events that limit local food production has decreased, vulnerability, especially of the lowest-income groups, remains and may be increased with respect to events that limit distribution or that sharply increase prices in global markets for necessities that cannot be acquired locally. Economic globalization thus changes the nature of vulnerability to climate events as well as the degree of that vulnerability. With globalization, populations become increasingly interconnected via international trade so that it becomes possible, for example, for a climatic event that affects one of the world’s grain-producing regions to influence global commodities markets in ways that can seriously affect populations that do not directly experience the climate event. In this way the well-being of households in Lagos or Nairobi can be sharply affected by a drought in Ukraine or the United States.

Climate change can alter the ranges of certain species of pests or pathogens, increasing the exposure of human populations or economically important nonhuman species. The expansion of the pine bark beetle in North America is a familiar example. As average temperatures in the region increased, making additional areas suitable for beetle infestations, the beetle expanded its range northward and toward higher elevations (Carroll et al., 2003). The ecological change did not become seriously disruptive to human populations until the increased prevalence of dead trees combined with drought and hot weather to produce major wildfires that affected populated areas.

climate change wildfire usa


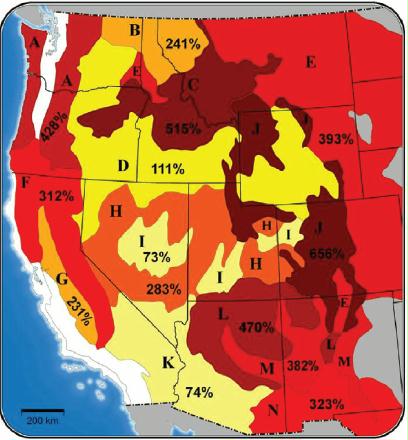
FIGURE 3-2 Map of increased risk of fire in the western United States as a result of rising temperatures and increased evaporation. The figure shows the percentage increase in burned areas in the West for a 1.8°F (1°C) increase in global average temperatures relative to the median area burned during 1950–2003. For example, fire damage in the northern Rocky Mountain forests, marked by region B, is expected to more than double annually for each 1.8°F (1°C) increase in global average temperatures. With the same temperature increase, fire damage in the Colorado Rockies (region J) is expected to be more than seven times what it was in the second half of the 20th century. SOURCE: National Research Council 2011a.

Slow climate change could potentially have similar effects on the evolution or distribution of human pathogens (influenza, yellow fever, etc.) or of pests of major crop or livestock species. When one of these pests or pathogens makes contact with a vulnerable population, epidemics, epizootics, or crop failures can spread rapidly, leading to major losses of human life and well-being. Slow processes of ecological change or slow changes in the resistance of host populations to disease organisms could lead to the crossing of a tipping point in vulnerability, at which point the meeting of pest and host populations can set off a highly disruptive chain of events.

Policy makers have limited cognitive bandwidth, so they can pay attention to only so many warnings.

Risk is typically defined as the severity of an undesired outcome multiplied by the likelihood of its occurrence. Climate change alters both the likelihood of occurrence and the likely severity of certain events that may degrade human life-supporting systems. Changes in these systems may in turn alter the likelihood and severity of social disruption, stress on political systems, and events of potential importance to U.S. national security—violent internal or international conflict, state failure, and so forth.

The security risks posed by climate change are multidimensional. The overall risk may depend on attributes of: Climate events: 1. Types of climate events (e.g., floods, crop failures, and disease outbreaks)

Earth’s climate provides the environment in which humanity has evolved and in which human societies have expanded and thrived. It also periodically generates events that disrupt those societies—in some historic cases, apparently causing the failure of entire civilizations, although in many of those cases considerable dispute exists about the precise cause.

The fundamental science of climate change suggests that continued global warming will increase the frequency or intensity (or both) of a great variety of events that could disrupt societies, including heat waves, extreme precipitation events, floods, droughts, sea level rise, wildfires, and the spread of infectious disease. Underpinning many of these extreme events is an acceleration of the global hydrological cycle. For each 1.8°F (1°C) increase in the global mean surface temperature, there is a corresponding 7 percent increase in atmospheric water vapor. Because warm air holds more water vapor than cool air, this leads to more intense precipitation. Essentially, warm air increases evaporation from the ocean and dries out the land surface, providing more moisture to the atmosphere that will rain out downwind. Water vapor is also a powerful naturally occurring greenhouse gas. As such it is the source of a very strong positive feedback to the coupled climate system that amplifies any external forcing by a factor of approximately 1.6.

Severely burned forest lands are also more prone to erosion in storms, indicating that forest fires increase the risks of soil degradation and of mudslides.

Climate change may thus be playing at least four different roles in this dynamic: It promotes bark beetle infestations, weakens trees, dries the environment, and creates weather conditions conducive to fire outbreak. These conditions, connected in sequence, increase the risks of major forest fires and their hydrological and human consequences.

Climate events occurring in one part of the world have the potential to affect other parts of the world through important, globally integrated systems other than climate itself. One example is the potential influence of climate events on the world supply—and therefore the prices—of international traded commodities, such as grains. By this mechanism an event such as the 2012 drought in the central United States, still developing as this is being written, could affect world corn or wheat prices in ways that make essential foods unaffordable for populations in Africa or Asia.

Constraints on the availability of humanitarian aid for a country because aid providers are responding to situations elsewhere in the world. Yet another would be a climate event that altered the distribution of a major pathogen affecting people or staple crops. These examples, which are discussed in greater detail in Chapter 4, indicate that there are numerous ways in which climate events could create shocks to integrated global social, economic, health, or technological systems and thus have effects far removed geographically from where the events occur.

A special focus should be on quantifying risks of events and event clusters that could disrupt vital supply chains, such as for food grains or fuels, and thus contribute to global system shocks.

Bread or flour are often subsidized, demonstrations and even riots frequently occur in response to efforts by governments to reduce subsidies, for example as part of structural adjustment policies. In general these disturbances are contained without an impact on the regime, even if there may be significant violence or property damage. The issue with regard to climate change is whether that pattern could change and that the countries most vulnerable to food price increases could become vulnerable to severe social and political unrest. Unfortunately, there is very little in the peer-reviewed literature concerning the links between food price increases and political unrest. One notable exception is a recent working paper that presented an econometric analysis of global data since 1990 and found that high food prices were significantly correlated with political unrest related to food prices, with the latter measured by counting the number of news stories with at least five mentions of terms related to food and riots (or their synonyms). Interest in the topic has increased in recent years, particularly within the community concerned with food security, spurred on by the question of whether rising food prices played a role in sparking the unrest of the “Arab Spring” of 2011. It is worth noting that the rapid food price increases in the MENA during this period were not driven by local weather conditions, but by events around the world including a severe heat wave in Russia. A report by Lagi et al. (2011) notes that clusters of unrest in the MENA region in 2008 and early 2011 both began immediately after the United Nations Food and Agriculture Organization food price index passed a value of 210. Although they do not identify a causal link between high food prices and riots, the authors argue that a food price index value of 210 represents a simple potential predictor of increased unrest in food-importing countries. Breisinger et al. (2011) find that the unrest was preceded by a drop in food security across the MENA, and Ciezadlo (2011) emphasizes the role that food subsidies have played in popular attitudes toward regimes throughout the region. Johnstone and Mazo (2011) draw connections between climate events (which reduced global food production in the years preceding 2011) and the uprisings, describing climate change as a potential “threat multiplier” in the case of already unstable situations. All of these analyses are careful to note that drawing direct causal links between food prices and political instability is not possible, but they argue that food prices must be considered along with political and cultural factors in explanations of the uprisings.

Possibilities for energy system shocks to have global impacts in the coming decade lie primarily in the petroleum sector. The integration of petroleum markets was stimulated by desires to safeguard the supply of oil from manipulation by political actors in the wake of Organization of Petroleum Exporting Countries embargoes in the 1970s. A consequence of this integration was that by the 2000s the petroleum system had become so complex and interconnected that, as one study concluded, “a disruption in one part of the infrastructure can easily cause severe discontinuities elsewhere in the system”.

Furthermore, the sensitivity of the system has increased because of a rapid growth in global petroleum consumption that has not been matched by a corresponding increase in production. The result has been an extremely tight market, with petroleum supplies not significantly greater than demand. This “demand shock”, led by the emerging economies in China and India, has left global markets volatile and very sensitive to disruptions in supply.

In this tight, sensitive market, climate events that disrupt the production or distribution of oil could lead to price spikes across the global energy market. Several types of climate events could cause such disruptions. Tropical storms and the increased storm surges that result from sea level rise and, in some cases, land subsidence, can disrupt production, refining, and transport of petroleum. One-third of U.S. petroleum refining and processing facilities are located in coastal areas vulnerable to storms and flooding. Similar infrastructure vulnerabilities exist in Europe and China as well. In addition, because offshore oil and gas platforms are generally not designed to accommodate a permanent rise in mean sea level, climate-related sea level rise would disrupt production. The effects of Hurricanes Katrina and Rita in 2005 illustrate this potential. The storms disrupted oil and gas production from offshore rigs, refining at facilities in the coastal zone, and transportation via port facilities and pipelines, causing a spike in global prices. The pattern repeated, although with a smaller magnitude, when Hurricanes Gustav and Ike hit the Gulf Coast region in 2008, destroying drilling rigs and disrupting refineries. Other climate events could also affect the global oil market. Oil refining requires large amounts of water for cooling purposes; hence, reduced water availability during a drought would reduce refining capacity. If drought is accompanied by increased temperatures, refineries will require more cooling water to operate, potentially exacerbating the situation. Also, Arctic energy infrastructure (pipelines and drilling operations) is vulnerable to damage from subsidence caused by melting permafrost.

There has been some analysis of their potential macroeconomic effects. Hamilton (2003, 2008), reviewing six decades of oil price and macroeconomic data, reported a very strong relationship between oil price shocks and recessions. To the extent that economic disruptions drive political instability, it is plausible that an oil price shock could increase instability, particularly in a situation that is already politically sensitive. However, little research to date has directly addressed the political impacts of energy price shocks, whether caused by climate-related supply disruptions or other factors. These possibilities deserve more careful empirical analysis, particularly as energy markets continue to tighten with increased consumption from Asian nations and as risks increase of climate events disrupting energy supplies.

Strategic Product Supply Chains

Over the past few decades the globalization of many industries has been accompanied by a streamlining of their supply chains in order to reduce costs. However, as a 2012 World Economic Forum publication noted, “the focus on cost optimization has highlighted the tension between cost elimination and network robustness—with the removal of traditional buffers such as safety stock and excess capacity” (p. 10). Climate events can thus be a source of major disruptions in world markets for critical non-food commodities. Such events are counted as one of the major risks to be addressed in the U.S. National Strategy for Global Supply Chain Security, released in January 2012 (White House, 2012).

The floods in Thailand in 2010–2011 illustrate how an extreme climate event that stresses a government’s ability to respond can have global consequences. Much of Thailand, including portions of the capital Bangkok and its surrounding manufacturing districts, was flooded for extended periods between July 2011 and January 2012. The flooding resulted in more than 800 deaths, affected 13.6 million people, damaged 7,700 square miles of farmland, and caused more than $45 billion in economic losses. Resistance appeared in some localities where flooding had increased due to barriers designed to protect neighboring communities. Some people ripped down the sandbags that they saw as unfairly diverting flood waters to their areas.

The floods also caused significant disruption to regional and global supply chains. Manufacturing parks located near Bangkok supply parts for the worldwide automobile and electronics industries. One-third of the world’s hard drives and high percentages of other key computer components are built there. Many of these Thai manufacturing areas were covered by up to 3 meters of water, causing parts shortages worldwide. Even the computer firms located elsewhere in Thailand that escaped the flooding found they could not get critical parts. Production is not expected to fully recover until 2013. In the meantime, component prices rose as suppliers attempted to stockpile what was available and manufacturers found they could not get the parts they needed. The flooding of automotive parts production facilities forced Honda and Toyota to slow production lines in many countries.

A study by Dell et al. (2012) found that a 1°C rise in temperature in a given year increased the probability of “irregular” leadership transitions (such as coups) in poor countries.

Traditionally, the primary security concerns of the United States and other nations have included the prevention of external assault, the prevention of insurrections and other large-scale domestic violence, and the maintenance of the political and economic stability of the state. U.S. national security concerns also extend to similar threats faced by our allies and by other states considered to be of critical importance for our national security. Other situations, such as major humanitarian crises, pandemics, or disruptive migration, which may threaten the stability of U.S. allies or other states and perhaps lead to a direct U.S. response, are also increasingly considered part of the landscape of potential security risks.

Water is essentially irreplaceable. With other resources, such as energy and food resources, there are a number of substitutes that can be used to meet the societal needs for these resources. Currently, however, water can only be replenished at costs that are beyond the reach of many of the most water-stressed countries. Conflict over water availability or caused by issues related to delivery of water resources to meet competing needs of energy, food, and health thus have the potential to define critical climate-related conflicts and relief challenges across the globe.

The agricultural sector is currently responsible for around 70% of freshwater consumption.

“There are 263 rivers around the world that cross the boundaries of two or more nations”. In total, these river basins account for just under half of Earth’s land area, are home to 40% of the world’s population, and make up some part of 145 countries. A number of these basins—the Indus, Nile, Tigris–Euphrates, Jordan, Brahmaputra, and Amu Darya river systems, for example—are in areas of strategic importance for the United States. “In addition, about 2 billion people worldwide depend on groundwater, which includes approximately 300 transboundary aquifer systems”.

In defining migration, a distinction is typically made between internal migration, which entails population movement within a country, and international migration, where population movement extends across international borders. It is also important to keep in mind other features of population movement, such as whether it is temporary or permanent and whether it is voluntary or forced. Even within these different categories, migration can take a variety of forms, including: temporary or permanent displacement of a population following some type of climate event or other disruptive event, such as a tsunami or nuclear accident; forced or voluntary migration out of an area of political or military conflict; temporary or permanent relocation of a population from an area threatened by flooding or inundation; and temporary or permanent movement from one region or country to another for economic opportunity.

Given the emphasis in this report on climate change and U.S. national security, we are particularly interested in a specific type of migration, which we term “disruptive migration.” Disruptive migration, which may be internal or international, generally involves large-scale movements of populations that are socially, economically, or politically disruptive, either in the area of origin, the area of destination, or in sensitive border regions that may be affected by population movements.

Climate change may constitute a direct environmental driver of either temporary or permanent migration via its effects on the availability of ecosystem services including, for example, the supply of freshwater, which may change under altered rainfall regimes; coastal flood protection, which may be lost as the result of sea level rise; and changes in the productivity of agricultural lands as a result of changes in temperature and precipitation regimes. Climate change may also affect the likelihood of droughts, coastal storms, and other types of hazardous climate events, which may temporarily or permanently displace susceptible households. Climate change may indirectly contribute to migration, whether temporary or permanent, via effects on economic, political, and social drivers. For example, climate change may influence agricultural and natural resource–related livelihood opportunities in a particular region, or it may contribute to political conflicts within a region over water or other resources.

Climate change–related threats to human security may be just as prominent in areas of migration destination, particularly urban ones that receive large numbers of immigrants, as in areas of emigration. Migrants into new areas may also place strains on governmental or other resources and may potentially contribute to new types of conflicts, particularly within receiving areas that are already under social stress

Migration typically requires a significant outlay of financial resources, yet actions needed to cope with environmental changes (e.g., selling land or livestock) can reduce a household’s assets to the point that family members who could adapt by migrating may not have the resources to do so. Those households or individuals who cannot migrate out of a region that is undergoing environmental change are among the most vulnerable (Black et al., 2011c). Regions with large concentrations of “trapped” populations that are unable to migrate may pose a new type of human security threat. When an extreme climate event occurs, these “poorest of the poor” may end up trapped in environmentally degraded areas.

The Political Instability Task Force (PITF) is an ongoing and unclassified research program funded by the Central Intelligence Agency that began work in 1994 as the Task Force on State Failure, a panel of academic scholars and methodologists. Its original task was to assess and explain the vulnerability of states around the world to political instability and state failure, focusing on events like the collapse of state authority in Somalia and the former Zaire and other onsets of disruptive regime change, civil war, genocide and mass killing, and onsets and terminations of democratic government.

Extreme political instability has generally not explored potential climate–security connections. As the Bates (2008) and Marten (2010) reviews make clear, most of the efforts to understand the origins of state failure focus primarily on economic factors, various forms of ethnic divisions, and the state of democratization in a particular country.

One literature that does provide a more detailed exploration of potential climate–security links is the literature on the potential political impacts of disasters. Its findings generally support the conclusion that climate events that trigger disasters of various types are associated with political instability, although not in a straightforward way. The relationships, including causes and effects, are highly complex and contingent. The overall analytic challenge was well captured in a recent review of detailed analyses of several major disasters of the past, including some that led to state failures (Butzer, 2012). The review found that in many, but not all, instances, states survived the calamities, and it cautioned against drawing too straight a line between disasters and state failures, noting that state breakdowns differ because of the “great tapestry of variables” involved.

The scenarios in which climate events are most likely to lead to risks to U.S. national security are in countries of security concern that have a significant likelihood of exposure to particular climate events combined with susceptible populations and life-supporting systems, weak response capacity, and underlying sources of potential political instability. Pakistan offers a case that illustrates these points particularly well, as described below.

Of the many places in the world where climate dynamics might induce globally consequential disruption within a decade, Egypt is a principal possibility. Egypt’s population of some 80 million people consumes 18 million tons of wheat annually as a dietary staple, half of which is imported, with virtually all the rest dependent on water from the Nile River. The Nile flows through Sudan and Ethiopia before entering Egypt and accumulates nearly all of its volume upstream. The production of wheat and other food crops supported by the river is being burdened by population increases in all three countries. The countries’ current combined total of 208 million people is projected to reach 272 million by 2025, presumably generating an increase in agricultural production demand on the order of 30% or more within the watershed. In addition South Korea and Saudi Arabia have purchased large tracts of land in the watershed to assure imports for their own populations, and that will also add to the demand for water.

Pakistan is at risk

Pakistan presents a clear example of a country where social dynamics and susceptibility to harm from climate events combine to create a potentially unstable situation. Pakistan’s economy depends heavily on water from the Indus River, and competition for this water is increasing. Therefore, Pakistan’s political and economic systems may be vulnerable to hydrological changes in the Indus system such as have been observed recently and which may be affected by climate change and variability at a subcontinental scale. Agriculture is a central component of the Pakistani economy. The sector accounts for 21% of annual gross domestic product (the second-largest fraction by sector) and is by far the largest source of employment, employing 45% of Pakistani workers.

These percentages do not capture the dependence of other sectors on agriculture. Much of the agricultural production feeds domestic industry, particularly the cotton grown for the country’s large textile industry. Textiles and clothing make up a very large portion of Pakistan’s exports—approximately 50% in recent years—thus representing the country’s most important source of foreign currency.

Given the low levels of rainfall in the agricultural areas of the country, Pakistan’s agricultural sector relies heavily on irrigation. The ratio of area of irrigated to rain-fed agricultural land is 4-to-1, the highest ratio worldwide. Water for irrigation is drawn primarily from three storage reservoirs on the Indus, making this crucial economic sector highly dependent on adequate flows in the Indus system. Further stressing the Pakistani water system, demands for water for agricultural, domestic, and industrial uses are increasing. Agricultural production is intensifying, shifting from subsistence crops to commodity crops (mostly cotton, sugarcane, and rice) that produce more output but require more water; manufacturing activity is increasing as a share of the economy; and population growth, especially in urban areas, is requiring more withdrawals of Indus water for domestic consumption. Also, hydroelectric power provides 37% of Pakistan’s electricity, mostly from reservoirs also used for irrigation-water storage, creating competition for water resources between agriculture and energy,

Protests over power outages, although not new in Pakistan, have led to increasing civil unrest over the past five years. With the onset of a sweltering summer, power shortfall hit a record high of 8,000 megawatts in 2012, or nearly 45% of national demand, leading to 18 to 20 hours per day of power outages and stoking riots and mass-scale protests. Reports from the ground recorded violent protests throughout the country. In a recent episode of escalating violence, rioters burned trains, damaged banks and gas stations, looted shops, blocked roads, and, in some instances, targeted homes of members of the National Assembly and provincial assemblies. According to a senior local police officer in the largest city, Karachi, on average there were at least six protests against power outages in the city per day in 2011. Competition between water uses is likely to increase if government plans are implemented to increase hydroelectric capacity as a cheaper alternative to imported fossil fuels. As a result of these demographic and economic changes, an already tight water supply is becoming increasingly stressed, to the point that

Beyond the short-term events, there is some evidence that the mass balance of the Karakoram glaciers in the headwaters of the Indus system— the source for the great majority of the river’s water (Archer and Fowler, 2004)—has been changing in ways that may reduce river flows. Glacial and snow melt are more important to water supplies in Pakistan than they are to countries farther east in the Himalayan region, where monsoons provide a much larger share of river flows (Bolch et al., 2012). Precipitation levels in winter, when most glacial accumulation occurs in the Karakoram area, have recently increased

INTERSTATE AND INTRASTATE CONFLICT AND VIOLENCE

Patterns of Violent Conflict

As background for the discussion of research about climate–conflict connections, it is useful to note several general trends in global patterns of internal and interstate conflict since the end of World War II. Traditionally researchers have used the threshold of 1,000 battle-related deaths in a year when defining a “war.” There are several large databases that track the incidence of conflicts, including different types of wars and armed conflicts around the world. In addition, there are projects to track other forms of political violence (e.g., armed attacks and political murders) or political conflict that may fall short of violence (e.g., riots).

The limitations imposed on forecasting by the relatively small number of interstate wars in recent decades are compounded by the continuing changes in the fundamental characteristics of the international system since the end of the Cold War. These circumstances make it extremely difficult to test competing hypotheses about risk factors for interstate conflict that would be relevant to current circumstances. In addition to these difficulties there is a lack of consensus among scholars about the causes of such wars and about how they compare with the sources of internal conflict. These are problems that affect any effort to understand the risks of a return to more frequent interstate conflict.

There has also been almost no effort to explore empirically whether climate factors might lead to or exacerbate tensions between states to a point short of outright war.

The core thesis for those arguing for a link between climate and violent conflict is that climate change–induced health problems and resource scarcity (in particular, the availabilities of water, food, and energy) will lead to interstate violence and intrastate unrest, instability, and armed conflict in the most directly affected nations or regions. Homer-Dixon (1991, 1994, 1999, 2007) and Swart (1996) were among the earlier articulators of this concern in the peer-reviewed literature, followed later by Sachs (2005, 2007), Kahl (2006), Stern (2007), and Lee (2009), among others.

Adverse climate change could lead to increasing natural disasters, rising sea levels, and worsening resource scarcities, all three of which are posited to lead directly to increased or forced migration and then, both directly and indirectly, to “loss of economic activity, food insecurity, and reduction in livelihoods” There are also pre-existing conditions as poor governance, societal inequalities, and “bad neighbors” (countries characterized by ongoing violence) as well as population pressure exacerbated by migration, and five “social effects of climate change [that] have been suggested as intermediating catalysts of organized violence”: political instability, social fragmentation, economic instability, inappropriate response (possibly meaning inappropriate adaptation), and additional migration, all of which act in a feedback loop. These five putative social effects of adverse climate change could lead to either increased opportunities to organize violence or increased motivation to instigate violence, with the end result being an increased risk of armed conflict.

Conclusion: It is prudent to expect that over the course of a decade some climate events—including single events, conjunctions of events occurring simultaneously or in sequence in particular locations, and events affecting globally integrated systems that provide for human well-being—will produce consequences that exceed the capacity of the affected societies or global systems to manage and that have global security implications serious enough to compel international response. It is also prudent to expect that such consequences will become more common further in the future.

Posted in Caused by Scarce Resources, Climate Change, Planetary Boundaries | Tagged , , , , | Comments Off on Climate change effects on conflict, social unrest, health, mass migration, food, and national security

Climate change is already collapsing nations

Global frequency of heat wave events. Source : National Academy of Sciences, graph
derived from EM DAT, International Disaster Database, Universite Catholique de Louvain,
Brussels


Ahmed, Nafeez. 2017. Failing States, Collapsing Systems BioPhysical Triggers of Political Violence. Springer.

“The last half century has seen a dramatic increase in the frequency and severity of extreme weather events in the form of droughts, wildfires, extreme rainfall, floods, hurricanes and tornadoes. The Met Office concludes that despite scientists’ reluctance to attribute specific extreme weather events to human-induced climate change, there is now no longer any doubt that climate change is making extreme weather increasingly likely all over the world (Stott 2016).

By far the most disturbing study led by the University of Hawaii argued that the pattern of escalating intensity and frequency indicates that anthropogenic climate change is rapidly pushing the climate system into a ‘new normal’, that breaks fundamentally with the preceding 150 years. The paper came up with the concept of “climate departure” to explain its prediction that in coming decades, the trajectory of escalating extreme weather signals that the climate is destined to ‘depart’ from the historical norm of weather as we have known it. On a business-as-usual trajectory, the initial locus of this “climate departure” will occur within the next decade in the tropics—that is, a vast region encompassing parts of the Middle East, Central Asia, South Asia and Africa. On a global scale, “climate departure”—the entry into a ‘new normal’ of extreme weather—will hit around 2047. Even under stringent carbon emission mitigation scenarios, this tendency to “climate departure” will not be halted—only postponed a few more decades, to around 2069 (Mora et al. 2013).

While the oceans are dying, above the oceans the atmosphere is already experiencing the direct impact of climate change in the form of intensifying heatwaves and extreme weather events. The increasing frequency—and increasing intensity—of heat waves is perhaps one of the most overt manifestations of the dangerous impacts of climate change. Since 1950, the number of heat waves worldwide has increased, heat waves have become longer, and the hottest days and nights are hotter than ever before. In recent years, the global area affected by summer heatwaves has increased 50-fold. Within the US, the direct impact of more frequent and intense heatwaves is an increasing frequency and duration in wildfires (Trendberth et al. 2012).

Heatwaves would likely occur 10 times more than they do now. Such intolerable conditions would endanger the lives of the regions’ 500 million inhabitants, and force people to migrate simply to survive (Lelieveld et al. 2016).

This means, very simply, that no matter what mitigation efforts look like on climate change, the coming decades will see increasing instability in the Middle East and North Africa, and an ever greater exodus from parts of the region into the Northern hemisphere. Intensifying climate-induced droughts and heatwaves will create conditions that no regional state will be able to cope with.

Food Production

Climate change is already dramatically affecting the global food system. Many of the extreme weather events in recent years have been concentrated in some of the world’s most critical food basket regions, contributing directly to prolonged crop failures that have been linked to global food price spikes and other phenomena. It is already known that anthropogenic climate change to date has had a debilitating impact on global food production, partly associated with the impact of more frequent extreme weather events on crop production. Total losses in national cereal production from 1964 to 2007 due to droughts and extreme heat likely caused or exacerbated by climate change have been estimated at 9–10% (Lesk et al. 2016).

Corresponding to the rising trends of increasing climate disruption and energy decline, recent decades have seen a marked increase in political violence worldwide. These outbreaks of political violence demonstrate that prevailing national state institutions and their domestic monopolies in the means of violence (which is the basic underpinning of state power as defined by the capacity to mobilize violence to control a defined national territory) are increasingly being challenged and undermined. In other words, what we are witnessing is a creeping acceleration of the forces of non-state political violence that directly weaken the very fundamentals of state power.

30 May 2012 by Michael Marshall. Extra heatwaves could kill 150,000 Americans by 2099. NewScientist.

[ My comment: Meanwhile, climate change will be causing blackouts and brownouts, so millions more won’t have air conditioning, which could lead to even higher death tolls].

By the end of the century, heatwaves caused by global warming could kill 150,000 people who would otherwise live.

A report by the US Natural Resources Defense Council (NRDC) estimates how many extreme heat events will hit the US this century, assuming greenhouse gas emissions continue on their current path according to the report – Killer Summer Heat: Projected death toll from rising temperatures in America due to climate change.

Climate models suggest that by 2099 the 40 most populous cities will have approximately eight times as many days of extreme heat per year as today.

The figure may actually be an underestimate, because the US population is ageing and older people are more vulnerable to heat. Louisville, Kentucky will be the worst affected city, with an extra 19,000 deaths by 2099.

The European heatwave of 2003 killed 35,000 people, so the report’s estimate is “not unrealistic”, says Andreas Sterl of the Royal Netherlands Meteorological Institute in De Bilt.

References

Lelieveld, J., Y. Proestos, P. Hadjinicolaou, M. Tanarhte, E. Tyrlis, and G. Zittis. 2016. Strongly Increasing Heat Extremes in the Middle East and North Africa (MENA) in the 21st Century. Climatic Change 137(1–2): 245–260.

Mora, Camilo, et al. 2013. The Projected Timing of Climate Departure from Recent Variability. Nature 502(7470): 183–187.

Stott, Peter. 2016. How Climate Change Affects Extreme Weather Events. Science 352(6293): 1517–1518.

Trendberth, Kevin, Jerry Meehl, Jeff Masters, and Richard Somerville. 2012. Heat Waves and Climate Change. https://www.climatecommunication.org/wp-content/uploads/2012/06/Heat_ Waves_and_Climate_Change.pdf

Posted in Climate Change, Collapsed & collapsing nations | Tagged , , , | Comments Off on Climate change is already collapsing nations

Plant more prairies to save topsoil and prevent pollution runoff

[ A program to plant more prairies to enrich the soil, keep topsoil from blowing and washing away, and provide a bio-diverse habitat for hundreds of species is receiving little funding or farmer participation, even though it would save farmers money and keep nutrient runoff from suffocating shrimp and other marine life in the Gulf.  A few of the points made:

Iowa’s soil is eroding at an alarming rate. Topsoil was an average of 14 inches deep statewide in the mid-1800s; now it’s about six, Iowa State researcher Rick Cruse estimated in studies.  “Can we keep going this way for another 150 years? I don’t think so,” Smith said.

Over time, prairie was nearly eradicated. Farmers today are still destroying the little that is left.  

Alice Friedemann   www.energyskeptic.com  author of “When Trucks Stop Running: Energy and the Future of Transportation”, 2015, Springer and “Crunch! Whole Grain Artisan Chips and Crackers”]

Fears, D. August 8, 2016. Iowa farmers ripped out prairie; now some hope it can save them.  Washington Post.

There’s a wild presence in Tim Smith’s corn and soybean field that most farmers kill on sight.

Smith made his way toward it, hoisting his long legs over row after row of soybean plants under a baking mid-morning sun. “It’s right over there,” he said. He stopped at the edge of a Midwestern prairie, a thicket of tall flowers and grasses more frightening to farmers than any horror movie madman lurking in a barn with a chain saw.

Most growers say prairie is a nuisance that can choke crops. But not Smith. He is proud of the three acres he planted in the middle of one of the most productive farms in the county. He was there to show it off, not spray it.

This affection for prairie bucks a farming tradition that dates back to when settlers arrived in the Midwest to farm centuries ago and ripped out wild grasses to tame the earth. Over time, prairie was nearly eradicated. Farmers today are still destroying the little that is left.  

It is a colossal mistake, according to recent studies by researchers at Iowa State University. Not only does prairie, with its deep-rooted plants, soak up farm wastewater that pollutes rivers, it also enriches soil.

“The reason why we have the best soil, making it possible to have the world’s best food production, is prairie,” said Lisa Schulte Moore, an Iowa State professor known around the state as the prairie guru. “And we’re killing it.”

Now Schulte Moore and a team of 50 researchers are pushing for a resurrection and spreading a message: Wild prairie could help the state’s agriculture industry. It could slow soil erosion that costs farmers more than a billion dollars per year in lost yield and lower water pollution from fertilizers and chemicals – pollution that triggered a lawsuit by Des Moines against three farm counties upstream.

Prairie, together with other conservation practices already on farms, advocates claim, has the potential to reduce the massive runoff of nutrient pollution mostly from Midwestern farms that flows down the Mississippi River and forms a gigantic “dead zone” in the Gulf of Mexico every summer. In past years, this dead zone has suffocated marine life in an area the size of Connecticut and Rhode Island combined.

Some agriculture officials and city leaders believe lawsuits will not stop with Des Moines if gulf cities and states continue to lose fish harvests and tourist dollars to damage from the dead zone.

Iowa joined several Midwestern states in an effort to cut the region’s contribution to gulf pollution nearly in half, but participation is voluntary in Iowa, and conservation efforts are lagging.

A promising response, but hesi­ta­tion lingers

When Smith stepped off the edge of a soybean field into his prairie strip, he literally took a walk on the wild side.  Bees landed and took flight from his sweaty forearms. A chorus of dickcissel birds sang as blackbirds dipped, dived and screeched at humans strolling dangerously close to their nests. Butterflies flapped technicolored wings as they darted between plants.

Prairie serves as habitat for hundreds of species. Its milkweed feeds monarch butterflies, which make an epic migration through the United States from Mexico to Canada every year. Monarch populations have dropped dramatically because of insecticides and loss of habitat.

Providing wildlife habitat for birds and animals on the decline is one of the driving forces behind a program called STRIPS – Science-based Trials of Rowcrops Integrated with Prairie Strips. Smith said he planted his prairie two years ago because he strongly believed in that philosophy.  What STRIPS proposes is so new “and so innovative,” said Schulte Moore, one of the project’s leaders, that the entire conservation service is not on board. In Washington, officials are watching with interest. But in the counties, some farm advisers roll their eyes.

Schulte Moore is hopeful that this is changing. When STRIPS promoted the benefits of prairie to farmers a few years ago, “they looked at us like we were crazy,” she said. But when they produced research from an experimental chunk of prairie planted in a wildlife refuge, farmers such as Smith started to see that it could stop erosion and runoff.

In 2012, when the project was new, only one farmer signed up to plant prairie. Over the next three years, 26 planted it. Last year, 120 farmers who attended the project’s field presentations said in surveys that they intend to plant a total of 400 acres.

“We were like, ‘Wow, that’s a lot,’ ” Schulte Moore said. It was far too many acres to handle for a program struggling to survive on a paltry federal research grant. Schulte Moore spends most of her day asking for money.  But the response mattered. “People who don’t work with farmers view them as curmudgeons,” Schulte Moore said. “But they’re savvy and very data oriented. They get it.”  Schulte Moore said she understands why many farmers are hesitant. “Two hundred years ago, farmers plowed up the prairie because they didn’t consider it valuable . . . or couldn’t eat it. Now we’re asking them to plant it.”

Smith’s prairie acres were laid on a slope leading to Eagle Creek, which runs 90 miles to Des Moines. When rain soaks the field, the deep-rooted prairie “slows it down,” Smith said, and allows the earth to absorb it.

Tests show that the nitrate level in water from Smith’s farm is substantially lower than water in the creek, Schulte Moore said.

That has not swayed some reluctant farmers. Nearly 200 miles south of Smith’s farm, Steve Berger said over and over that he was excited about the idea of planting prairie on his 3,000 acres.

And yet, while mulling the idea for months, he has not planted a single acre.

Every other conservation method has a place on his farm: cover crops of oats or rye to soak up nitrogen, terraces that block water erosion and buffer strips that slow water running off the edge of farms.

But Berger, whose farming knowledge is respected throughout the Midwest, is hesitant about prairie strips. “It’s not easy to do this, and if you set a farmer up for failure, they won’t come back and do it again.”

Berger’s farm is an ocean of green soy and corn that undulate like waves when winds blow. Its profit margin is high. He said he needs more time to plan.

“My days and hours are scheduled right now, and when you talk about prairie strips, I’ve got to make time for it,” he said.

How much time do Iowa farmers have?

Iowa’s soil is eroding at an alarming rate. Topsoil was an average of 14 inches deep statewide in the mid-1800s; now it’s about six, Iowa State researcher Rick Cruse estimated in studies.  “Can we keep going this way for another 150 years? I don’t think so,” Smith said.

Iowa farmers lose about $40 per acre to soil erosion in a state where more than 85 percent of the land is covered by crops. “If you look at those figures and the amount of corn acres in Iowa, you quickly surpass a billion dollars of annual lost revenue,” Cruse said. Nearly a third of topsoil is lost in ephemeral gullies, swaths carved into farms by heavy rain. Since most prairie plants are perennial, they physically stabilize the soil most of the year.

Public opinion could turn against farmers long before the soil is gone.

Angered by nitrate pollution in two rivers that supply its drinking water, Des Moines Water Works sued three county boards of supervisors upstream for failing to regulate farm pollution that the agency pays $1 million per year to remove.

Des Moines Water Works is planning to build an $80 million facility within the next five years to manage an expected increase in nitrate pollution.

“We view it as a violation of the Clean Water Act,” Bill Stowe, the utility’s chief executive and general manager, said. Some experts estimate that nitrates in Des Moines’s water sources will spike substantially above what the Environmental Protection Agency allows.

The lawsuit has pitted Des Moines against a state that favors farmers and agriculture. Cedar Rapids Mayor Ron Corbett spoke out against it, saying, “When you file a lawsuit, that draws lines in the sand. The emotions make people harder and can develop resentment.”

Corbett said he worries that litigation could allow courts to decide how Iowans should farm or open the door to stronger federal regulation.

“If we don’t want judges deciding from the bench water policy for Iowa, and we really don’t want the EPA coming in and telling farmers what to do, the best way is to take the initiative on ourselves,” Corbett said.

For Cedar Rapids, the first step was to place several acres of prairie strip amid its corn and soy farm at the local airport, a demonstration project meant to show farmers that prairie can work. “Leading by example,” Corbett said.

Midwest states have to take responsibility for the pollution they produce, he said. “No one’s disputing that there is a dead zone in the Gulf of Mexico, and no one is disputing that years and years of phosphorous have made their way down the rivers of the Midwest,” he said.

Corbett admits he’s slightly biased. His city processes thousands of bushels of corn and is home to one of the world’s largest ethanol plants, creating hundreds of jobs and providing millions of tax dollars. He said he sympathizes with Des Moines Water Works, but the state needs to work together to solve pollution.

Stowe, the water agency manager, said outreach efforts failed. “We’re not looking for sympathy,” he said. “We’re looking for results.”

Posted in Farming & Ranching, Peak Topsoil | Tagged , , , | Comments Off on Plant more prairies to save topsoil and prevent pollution runoff

Climate change may corrode concrete even faster

[ I’ve paraphrased and shortened this article about how climate change will corrode concrete faster in the future from increasing carbon dioxide levels, and in coastal cities, from the chloride ions in sea spray. After that is the introduction section of the scientific article this Boston Globe story is based on.

Related articles:

Alice Friedemann   www.energyskeptic.com  author of “When Trucks Stop Running: Energy and the Future of Transportation”, 2015, Springer and “Crunch! Whole Grain Artisan Chips and Crackers”. Podcasts:  KunstlerCast 253, KunstlerCast278, Peak Prosperity]

Hartnett, K. October 12, 2014. For concrete, climate change may mean a shorter lifespan. Two Northeastern engineers warn that a key building material is less solid than we think. Boston Globe.

Most Bostonian’s imagine rising sea levels as the worst threat from climate change.

But Northeastern University researchers civil engineer Matthew Eckelman and graduate student Mithun Saha say the largest vulnerability may be collapsing concrete, because rising temperatures from climate change accelerate the rate of decay.

This happens because reinforced concrete is susceptible to corrosion and decay as water gets through cracks and corrodes the metal rebar inside.  This is why our infrastructure is vulnerable even though there are concrete structures from the Roman Empire still standing – they didn’t use rebar to reinforce the concrete to prevent it from breaking easily of stretched or pulled.

By 2025 the first concrete coverings on buildings may start to fail, sooner than that if they weren’t built to code. By 2050 60% of Boston’s concrete buildings will be structurally deteriorating. Roads, buildings, bridges, and parking garages will eventually collapse.

Of Boston’s 1,700 concrete buildings about 57% were built in the 1960s, when it was still thought of as indestructible, until the 1980s and 90s when corrosion began. These early buildings also used weaker concrete than we have today.

The ocean’s chloride-rich salt spray makes matters worse as chloride ions penetrate the concrete, and carbon dioxide is also a problem as well, which will increase as temperatures rise. This means that structural trouble may arrive 25 years sooner than if temperatures remained the same as in the past, with structural problems in buildings in just 50 to 60 years.

The issue won’t be concrete landing on people below, but expensive repairs and higher costs for new buildings.

Fixes are expensive, such as thicker concrete, spraying rebar with green epoxy, or replacing steel rebar with aluminum bronze or carbon fiber.

Saha, M., Eckelman, M. September 2014. Urban scale mapping of concrete degradation from projected climate change. Urban Climate 9.

Introduction

Understanding the implications of climatic variation has become a critical issue for infrastructure maintenance planning. The Earth’s average temperature has been increased by 0.6 °C since the 1900s and is expected to increase by approximately 1.4–5.8 °C by the end of this century (McMichael et al., 2006). Many of the effects of climate change, including changes in temperature, pollutant concentrations, relative humidity, precipitation, and wind patterns, as well as increased frequency of severe events could have significant impacts on the operations and lifespan of critical and non-critical infra- structure (Rosenzweig et al., 2011). Infrastructure capacity could be acutely overwhelmed (e.g., sea walls failing due to storm surge) or degraded gradually. Assessing the potential impacts of climate change on the built environment is difficult, as the relationship between material degradation and cli- mate is complex (Cole and Paterson, 2010). The Northeastern United States is likely to see an increase in extreme precipitation events as well as overall increases in temperature and relative humidity (Stocker et al., 2013)

Climate-induced damages to urban infrastructures are of particular concern. Urban areas in the United States currently include approximately 250 million residents, projected to grow to 365 million by 2050 (U.S Census Bureau, 2010). While the urban share of population and economic output in the US has grown in the past decades, much of the existing urban infrastructure has become increasingly susceptible to failures (Solecki and Marcotullio, 2013; Wilbanks, 2012). Aging buildings and transportation, energy, water, and sanitation infrastructure are all expected to become more stressed in their ability to support existing services for urban residents in the coming decades, especially when the impacts of climate change are added as stressors (McCrea et al., 2011). Climate change will also contribute directly to physical degradation of infrastructure and building materials (Nijland et al., 2009).

While much research on climate change impacts has focused on infrastructure susceptibility to extreme events and flooding from long-term sea level rise (Anderson and Boesch, 2009), relatively few studies have been carried out on the direct effects of climate change on the structural deterioration of infrastructure. One direct mechanism is acidic attack of cementitious materials. Concrete degradation due to acid rain has been extensively studied (Zivica and Bajza, 2001), and elevated levels of atmospheric CO 2 will increase the formation of carbonic acid in precipitation. Similarly, uptake of CO 2 by the oceans and the resulting decrease in pH will amplify degradation of structures in urban coastal areas that are exposed to seawater (Greaver et al., 2012).

Another mechanism for climate-induced concrete degradation is through early failure of the protective concrete cover over reinforcing steel, leading to corrosion and spalling, due to changes in CO 2 and temperature (Talukdar et al., 2012a; Mehta and Monteriro, 2006), which has only recently been analyzed. Yoon et al. (2007) was among the first to consider the effects of climate change on concrete performance and lifetime, in particular the effect on carbonation rates; however, this model does not account for the influence of temperature change, which can significantly affect the diffusion coefficient of CO 2 into concrete, the rate of reaction between CO 2 and Ca(OH) 2 , and the rate of dissolution of CO 2 and Ca(OH) 2 in pore water. The model is also a time-independent predictive model that assumes CO 2 concentrations to be constant up to a given time, thereby underestimating carbonation depths under changing atmospheric conditions (Stewart and Peng, 2010). Stewart et al. (2011) built on the work by Yoon et al. (2007) by taking into account the effect of temperature on the diffusion coefficient, but they did not consider the influence of temperature on the other aforementioned parameters. Their work looked not only at carbonation and chlorination, but also at the time to crack initiation, crack propagation, and failure due to reinforcement corrosion. Similar carbonation and chlorination models were used by Stewart et al. (2011) in their work, who noted that there is a need for an improved model that considers the time-dependent effect of CO 2 concentration and other parameters such as temperature and relative humidity.

Recently, Talukdar et al. (2012a) estimated carbonation (but not chlorination) penetration depths in concrete due to projected climate change. Several deterministic model parameters were experimentally verified using unloaded/undamaged concrete. They reported 25–35 mm increase in penetration depth due to carbonation alone. Separately, Bastidas-Arteaga et al. (2010) investigated the influence of global warming on chloride ingress into concrete using a stochastic model of chloride penetration and corrosion initiation. Their particular approach was to model future weather conditions, recognizing that temperatures will ?uctuate not only over the century, but also during a given year, and that the duration of the hot season throughout most of the world is expected to lengthen over this century. They found significant correlation between chloride ingress over time associated with projected global warming. Talukdar et al. (2012b) then improved their carbonation model and coupled it to the climate model proposed by Bastidas-Arteaga et al. (2010) to project concrete infrastructure degradation and to consider the suitability of current code requirements.

The current study builds on these previous reports by estimating climate-induced changes in cor- rosion depths for both carbonation and chloride induced corrosion for multiple climate scenarios and at a high level of geospatial resolution.

Posted in Bridges, Climate Change, Concrete, Dams, Roads | Tagged , , , | Comments Off on Climate change may corrode concrete even faster

Biggest threat to biodiversity is not climate change: it’s agriculture, fishing, and hunting

[ This article makes the point that other factors are far more to blame for biodiversity loss than climage change. And with “peak everything“, especially peak oil, but also peak coal, and peak natural gas — greenhouse gas emissions will start to go down several percent a year somewhere from now to 2025.

Alice Friedemann   www.energyskeptic.com  author of “When Trucks Stop Running: Energy and the Future of Transportation”, 2015, Springer and “Crunch! Whole Grain Artisan Chips and Crackers”]

Harvey, C. August 10, 2016. ‘Let’s get some perspective’: Researchers say species face bigger threats than climate change. Washington Post.

Excerpts

Tackling climate change is the challenge of the century. But when it comes to endangered wildlife, scientists are arguing that we’ve got more pressing matters to worry about. A new comment just out today in the journal Nature contends that practices like hunting, fishing and agriculture are still the biggest threats to biodiversity on Earth — and we need to be careful not to let our concern about climate change overshadow our efforts to address them.  

The group analyzed the threats facing more than 8,000 species on the IUCN’s Red List, a list of threatened animals, plants and other organisms all over the world. The IUCN classifies these organisms according to how severe their possibility of extinction is — categories include “critically endangered,” “endangered,” “vulnerable” and “near threatened.” Organisms facing the lowest possible risk of extinction are classified “least concern.”  Altogether, the Red List includes assessments for more than 80,000 different species.

After analyzing the threat information for these species, the authors found that exploitation and agriculture are the biggest drivers of declines in biodiversity. Of the threatened or near-threatened species they included, 72% faced challenges from hunting, fishing, and other practices that take organisms) and 62% were being threatened by the expansion of agriculture. The authors noted that climate change was affecting just 19% of threatened or near-threatened species.  

In the comment, the authors suggest there’s an increasing tendency to focus on climate change when discussing the challenges faced by biodiversity.

“When thinking about climate change, it became obvious to me that we’ve got to sort out the current problems first,” said James Watson, an associate professor at the University of Queensland, director of science and research at the Wildlife Conservation Society and one of the comment’s authors. “Climate change is going to be a problem, but it’s not the greatest problem now.”

Funding for conservation efforts is limited, Watson said, and a lot of it is currently being poured into the fight against “novel threats,” such as climate change or emerging diseases. While he feels these threats are important, he also suggested that there’s been less funding going back into the fight against the “old foes” — exploitation and agricultural development.

But there’s a chance to get things back on track coming up next month, the authors have noted. In September, the IUCN World Conservation Congress is scheduled to convene in Hawaii to discuss future priorities for global conservation efforts. Watson said he hopes the Congress would take the opportunity to identify the areas of greatest immediate concern and focus less on “the new kid in town, which is climate change.”

“If you solve threats like agricultural expansion in bad places, if you solve overexploitation, that is the best way to solve the climate change problem as well,” he said. “You give ecosystems a chance, you make them more resilient to climate change.”

For the time being, he said, the biggest priorities should include establishing more protected areas and creating better incentives for more sustainable land use, hunting and fishing.

“Climate change is very important, there’s no doubt about it, but let’s get some perspective on what’s threatening biodiversity now,” Watson said. “If we do that, then we’re going to give biodiversity a chance in the long term when the climate does rapidly change.”

FISHERIES

Jacobs, A. April 30, 2017. China’s Appetite Pushes Fisheries to the Brink. New York Times.

Excerpts:

Overfishing is depleting oceans across the globe, with 90% of the world’s fisheries fully exploited or facing collapse, according to the United Nations Food and Agriculture Organization. From Russian king crab fishermen in the west Bering Sea to Mexican ships that poach red snapper off the coast of Florida, unsustainable fishing practices threaten the well-being of millions of people in the developing world who depend on the sea for income and food, experts say.

Having depleted the seas close to home, Chinese fishermen are sailing farther to exploit the waters of other countries, their journeys often subsidized by a government.

“Having depleted the seas close to home, Chinese fishermen are sailing farther to exploit the waters of other countries, their journeys often subsidized by a government more concerned with domestic unemployment and food security than the health of the world’s oceans and the countries that depend on them.”

“China’s distant water fishing fleet has grown to nearly 2,600 vessels (the United States has fewer than one-tenth as many), with 400 boats coming into service between 2014 and 2016 alone. Most of the Chinese ships are so large that they scoop up as many fish in one week as Senegalese boats catch in a year, costing West-African economies $2 billion a year, according to a new study published by the journal Frontiers in Marine Science. ”

“Many of the Chinese boat owners rely on government money to build vessels and fuel their journeys to Senegal, a month long trip from crowded ports in China. Over all, government subsidies to the fishing industry reached nearly $22 billion between 2011 and 2015, nearly triple the amount spent during the previous four years, according to Zhang Hongzhou, a research fellow at Nanyang Technological University in Singapore.”

Increasingly, China’s growing armada of distant-water fishing vessels is heading to the waters of West Africa, drawn by corruption and weak enforcement by local governments. West Africa, experts say, now provides the vast majority of the fish caught by China’s distant-water fleet. And by some estimates, as many as two-thirds of those boats engage in fishing that contravenes international or national laws.

“The truth is, traditional fishing grounds in Chinese waters exist in name only,” said Mr. Zhang of Nanyang University. “For China’s leaders, ensuring a steady supply of aquatic products is not just about good economics but social stability and political legitimacy.”

For Beijing, the nation’s fleet of fishing vessels has helped assert its territorial ambitions in the South China Sea. In Hainan Province, the government encourages boat owners to fish in and around the Spratlys, the archipelago claimed by the Philippines, and the Paracel Islands, which Vietnam considers its own.

Across the Philippine province of Palawan, the impact is reflected in the rows of idled outriggers and the clouds of smoke drifting across freshly denuded hillsides.  Unable to live off the sea, desperate fishermen have been burning protected coastal jungle to make way for rice fields. But heavy rain often washes away the topsoil, environmentalists say, rendering the steep land useless.

For Senegal, which stretches along the Atlantic for more than 300 miles, the ocean is the economic lifeblood and a part of the national identity. Seafood is the main export, and fishing-related industries employ nearly 20 percent of the work force, according to the World Bank.

Despite declining fish stocks, unrelenting drought linked to climate change has driven millions of rural Senegalese to the coast, increasing the nation’s dependence on the sea.  With two-thirds of the population under 18, the strain has helped fuel the surge of young Senegalese trying to reach Europe. “Foreigners complain about Africa migrants coming to their countries, but they have no problem coming to our waters and stealing all our fish,” said Moustapha Balde, 22, whose teenage cousin drowned after his boat sank in the Mediterranean.


Posted in Biodiversity Loss, Fisheries | Tagged , , , | Comments Off on Biggest threat to biodiversity is not climate change: it’s agriculture, fishing, and hunting

The Peak Oil paradox revisited by Euan Mearns

Euan Mearns. July 16, 2016. The Peak Oil Paradox Revisited. theautomaticearth.com

Euan Mearns: Back in the mid-noughties the peak oil meme gained significant traction in part due to The Oil Drum blog where I played a prominent role. Sharply rising oil price, OPEC spare capacity falling below 2 Mbpd and the decline of the North Sea were definite signs of scarcity and many believed that peak oil was at hand and the world as we knew it was about to end. Forecasts of oil production crashing in the coming months were ten a penny. And yet between 2008, when the oil price peaked, and 2015, global crude+condensate+NGL (C+C+NGL) production has risen by 8.85 Mbpd to 91.67 Mbpd. That is by over 10%. Peak oilers need to admit they were wrong then. Or were they?

Introduction

It is useful to begin with a look at what peak oil was all about. This definition from Wikipedia is as good as any:

Peak oil, an event based on M. King Hubbert’s theory, is the point in time when the maximum rate of extraction of petroleum is reached, after which it is expected to enter terminal decline. Peak oil theory is based on the observed rise, peak, fall, and depletion of aggregate production rate in oil fields over time.

Those who engaged in the debate can be divided into two broad classes of individual: 1) those who wanted to try and understand oil resources, reserves, production and depletion rates based on a myriad of data sets and analysis techniques with a view to predicting when peak oil may occur and 2) those who speculated about the consequences of peak oil upon society. Such speculation normally warned of dire consequences of a world running short of transport fuel and affordable energy leading to resource wars and general mayhem. And none of this ever came to pass unless we want to link mayhem in Iraq*, Syria, Yemen, Sudan and Nigeria to high food prices and hence peak oil. In which case we may also want to link the European migrant crisis and Brexit to the same.

[* One needs to recall that GWI was precipitated over Kuwait stealing oil from Iraq, from a shared field on the Kuwait-Iraq border, leading to the Iraqi invasion of 1991.]

The peak oil debate on The Oil Drum was a lightning conductor for doomers of every flavour – peak oil doom (broadened to resource depletion doom), economic doom and environmental doom being the three main courses on the menu. The discussion was eventually hijacked by Greens and Green thinkers, who, not content with waiting for doomsday to happen, set about manufacturing arguments and data to hasten the day. For example, fossil fuel scarcity has morphed into stranded fossil fuel reserves that cannot be burned because of the CO2 produced, accompanied by recommendations to divest fossil fuel companies from public portfolios. Somewhat surprisingly, these ideas have gained traction in The United Nations, The European Union and Academia.

It is not my intention to dig too deeply into the past. Firmly belonging to the group of data analysts, in this post I want to take a look at two different data sets to explore where peak oil stands today. Is it dead and buried forever, or is it lurking in the shadows, waiting to derail the global economy again?

The USA and Hubbert’s Peak

The USA once was the poster child of peak oil. The Peak Oil theory was first formulated there by M. King Hubbert who in 1956 famously forecast that US production would peak around 1970 and thereafter enter an era of never-ending decline (Figure 1). Hubbert’s original paper is well worth a read.

Figure 1 From Hubbert’s 1956 paper shows the peak and fall in US production for ultimate recovery of 150 and 200 billion barrels. The 200 billion barrel model shows a peak of 8.2 Mbpd around 1970 that proved to be uncannily accurate.

Looking to Figure 2 we see that Hubbert’s prediction almost came true. US production did indeed peak in 1970 at 9.64 Mbpd while Hubbert’s forecast was a little lower at 8.2 Mbpd. The post-peak decline was interrupted by the discovery of oil on the N slope of Alaska and opening of the Aleyska pipeline in 1977 that was not considered in Hubbert’s work. Herein lies one of the key weaknesses of using Hubbert’s methodology. One needs to take into account known unknowns. We know for sure that unexpected discoveries and unexpected technology developments will occur, it’s just we don’t know, what, when and how big.

Figure 2 In red, US crude oil production from the EIA shows progressive growth from 1900 to 1970. The oil industry believed this growth would continue forever and was somewhat aghast when M. King Hubbert warned the party may end in 1970 which it duly did. The discovery of oil in Alaska created a shoulder on the decline curve. But apart from that, Hubbert’s forecast remained good until 2008 when the shale drillers and frackers went to work. Hubbert’s 1970 peak was matched by crude oil in 2015 and exceeded by C+C+NGL that same year.

Following the secondary Alaska peak of 8.97 Mbpd (crude oil) in 1985, production continued to decline and reached a low of 5 Mbpd (crude oil) in 2008. But since then, the rest is history. The shale drillers and frackers went to work producing an astonishing turnaround that most peak oil commentators, including me, would never have dreamt was possible.

Before going on to contemplate the consequences of the shale revolution, I want to dwell for a moment on the production and drilling activity in the period 1955 to 1990. 1955 to 1970 we see that total rigs* declined from 2683 to 1027. At the same time crude oil production grew from 6.8 to 9.6 Mbpd. It was in 1956 that Hubbert made his forecast and in the years that followed, US production grew by 41% while drilling rigs declined by 62%. No wonder the industry scoffed at Hubbert.

[* Note that Baker Hughes’ archive pre-1987 does not break out oil and gas rigs from the total.]

But then post 1970, as production went into reverse, the drilling industry went into top gear, with operational rigs rising sharply to a peak of 3974 in 1981. But to no avail, production in the contiguous 48 states (excluding Alaska) continued to plunge no matter how hard the oil and its drilling industry tried to avert it. Hubbert must surely have been proven right, and his methodology must surely be applicable not only to the US but to the World stage?

The oil price crash of 1981 put paid to the drilling frenzy with rig count returning to the sub-1000 unit baseline where it would remain until the turn of the century. The bear market in oil ended in 1998 and by the year 2000, the US drilling industry went back to work, drilling conventional vertical wells at first but with horizontal drilling of shale kicking in around 2004/05. Production would turn around in 2009.

Those who would speak out against peak oil in the mid-noughties, like Daniel Yergin and Mike Lynch, would argue that high price would result in greater drilling activity and technical innovation that would drive production to whatever level society demanded. They would also point out that new oil provinces would be found, allowing the resource base to grow. And they too must surely have been proved to be correct.

But there is a sting in the tail of this success story since drilling and producing from shale is expensive, it is dependent upon high price to succeed. But over-production of LTO has led to the price collapse, starving the shale drilling industry of cash flow and ability to borrow, leading to widespread bankruptcy. In fact informed commentators like Art Berman and Rune Likvern have long maintained that the shale industry has never turned a profit and has survived via a rising mountain of never ending debt. Economists will argue, however, that improved technology and efficiency will reduce costs and make shale competitive with other sources of oil and energy. We shall see.

Herein lies a serious conundrum for the oil industry and OECD economies. They may be able to run on shale oil (and gas) for a while at least, but the industry cannot function properly within current market conditions. Either prices need to be set at a level where a profit can be made, or production capped to protect price and market share. This of course would stifle innovation and is not likely to happen until there are queues at gas stations.

2008-2015 Winners and Losers

BP report oil production data for 54 countries / areas including 5 “other” categories that make up the balance of small producers in any region. I have deducted 2008 production (barrels per day) from 2015 production and sorted the data on the size of this difference. The data are plotted in Figure 3.

Figure 3 The oil production winners to the left and losers to the right, 2008 to 2015. The USA is the clear winner while Libya is the clear loser. About half of the countries show very little change. Click chart for a large readable version.

What we see is that production increased in 27 countries and decreased in the other 27 countries. One thing we can say is that despite prolonged record-high oil price, production still fell in half of the world’s producing countries. We can also see that in about half of these countries any rise or fall was barely significant and it is only in a handful of countries at either end of the spectrum where significant gains and losses were registered. Let’s take a closer look at these.

Figure 4 The top ten winners, 2008 to 2015.

The first thing to observe from Figure 4 is that the USA and Canada combined contributed 7.096 Mbpd of the 8.852 Mbpd gain 2008-2015. That is to say that unconventional light tight oil (LTO) production from the USA and LTO plus tar sands production from Canada make up 80% of the global gain in oil production (C+C+NGL). Iraq returning to market in the aftermath of the 2003 war makes up 18%. In other words expensive unconventional oil + Iraq makes up virtually all of the gains although concise allocation of gains and losses is rather more complex than that. Saudi Arabia, Russia, The UAE, Brazil, China, Qatar and Colombia have all registered real gains (5.258 Mbpd) that have been partly cancelled by production losses elsewhere.

Figure 5 The top ten losers, 2008 to 2015.

Looking to the losers (Figure 5) we see that Libya, Iran, Syria, Sudan and Yemen contribute 2.828 Mbpd of lost production that may be attributed to war, civil unrest or sanctions. I am not going to include Venezuela and Algeria with this group and will instead attribute declines in these countries (0.979 Mbpd) to natural reservoir depletion, although a slow down in OECD technical assistance in these countries may have exacerbated this situation. That leaves the UK, Mexico and Norway as the three large OECD producers that register a significant decline (1.687 Mbpd) attributed to natural declines in mature offshore provinces. Let me try to summarise these trends in a balance sheet:

Figure 6 The winner and loser balance sheet.

We see that these 20 countries account for 8.463 Mbpd net gain compared with the global figure of 8.85 Mbpd. We are capturing the bulk of the data and the main trends. In summary:

  • Unconventional LTO and tar sands + 7.096 Mbpd
  • Net conventional gains + 2.592 Mbpd
  • Net conflict losses -1.225 Mbpd

The sobering point here for the oil industry and society to grasp is that during 8 years when the oil price was mainly over $100/bbl, only 2.592 Mbpd of conventional production was added. That is about 3.1%. Global conventional oil production was all but static. And the question to ask now is what will happen in the aftermath of the oil price crash?

One lesson from recent history is that the oil industry and oil production had substantial momentum. It is nearly two years since the price crash, and while global production is now falling slowly it remains in surplus compared with demand. This has given the industry plenty time to cut staff, drilling activity and to delay or cancel projects that depend upon high price. In a post-mature province like the North Sea, the current crisis will also hasten decommissioning. It seems highly likely that momentum on the down leg will be replaced by inertia on the up leg with a diminished industry unwilling to jump back on the band wagon when price finally climbs back towards $100 / bbl, which it surely will do one day in the not too distant future.

For many years I pinned my colours to peak oil occurring in the window 2012±3 years. Noting that the near-term peak was 97.08 Mbpd on July 15 2015 it is time to dust off that opinion (Figure 7). The decline since the July 2015 peak is of the order 2% per annum (excluding the Fort McMurray impact). It seems reasonable to presume that this decline may continue for another two years, or even longer. That would leave global production at around 92 Mbpd mid 2018. It is nigh impossible to predict what will happen, especially in a world over run by political and economic uncertainty. Another major spike in oil price seems plausible and this could perhaps destabilise certain economies, banks and currencies. Should this occur, another price collapse will follow, and it’s not clear that production will ever recover to the July 2015 peak. Much will depend upon the future of the US shale industry and whether or not drilling for shale oil and gas gains traction in other countries.

Figure 7 The chart shows in blue global total liquids production (C+C+NGL+refinery gains+biofuels) according to the Energy Information Agency (EIA). The near term peak was 97.08 Mbpd in July 2015. The decline since then, excluding the Fort McMurray wild fire impact, is of the order 2% per annum. In the current low price environment, it is difficult to see anything arresting this decline before the end of next year. In fact, decline may accelerate and go on beyond the end of 2017. The dashed line shows the demand trajectory and scheduled balancing of supply and demand by the end of this year. By the end of next year the supply deficit could be of the order 3 Mbpd which on an annualised basis would result in a stock draw of 1.1 billion barrels. But remember, forecasts are ten a penny 🙂

Concluding Thoughts

  1. M. King Hubbert’s forecast for US oil production and the methodology it was based on has been proven to be sound when applied to conventional oil pools in the USA. When decline takes hold in any basin or province, it is extremely difficult to reverse even with a period of sustained high price and the best seismic imaging and drilling technology in the world.
  2. On this basis we can surmise that global conventional oil production will peak one day with unpredictable consequences for the global economy and humanity. It is just possible that the near term peak in production of 97.08 Mbpd in July 2015 may turn out to be the all-time high.
  3. Economists who argued that scarcity would lead to higher price that in turn would lead to higher drilling activity and innovation have also been proven to be correct. Much will depend upon Man’s ability to continue to innovate and to reduce the cost of drilling for LTO in order to turn a profit at today’s price levels. If the shale industry is unable to turn a profit then it will surely perish without State intervention in the market.
  4. But from 2008 to 2015, oil production actually fell in 27 of 54 countries despite record high price. Thus, while peak oil critics have been proven right in North America they have been proven wrong in half of the World’s producing countries.
  5. Should the shale industry perish, then it becomes highly likely that Mankind will face severe liquid fuel shortages in the years ahead. The future will then depend upon substitution and our ability to innovate within other areas of the energy sector.

Related reading

From Rune Likvern

The Bakken LTO extraction in Retrospect and a Forecast of Near Future Developments

Bakken(ND) Light Tight Oil Update with Sep 15 NDIC Data

Are the Light Tight Oil (LTO) Companies trying to outsmart Mother Nature with their Financial Balance Sheets?

From Enno Peters:

Visualizing US shale oil production

Posted in How Much Left, Other Experts, Peak Oil | Tagged , | Comments Off on The Peak Oil paradox revisited by Euan Mearns

Art Berman: Oil Prices Lower Forever? Hard Times In A Failing Global Economy

Art Berman. July 15, 2016. Oil Prices Lower Forever? Hard Times In A Failing Global Economy. Forbes.

A pumpjack sits on the outskirts of town at dawn in the Permian Basin oil field on January 21 in the oil town of Midland, Texas. (Photo by Spencer Platt/Getty Images)

Two years into the global oil-price collapse, it seems unlikely that prices will return to sustained levels above $70 per barrel any time soon or perhaps, ever. That is because the global economy is exhausted.

The current oil-price rally is over, as I predicted several months ago, and prices are heading toward $40 per barrel.

Oil has been re-valued to affordable levels based on the real value of money. The market now accepts the erroneous producer claims of profitability below the cost of production and has adjusted expectations accordingly. Be careful of what you ask for.

Meanwhile, a global uprising is unfolding.

The U.K. vote to exit the European Union is part of it.  So is the Trump presidential candidacy in the U.S. and the re-run of the presidential election in Austria. Radical Islam and the Arab Spring were precursors. People want to throw out the elites who led the world into such a mess while assuring them that everything was fine.

The uprising seems to be about immigration and borders but it’s really about hard times in a failing global economy. Debt and the cost of energy are the pillars that underlie that failure and the resulting discontent. Immigrants and infidels are scapegoats invented by demagogues.

Energy Is The Economy

Energy is the economy. Energy resources are the reserve account behind currency. The economy can grow as long as there is surplus affordable energy in that account. The economy stops growing when the cost of energy production becomes unaffordable. It is irrelevant that oil companies can make a profit at unaffordable prices.

The oil-price collapse that began in July 2014 followed the longest period of unaffordable oil prices in history. Monthly oil prices (in 2016 dollars) were above $90 per barrel for 48 months from November 2010 through September 2014 (Figure 1).

Oil Prices in 2016 Dollars, 1950-2016

Figure 1. Oil Prices in 2016 Dollars, 1950-2016. Source: EIA, Federal Reserve Bank of St. Louis and Labyrinth Consulting Services, Inc.

That was more than 3.5 times longer than the period from September 2007 through September 2008 just before the Financial Collapse. It was almost twice as long as the period from September 1979 through November 1981 that preceded the longest oil-price collapse in history.

There is nothing magic about $90 per barrel but major economic dislocations have occurred following periods above that level. Few economists or world leaders seem to understand this or include the cost of energy in their models and policies.

There is a clear correlation between oil price and U.S. GDP (Gross Domestic Product) when both are normalized in real current dollar values (Figure 2). Periods of low or falling oil prices correspond to periods of increasing GDP and periods of high or rising prices coincide with periods of flat GDP.

CPI-Adjusted US GDP + Trendline & WTI October 2015_150

Figure 2. U.S. GDP and WTI Oil Price. Source: U.S. Bureau of Labor Statistics, The World Bank, EIA and Labyrinth Consulting Services, Inc.

Economic growth is complex and some will object to this correlation. Fine. But energy is also complex. Most people think about it as an independent topic or area of our lives. Like business, politics, economics, education, agriculture, and manufacturing, there is energy. This is understandable but wrong.

Energy underlies and connects everything. We need energy to make things, transport and sell things and to transport ourselves so that we can work and spend. We need it to run our computers, our homes and our businesses. It takes energy to heat, cool, cook and communicate. In fact, it is impossible to think of anything in our lives that does not rely on energy.

When energy costs are low, the costs of doing business are correspondingly low. When energy prices are high, it is difficult to make a profit because the underlying costs of manufacture and distribution are high. This is particularly true in a global economy that requires substantial transport of raw materials, goods and services.

The global economy expanded in the mid-1980s through 1990s when oil prices averaged $33 per barrel. Then, oil prices nearly doubled to an average of $68 per barrel from 1998 to 2008, and subsequently increased after 2008 to 2.5 times more than in the 1990s. When oil prices exceed $90 per barrel, the global economy is no longer profitable.

America’s Golden Age

The United States experienced a golden age of economic growth and prosperity during the 25 years following World War II. This period forms the basis for U.S. and indeed global expectations that growth is the norm and that recessions and slow growth are aberrations that result from mis-management of the economy. This is the America that today’s populists want to return to.

The Golden Age, however, was a singular phenomenon that is unlikely to recur. After 1945, the economies and militaries of Europe and Japan were in ruins. The U.S. was the only major economy that survived the war intact.  Having no competition is a huge competitive advantage.

The U.S. was the first country to fully convert to petroleum, another competitive advantage. A barrel of oil contains about the same amount of energy as a human would expend in calories in 11 years of manual labor.  Crude oil contains more than twice as much energy as coal and two-and-a-half times more than wood. And it’s a liquid that can be moved easily around the world and put in vehicles for transport.

In 1950, the U.S. produced 52% of the crude oil in the world and was largely self-sufficient. Texas was the largest U.S. producing state and the Texas Railroad Commission (TXRRC) controlled the world price of oil through a system of allowable production that also ensured spare capacity.

Oil was cheap, the U.S. controlled its price and had a positive balance of payments.

Oil Shocks of the 1970s and 1980s

That began to change toward the end of the 1960s. A rebuilt Europe and Japan rose to challenge American commercial dominance and the costs of fighting the spread of communism–especially in Vietnam–weakened the American economy. In 1970, the U.S. economy went into recession and President Nixon took drastic steps including the end of backing the dollar with gold reserves. The rest of the countries that were part of the Bretton Woods Agreement did the same resulting in the largest global currency devaluation in history.

In November 1970, U.S. oil production peaked and began to decline. In March 1972 the TXRRC abandoned allowable rates. The United States no longer had any spare capacity. OPEC had long objected that oil prices were held artificially low by the U.S. Now OPEC had the clout to do something about it.

In October 1973, OPEC declared an oil embargo against Israel’s allies including the U.S. during the Yom Kippur War. This was really was just an excuse to adjust oil prices to the devalued Western currencies following the end of the Bretton Woods Agreement.

The price of oil more than doubled by the end of January 1974 from $22 to $52 per barrel (2016 dollars). When the Arab-Israeli conflict ended a few months later, oil prices did not fall.

Real oil prices more than doubled again in 1980 to $117 when Iran and Iraq began a war that took more than 6 million barrels off the market by 1981. The effect of these price hikes on the world economy was devastating. World demand for oil decreased by almost 10 million barrels per day and did not recover to 1979 levels until 1994 (Figure 3). Real prices did not recover to $40 until 2004 except for a brief excursion during the First Persian Gulf War in 1990.

OPEC-World Liquids Compared to 1979 July 2016

Figure 3. OPEC and world liquids production compared to 1979 and world oil prices. Source: BP and Labyrinth Consulting Services, Inc.

The Miracle of Reagan Economics: Low Oil Price
Ronald Reagan is remembered as a great U.S. president because the economy improved and the Soviet Union fell during his administration. Both of these phenomena were because of low oil prices.

After U.S. oil production peaked, imports increased 5-fold from 1.3 to 6.6 mmbpd from 1970 to 1977 (Figure 4).

U.S. Crude Oil Production, Imports and Oil Price in 2016 Dollars

Figure 4. U.S. crude oil production, imports and oil price in 2016 dollars. Source: EIA, Federal Reserve Bank of St. Louis and Labyrinth Consulting Services, Inc.

When oil prices rose to nearly $110 per barrel during the Iran-Iraq War, the U.S. went into recession from mid-1981 through 1982. Oil consumption fell more than 3 million barrels per day. Production from Prudhoe Bay began in 1977 and somewhat dampened the overseas outflow of capital but it did not help consumers with price.

Federal Reserve Chairman Paul Volker raised interest rates to more than 16% by 1981 to bring the inflation caused by higher oil prices under control (Figure 5). This worsened the economic hardship for Americans in the short term but also became the foundation of the Reagan economic revival.

U.S. Public Debt 1950-2016

Figure 5. U.S. public and consumer debt and interest rates. Source: U.S. Treasury, U.S. Federal Reserve Banks and Labyrinth Consulting Services, Inc.

Much of the developing world had survived the oil shocks of the 1970s by borrowing from U.S. commercial banks. Higher U.S. interest rates put those countries into recession and that helped keep oil demand and prices low. By 1985, oil prices had fallen below $40 per barrel and would not rise above that level again until 2005.

Volker found an opportunity in the demand destruction from oil shocks. By raising U.S. interest rates, he managed to roll back oil prices almost to levels before the 1973 oil embargo and created a great economic boon for the U.S.

“He [Volker] used the strategic price that America continued to control—namely, world interest rate—as a weapon against the price of the strategic commodity that America no longer controlled, which was oil.”
James Kenneth Galbraith*

High interest rates attracted investment. Along with low oil prices, a strong dollar, tax cuts and increased military spending, Volker and Reagan restored growth to the U.S. economy. By 1991, the Soviet Union collapsed under the strain of low oil prices, debt, and military spending.

Things Fall Apart; The Center Cannot Hold

Treasury bonds became the effective reserve asset of the world. The U.S. put economic growth on a credit card that it never planned to pay off. Public debt increased almost 6-fold from the beginning of Reagan’s administration ($1 trillion) in 1981 to the end of Clinton’s ($6 trillion) in 2000 (Figure 5). By the end of Bush’s presidency in 2008, debt had reached $10 trillion. It is now more than $18 trillion.

The 1990s were the longest period of economic growth in American history. There are, of course, limits to growth based on debt but the new economy seemed to be working as long as oil prices stayed low. Then, Prudhoe Bay peaked in 1985. Total U.S. production declined, and imports increased sharply as the economy improved (Figure 4). Similarly, the world economy slowly recovered after 1985 with lower oil prices.

Consumer credit expanded under President Clinton through mortgage debt. Manufacturing had been progressively outsourced to Latin American and Asia, and the evolving service economy was underwritten by consumer debt that increased 7-fold from less than $0.5 trillion in 1981 to $2.6 trillion in 2008 (Figure 5).

The “dot.com” market collapse in 2000 and the September 11, 2001 terror attacks pushed the U.S. economy into recession and the Federal Reserve reduced interest rates below 2%, the lowest levels in U.S. history to date. Mortgage financing boomed.

The 1993 repeal of The Glass-Steagall Act allowed banks to package mortgage debt into complex, high-risk securities (CDOs or collateralized debt obligations). In what can only be described as out-of control speculative greed and institutional fraud, CDOs, synthetic CDOs that bet on the outcome of CDO bets, and the credit default swaps that bet against both propelled the economy to levels of leverage and instability not seen since the 1920s.

“This was the new new world order: better living through financialization.”
–James Kenneth Galbraith**

From 2004 through 2008, world liquids production reached a plateau around 86 million barrels per day (Figure 5). Increased demand from China and other developing economies pushed oil prices higher as traders and investors worried that Peak Oil had perhaps arrived.

World Liquids Production and Oil Price in 2016 Dollars

Figure 6. World liquids production and oil price in 2016 dollars. Source: EIA June 2016 STEO and Labyrinth Consulting Services, Inc.

Oil prices soared to more than $140 per barrel and interest rates rose above 5%. The adjustable interest rates that underlaid much sub-prime debt also rose. Mortgage holders began to default and world financial markets collapsed in 2008.

The Second Coming

Debt and higher oil prices had spoiled the party. The problem was addressed with more debt and higher oil prices.

The Federal Reserve Bank brought interest rates to almost zero, created money and bought Treasury bonds while the government bailed out the banks and auto industry. OPEC cut production by 2.6 million barrels from December 2008 to March 2009 and oil prices recovered from $43 to $65 by May, and were more than $80 by year-end propelled by a weak dollar and easy credit.

Tight oil, deep water and oil sands projects that needed sustained high oil prices took off. Unconventional production in the U.S. and Canada increased 5 million barrels per day between January 2010 and October 2015 (Figure 7).

Incremental World Crude Oil + Condensate Production

Figure 7. Incremental world crude oil + lease condensate production. Source: EIA and Labyrinth Consulting Services, Inc. after Crude Oil Peak.

Tight oil used the same horizontal drilling and hydraulic fracturing technology that had been pioneered in earlier shale gas plays. The technology was expensive but once oil price topped $90 per barrel in late 2010 and stayed high for the next 4 years, the plays were deemed successful by producers and credit markets.

U.S. tight oil and deep-water production resulted in a second coming of sorts with monthly crude oil output reaching 9.69 million barrels per day in April 2015. That was 350,000 bopd less than the 1970 peak of  10.04 million bopd.

The difference of course was cost. In 1970, the market price of a barrel of oil in 2016 dollars was $20 per barrel versus $100 from 2011 to 2014, and $55 per barrel in 2015.

And this is precisely the problem with the almost universally held belief that technology will make all things possible, including making a finite resource like oil infinite. Technology has a cost that its evangelists forget to mention.

The reality is that technology allows us to extract tight oil from non-reservoir rock at almost 3 times the cost of high-quality reservoirs in the past. The truth is that we have no high-quality reservoirs left with sufficient reserves to move the needle on the high global appetite for oil. The consequence is that to keep consuming and producing as we always have will inevitably cost a lot more money. This is basic thermodynamics and not a pessimistic opinion about technology.

Nevertheless, in a zero-interest rate world, there was great enthusiasm for yields greater than conventional investments like U.S. Treasury bonds and savings accounts that continue to pay less than 2%.  Bank and mezzanine debt, high-yield corporate (“junk”) bonds and share offerings promised yields in the 6 to 10% range. As long as prices were high and the plays were marginally profitable, risks were downplayed and capital was almost unlimited. Two years into the oil-price collapse, capital is more limited because banks and investors have been burned.

Producers continue the mantra that costs keep going down and well performance keeps getting better. Those with some history and perspective, however, know and remember that they always say that but the balance sheets never reflect the claims.

In 1996, the late Aubrey McClendon made the following statement about the Louisiana Austin Chalk play:
“Today, because of improvements in horizontal drilling technology, you’ve got a play that could be the largest onshore play in the country, not only in size of potential reserves but also in a real extent.”

That play was a total failure for McClendon’s Chesapeake Energy Corporation and today Chesapeake is on the verge of bankruptcy for the second time.

People want to believe that things keep getting better and that they won’t have to change their behavior—even if these beliefs defy common sense and the laws of nature.

Slouching Toward Bethlehem

The oil-price collapse that began in July 2014 was technically about over-production. A surplus of unconventional oil from the United States and Canada, and a hiatus in geopolitical outages upset the world market balance and pushed prices lower.

Some have tried to emphasize the role that demand played. But there is simply no comparison to the 10 mmbpd demand destruction that occurred between 1979 and 1983 nor is this anything like the 2.6 mmbpd demand decline in 2008-2009.

This price collapse is simply different than the others. It more fundamental. The economy has been pushed beyond its limits.

Post-Financial Collapse monetary policies, the cumulative cost of nearly four decades of debt-financed growth, and the return of higher oil prices have exhausted the economy. Most debt is non-productive, interest rates cannot be increased, and 2016′s low oil prices are still one-third higher than in the 1990s (in 2016 dollars).

Producers and oil-field service companies are on life support. One-third of U.S. oil companies are in default.  Yet some analysts who have no experience working in the oil industry proclaim break-even prices below $40 per barrel and breathlessly predict that the business will come roaring back when prices exceed $50. Producers don’t help with outrageous claims of profitability at or below current oil prices that exclude costs and are not generally applicable to their portfolios.

As a result, the public and many policy makers believe that tight oil is a triumph of American ingenuity and that energy will be cheap and abundant going forward. The EIA forecasts that U.S. crude oil production will exceed the 1970 annual peak of 9.6 mmbpd by 2027 and that tight oil will account for almost 6 million barrels per day. Although I have great respect for EIA, these forecasts reflect a magical optimism based on what is technically possible rather than what is economically feasible.

Renewable energy will be increasingly part of the landscape but its enthusiasts are also magical thinkers.

In 2015, renewables accounted for only 3% of U.S. primary energy consumption. No matter the costs nor determination to convert from fossil to renewable energy, a transition of this magnitude is unlikely in less than decades.

Solar PV and wind provide much lower net energy than fossil fuels and have limited application for transport–the primary use of energy– without lengthy and costly equipment replacement. The daunting investment cost becomes critically problematic in a deteriorating economy.  Although proponents of renewable energy point to falling costs, more than half of all solar panels used in the U.S. are from China where cheap manufacturing is financed by unsustainable debt.

It is telling that energy and its cost can hardly be found among the endless discussions about the economy and its failure to grow. Technology optimists have disparaged the existence of an energy problem since at least the 1950s. Neither unconventional oil nor renewable energy offer satisfactory, reasonably priced, timely solutions to the dilemma.

As political leaders and economic experts debate peripheral issues, the public understands that there is something horribly wrong in the world. It is increasingly difficult for most people to get by in a failing global economy. That is why there are political upheavals going on in Britain, the United States and elsewhere.

The oil industry is damaged and higher prices won’t fix it because the economy cannot bear them. It is unlikely that sustained prices will reach $70 in the next few years and possibly, ever.

The British exit from the European Union adds another element of risk for investors. Lack of investment will inevitably lead to lower production, supply deficits and price spikes. These will further damage the economy.

The future for oil prices and the global economy is frightening. I don’t know what beast slouches toward Bethlehem but I am willing to bet that it does not include growth. The best path forward is to face the beast. Acknowledge the problem, stop looking for improbable solutions that allow us live like energy is still cheap, and find ways to live better with less.

—————————————————————————-

*J.K. Galbraith, 2014, The End of Normal, p.54. Much of the economic interpretation in this post is based on Galbraith’s work.
**J.K. Galbraith, 2014, The End of Normal, p.57.

Art Berman
Petroleum Geologist and Professional Speaker
Visit my website for more information:  artberman.com

Posted in How Much Left | Tagged | 5 Comments

Limits to Growth? 2016 United Nations report provides best evidence yet

Preface. This is a summary of a United Nations report that ought to scare the pants off of anyone who understands exponential growth. Here are a few examples what that means:

  1. If 2 grams of gold grew at a 5% compound rate for 2,000 years, it would grow to 800 trillion golden planet earths
  2. Donella Meadows, lead author of “Limits to Growth”, explored the concept of doubling. If you ate double the number of peanuts every day for a month, you’d be eating 500 tons the last day.
  3. Until the 1970s, oil consumption doubled every 10 years at a 7% growth rate per year. That means every 10 years, as much oil was used as all the oil previously consumed.  At that rate, even if the earth was a giant gas tank, oil would run out in 342 years.
  4. The UN study states population grew at a 1.6% compound rate from 1970 to 2010. So if  there were 15 million people 13,500 years ago, we’d have over a google of people now at a 1.6% compound rate.  A google has 100 zeros.

In order to accommodate an additional 2 billion people in 2050, material consumption will need to nearly triple to 180 billion tonnes of materials, almost three times today’s amount.  If 180 billion tonnes grows in the future at 5% compound rate, in 497 years the entire earth will be consumed, all 5.972 x 10²¹ tonnes of it, and we’ll be floating in outer space.

Newsflash: we’re up to 100.6 billion tonnes (BT) of consumption in 2019, with 50.8 BT of that minerals, 10.1 BT ores, 15.1 BT fossil fuels, 24.6 BT crops and trees (Carrington 2020).

I’m amazed we haven’t run out of stuff already.  Between 1970 and 2010, the global economy expanded more than 3-fold, population almost doubled from 3.7 to 6.9 billion, and global material extraction went from 22 billion to 70.1 billion tonnes. In 2010, 30 billion tonnes of materials extracted globally were required to produce 10 billion tonnes of directly traded goods. Half of the tons of traded material was oil. Compound growth rates of extraction were: Biomass 2%, fossil fuels 1.9%, metal ores 2.8%, and non-metallic minerals 4% per year. From 2000 to 2010 all materials except biomass accelerated their extraction growth rate: fossil fuels grew by 2.9%/year on average, metal ores 3.5%, and non-metallic minerals by 5.3%.

Those who deny limits to growth say we’ll miniaturize, use less material, and get more efficient.  This UN report states that in fact, the opposite is happening. Global material efficiency started to decline around 2000, so now the global economy needs more materials per unit of GDP than it did at the turn of the century. What may seem counter-intuitive has been caused by a large shift of economic activity from very material-efficient economies such as Japan, the Republic of Korea and Europe to the much less material-efficient economies of China, India and Southeast Asia.

We are growing less sustainable because there is a growing environmental pressure per unit of economic activity that works against the hypothesis of decoupling – achieving more with less – which is so important to the success of global sustainability.

Other organizations besides the UN recognized that we’re in trouble.  Earth overshoot day which is the date when humanity’s demand on nature for the year exceeds what Earth can regenerate annually.  Global Footprint Network estimated that humans would need the resources produced by just over one-and-half Earths to keep up with what we will use this year.  “We spend 1.62 times what Earth can renew,” said Wackernagel. “Like with money, you can dip into your inheritance or your savings for a time, but only a certain amount of time.”

Increasing material extraction increases the damage and pollution of our ecosystems:

  • The global economy, at today’s level of resource use, is already surpassing some planetary boundaries. Rising material use will result in climate change, higher levels of acidification and eutrophication of soils and water bodies, increased biodiversity loss, more soil erosion, increasing amounts of waste and air pollution, negative impacts on human health and quality of life, and ultimately lead to the depletion of certain natural resources causing supply shortages for critical materials in the short and medium terms.
  • Our world is built from materials. The food we eat, the buildings that house us, the vehicles in which we travel and the consumer goods that furnish our life, are all made of, embody and require for their operation massive quantities of biomass, fossil fuels, metals and non-metallic minerals. Our dependence on materials links us directly to the natural world from which primary materials are extracted, and to which they all ultimately return as waste and emissions.
  • Impacts associated with increasing agricultural outputs include large-scale land degradation via erosion, salinization and acidification which can accompany the extension of cropping into marginal lands or the intensification of inputs on existing arable land.  Large-scale change in land use and forest cover accompanies the extension of agriculture, timber production and in some cases mining and energy extraction.
  • Further problems include the destruction of biodiversity and the eutrophication of waterways. Increasing outputs of forestry products can increase deforestation, with attendant damage to surface and groundwater systems, erosion and changed flooding regimes.
  • Problems associated with mining and quarrying include loss of land to competing land uses, pollution of land and waterways from acid mine leaching, heavy metals liberated from mine tailings, and some chemicals used in mining and refining processes. Secondary and tertiary production processes, and disposal after final consumption, add to waste and emissions downstream. Ultimately, everything that is extracted must be sunk back into the environment

This UN report states that their study demonstrates the close relationship between economic trends and natural resource use.

Well of course they are related!  But our economic system doesn’t take natural resources into account.  Mow down a forest for timber and GDP increases.  Build a $200 million dollar water treatment plant to replace the free water purification services the forest provided, and GDP grows.  Completely out of forests?  Don’t worry, human ingenuity will solve the problem, or we’ll find a substitute.  How such insanity came to be is wonderfully explained in Hall and Kilitgaard’s “Energy and the Wealth of Nations”.

The UN doesn’t flat out state there are limits to growth, though they come close when they point out there’s not enough stuff in the world to raise the standard of living for everyone and we appear to be on an unsustainable trajectory (page 5).  But to flat out say there are limits to growth would be seen as an attack on capitalism and right-wingers would probably accuse the UN of socialism or worse and demand America stop funding them.  Limits to growth means a shrinking piece of pie for everyone.  Capitalism can only justify the huge disparities in wealth distribution with the constant propaganda that we all have the potential to become billionaires (especially if the government stops regulating businesses and taxing the rich).

Capitalism is lauded as the best political and economic system, but in reality it’s just the most successful at extracting energy and natural resources the most quickly to enrich mainly the top 0.1% of the population, future generations be damned. Oh well, Mother Nature can always be counted on to reveal how false the whole idea of capitalism was.

The Big Plan to cope with energy decline and climate change is to create renewables to replace fossil fuels. But wait, they’re made of tons and tons of metals and minerals. So they’ll make the world far worse; extractive industries, such as mining, create half the worlds carbon emissions and over 80% of biodiversity loss. To scale up wind and solar would require drastically ramping up mining to build more wind turbines and solar panels, which have to be thrown into landfills (recycling is almost non-existent) and built again every 20 years (turbines) or 18-25 years (solar panels) since both have such short life spans (Watts 2019).

A picture says a thousand words, look at this 2021 visual capitalist chart of the materials we use, “Visualizing the Accumulation of Human-Made Mass on Earth“.

Alice Friedemann  www.energyskeptic.com  Author of Life After Fossil Fuels: A Reality Check on Alternative Energy; When Trucks Stop Running: Energy and the Future of Transportation”, Barriers to Making Algal Biofuels, & “Crunch! Whole Grain Artisan Chips and Crackers”.  Women in ecology  Podcasts: WGBH, Jore, Planet: Critical, Crazy Town, Collapse Chronicles, Derrick Jensen, Practical Prepping, Kunstler 253 &278, Peak Prosperity,  Index of best energyskeptic posts

***

UNEP. 2016. Global material flows and resources productivity. United Nations Environment Programme  International resource panel. 200 pages.

Excerpts (out of order, shortened and paraphrased at times):

Natural resources provide the foundation of our lives on Earth. Water, soil, energy, minerals and metals underpin our standards of living. They feed and shelter us, and provide for our material needs throughout our lives.  Pressures on these natural resources are mounting. A growing population and heightened world economic demand in the past half century are rapidly depleting these vital resources, inflicting great harm on the natural environment and human health.

This study demonstrates the close relationship between economic trends and natural resource use. Global material use slowed in 2008 and 2009 due to the global financial crisis, with trade flows contracting in 2009, but is again on a growth trajectory. Sustained reductions in material use depend on changes in the structural asset base of an economy. This means that there is considerable inertia built into the global system of material use, which makes it difficult to reduce material use rapidly and on a sustained basis.

In this report, the use of materials – society’s metabolism – is interpreted as an environmental pressure. The larger the material use the bigger the pressure. Material use is also closely related to other pressure indicators including waste flows, energy use and carbon emissions, land use and water use. When material use grows, other pressure indicators increase. Material use is also used as a proxy for environmental impacts that will occur across the whole life cycle of material use from extraction, transformation and consumption to disposal. When material use increases, the environmental, social and economic impacts of material use also see a commensurate rise.

Material use is a good proxy for overall environmental pressure and also reflects environmental impacts, so decreasing material efficiency is not favorable with regard to environmental sustainability. It means that the speed at which we are exploiting natural resources, and generating emissions and waste, is increasing faster than the economic benefits gained. This disproportionately accelerates environmental impacts such as climate change, resource depletion and reduced ecosystem health.

Fast-expanding demand for materials will, however, require very large investments into new extraction and supply infrastructure and will contribute to local conflict over alternative uses of land, water, energy and materials. Such conflict is already pronounced in the energy sector where mining competes with agriculture and urban development in many places.

The primary sectors of the economy (agriculture, forestry, fishing, mining and quarrying) extract materials from the natural resource base and turn them into the basic commodities required for various major economic activities. Access to abundant and affordable materials is critical for the economic success of a national economy and fundamental to the ongoing well-being of its citizens. During the 20th century, the economic development that improved material standards of living for hundreds of millions of people was assisted by declining real prices for most materials, including food, fuel and metals.

There are major limitations on the availability of arable land for crops. Increasing inputs such as fertilizers and pesticides can increase productivity on available land, but often with rapidly diminishing returns and the associated costs of land degradation. If this approach is pushed too far, a situation can develop where arable land becomes a depleting stock which is effectively being “mined”. Furthermore, total land area remains constant, so expanding agriculture into existing forest areas will decrease land available for forestry, and vice versa. It is possible (indeed commonplace) to bring land from previously low productivity areas, e.g. deserts, into biomass production by transferring water from remote river systems, or pumping from aquifers, however this is usually limited by the expense of developing the infrastructure required, the adverse effects it has on source river systems, and/or by the rate at which the rivers or aquifers can provide. Many aquifers are in effect non-renewable resources on human timescales, with recharge periods of thousands of years or more.

This situation may not be sustained through the 21st century as the rapid economic growth occurring simultaneously in many parts of the world will place much higher demands on supply infrastructure and the environment’s ability to continue supplying materials.

[ My comment: For example, the world’s copper resources are about 1.6 Gt.  To provide all 10 billion people in the future with the average per capita mean (170 kg) would require 1.7 Gt, more than the estimated resource in the crust (Gordon 2006). ]

Consumption

The annual per capita material footprint for the Asia-Pacific, Latin America and the Caribbean, and West Asia is between 9 and 10 tonnes, Africa 3 tonnes.  The richest countries consume on average 10 times as many materials as the poorest countries, and twice the world average, with Europe at 20 tonnes per capita, and North America 25 tonnes.   Both regions have experienced a decline in material footprint since 2008 caused by the economic downturn during the global financial crisis (GFC). Before the GFC, North America had a per capita material footprint of well above 30 tonnes and Europe of well above 20 tonnes and both regions were on an upward trajectory. It remains to be seen whether the economic recovery in North America and Europe has put material footprint on a growth trajectory again. This would suggest that there is no level of income yet at which material use has stabilized.

The world economy has experienced a great acceleration in material use since 2000, strongly related to the industrial and urban transformation in China, which has required unprecedented amounts of iron and steel, cement, energy and construction materials. China’s growth in material demand since the year 2000 has reverberated across the world economy, especially in primary resource exporting regions and countries such as Latin America, Africa and Australia.

The group of countries of high human development have experienced the fastest growth in material footprint and are now, on average, at 12.5 tonnes per capita, up from 5 tonnes per capita in 1990. China, for instance, had a material footprint of 14 tonnes per capita in 2010 on a strong upward trajectory and Brazil had a material footprint of 13 tonnes per capita in 2010 and has also grown strongly in recent years.

The average material footprint of countries with medium levels of human development has grown slowly over the past two decades, reaching 5 tonnes per capita, while material footprint in low HDI countries has been stagnant for the past two decades at 2.5 tonnes per capita. The richest countries consume on average 10 times as many materials as the poorest countries, and twice the world average, which demonstrates very unequal distribution of materials to support the standard of living. It shows that the low income group of countries will require increasing quantities of materials, per capita, to achieve the sustainable development outcomes the global community aims for.

Extraction

Domestic extraction of materials has grown in all world regions to meet increased demand for materials. These two regions have required large and increasing amounts of imports of materials, especially fossil fuels and metal ores, from all other regions.  As a result, trade in materials has expanded 4-fold since 1970. In 2010, more than 10 billion tonnes of materials were exported globally.

Over the four decades an increasing specialization of countries with regard to natural resource extraction for trade has emerged, especially for fossil fuels and metal ores but to some extent also for agricultural products. This is especially visible at the country level where countries such as Australia, Brazil, Chile, Indonesia and Kazakhstan have increased their net exports of materials over time while other countries such as South Korea and the United States (until 2005) increased their net imports of materials, or depended (such as Germany, France and Japan) on a high level of net imports over the four decades. China, India and Pakistan show an interesting pattern of fast increasing import dependency for the direct trade of materials which coincides with the status of a net exporter when adjusting trade flows for upstream and downstream indirect material flows associated with trade, i.e. looking at the raw material equivalents of trade.

For this assessment study, we reviewed the existing global databases and compared their methodological underpinnings and results in an effort to create one unified data set that can become the standard authoritative source for data on global and country by country material use. In doing so, we were able to establish a multi-country, global data set for year by year material extraction for the four decades from 1970 to 2010 including information for all countries of the world as far as possible. The materials extraction data set reports 44 different material categories.

By relating global supply chains to final demand for resources, the material footprint indicator (amount of material consumed in a nation or region) is a good proxy for the average material standard of living in a country. It indicates that the level of development and well-being in wealthy industrial countries has been achieved largely through highly resource-intensive patterns of consumption and production, which are not sustainable and can’t be matched in other parts of the world.

The growing complexity of international supply chains, driven by globalization of the world economy, has paired with a trend whereby high-income countries tend to outsource many materials-, energy- and emissions-intensive industrial processes to other parts of the world. The high-income country can then effectively import the primary commodities it needs either in a greatly concentrated form, or indirectly “embodied” in a relatively small quantity of imports. The conventional measures used in material flows accounting are largely blind to such extraterritorial inputs to a nation’s final demand. This created a need for a new indicator that captures the full material requirements of a country’s final demand (household and government consumption, and capital investment), which includes extraterritorial inputs of materials for local consumption.

UN 2016 Figure 1

Figure 1. Yearly global economic growth rates, 1970–2013

The material intensities of the different sectors shown in Figure 2…[show that] services are not really substituting for materials- and energy-intensive processes at all [Other Activities].

UN 2016 Figure 2

Figure 2. World GDP sector added value shares

The economic success story of the twentieth century of Europe, the United States and Japan post-WWII was enabled by stable or decreasing world market prices for most natural resources. Since 2000, the price of many natural resources has started to grow.

Chapter 2 Global trends in resource extraction

Figure 7 shows the increase in global material use by four main material categories. All four material groups have grown over the past four decades. Biomass extraction grew by 2%, fossil fuels by 1.9%, metal ores by 2.8% and non-metallic minerals by 4% per year on average.

UN 2016 Figure 7

Figure 7. Global material extraction (DE) by four material categories, 1970–2010, million tonnes

[ My comment: Table 2 shows how much stuff and time it will take to use reserves up. It’s based on the Reserve to Production ratio, which is complete nonsense [see R/P ratio is completely useless].   If scientists are correct about the average decline rate of oil fields reaching 9% or more by 2030, we will need to replace half to two-thirds of our current oil, hard to do with far away, nasty, difficult, expensive tar sands and deep sea oil.  Only cheap plentiful oil matters, since even the lowest grade ores could be processed, and when they ran out, minerals and elements could be extracted from dirt or seawater. ]

UN 2016 Table 2

Table 2. Recoverable reserves of key commodities.

Since global material use has grown faster than population, we see in Figure 8 that per capita use has increased quite significantly, especially since 2000. It took 30 years for per capita material use to grow from 6.4 tonnes in 1970 to 7.9 tonnes in 2000 but only another 10 years to reach 10.1 tonnes per capita in 2010. By that time, the average use of materials per person included 2.7 tonnes of biomass (mostly related to food supply systems and including timber as a structural material and for heating), 1.9 tonnes of fossil fuels (mostly for power and transport), 1.1 tonnes of metal ores for construction, manufacturing applications and communications) and 4.4 tonnes of nonmetallic minerals (for buildings and transport infrastructure in fast-growing cities).

UN 2016 Figure 8

Figure 8. Per capita global material extraction (DE) by four material categories, 1970–2010, tonnes

Trade in metal ores grew by 4.7% annually on average over the past four decades but accelerated to 7% annual growth between 2000 and 2010. In 1970, 370 million tonnes of mostly concentrated metals were traded. In 2010, metals traded totalled 2.4 billion tonnes, comprising 22% of all traded materials. Trade in biomass has also grown dramatically from 370 million tonnes in 2010 to 1.9 billion tonnes in 2010. Biomass trade grew at an average of 4.2% over the past four decades and has somewhat declined since 2000 to 3.2% yearly average growth.

Trade in fossil fuels, which comprises the largest share in materials traded at slightly more than 50% of all traded materials, remained at a constant 2.8% yearly increase over the past 40 years and did not change between 2000 and 2010.

UN 2016 Figure 9

Figure 9. Global exports of materials by four material categories, 1970–2010, million tonnes

In 1970, 1.8 million tonnes of oil, coal and gas were traded among countries, accounting for two thirds of all traded materials. The amount of traded fossil fuels had grown to 5.6 billion tonnes by 2010.

The rapid increase in per capita global material use (the metabolic rate of the global economy) from 7.9 tonnes to 10.1 tonnes per capita in just 10 years since 2000 and the fact that materials use grew faster than GDP over that decade has meant that global material efficiency, for the first time in a century (Krausmann et al. 2009), has started to decline. Since 2000, we have observed growing material intensity (MI) in the global economy. In 2000, 1.2 kg of materials were required to produce one US$ of GDP; this had risen to almost 1.4 kg per US$ by 2010.

The main reason for the increase in material intensity at the global level is a shift of global production away from very material-efficient economies – Europe, the United States, Japan and South Korea – to the less efficient economies of China, India, Brazil and South Africa among others.

Sugar crops showed the strongest total growth for any of the major “pure” categories (137%), and this is consistent with the increasing importance of processed foods as developing countries urbanize.

UN 2016 Figure 14

Figure 14. Global extraction (DE) of biomass by material subcategories, 1970–2010, million tonnes

Figure 15 haseight categories, showing that total domestic extraction for each of the categories grew by over 100% between 1970 and 2010. By far the largest growth in total tonnage terms was for other bituminous coal, which increased by nearly 2.9 billion tonnes, almost twice the 1.5 billion tonne increase for natural gas, which had the second largest increase in total tonnage terms. These two categories grew at roughly comparable rates (2.6% p.a. and 2.8% p.a. compounding, respectively), with the rate of growth in other bituminous coal accelerating over the 1990 to 2010 period, while the fastest growth for natural gas was from 1970 to 1990. All coal categories together accounted for over 58% of the 7 billion tonne increase in fossil fuel tonnage between 1970 and 2010, increasing coal’s share of total fossil fuels from 48% to 53%, while natural gas increased from 12% to 17%.UN 2016 Figure 15

Figure 15. Global extraction of fossil fuels by material subcategories, 1970–2010, million tonnes

The growth rate for iron ore, which had been less than 1.2% p.a. compounding between 1970 and 2000, grew at over 9.1% p.a. between 2000 and 2010.

UN 2016 Figure 16

Figure 16. Global extraction of metal ores by material subcategories, 1970–2010, million tonnes

The data on Domestic Extraction (DE) of non-metallic minerals in Figure 17 are disaggregated into five categories and show clearly the domination of this category by construction minerals (common rock), in total tonnage terms. At 29.5 billion tonnes in 2010, the subcategory of construction minerals was larger than any of the other complete materials categories (biomass, fossil fuels and metal ores).   Not only was it one to two orders of magnitude larger than any of the other non-metallic minerals categories, it also grew at the fastest rate, 4.1% a year compounding from 1970 to 2010, compared to 2.6% a year for other mining and quarrying products n.e.c, the next fastest growing.

UN 2016 Figure 17

Figure 17. Global domestic extraction (DE) of non-metallic minerals by material subcategories, 1970–2010, million tonnes.

At the local scale, however, supplies can be severely limited, or their extraction can cause unacceptable environmental damage. An example of the former situation is where settlements are on major alluvial flats or deltas with little or no rock exposed at the surface. In such cases, the rock-based aggregates crucial for concrete and road base may need to be replaced by firing alluvium to create bricks, which may then be crushed for use as aggregate. This practice is expensive, and the requirement for fossil or biomass fuel will typically be more environmentally damaging than the extraction of alluvium of itself.

Chapter 3 Regional trends in material use

UN 2016 Figure 18

Figure 18. Regional classification used in this report.

While global material extraction tripled between 1970 and 2010 this growth was overwhelmingly driven by increasing domestic extraction in the Asia-Pacific region, which increased more than fivefold in just 40 years, at a compounding annual rate of nearly 4.8%. The average rate of growth actually increased in the latter half of the period (from 1990 to 2010) showing the acceleration of material extraction and demand from Asia and the Pacific. The Asia-Pacific region’s share of global DE consequently more than doubled over the past four decades, from less than a quarter of the global total to more than half.

UN 2016 Figure 19

Figure 19. Domestic extraction (DE) by seven subregions, 1970–2010, million tonnes

The share of global material extraction grew from 24.3 to 52.9% in Asia and Pacific, 9.4% to 10.7% in Latin America and Caribbean.  It shrunk everywhere else (nation 1970 %/2010 %). Africa / 7.9 / 7, Europe 20.9 / 10.5, North America 19.6 / 9.7, and Eastern Europe  14.7/ 5.8.

While relative shares contracted for many regions, total domestic extraction of materials still grew in all cases, with EECCA being the only region which saw growth of less than 40% in Domestic Extraction (DE) over the period (the EECCA increase was 16%). Latin America, West Asia and Africa all saw growth in total DE of greater than 100%, at compounding annual growth rates of 3.1%, 2.9% and 2.5% respectively.

Figure 20 shows a much more mixed situation with regard to per capita DE, with three of the seven regions (Africa, North America and West Asia) showing at least marginal decreases between 1970 and 2010.  The declines in per capita DE for Africa and West Asia are of particular interest in that they show that despite the rapidly growing total DE for these regions displayed in Figure 19, their populations are growing even faster, effectively reducing the already low per capita domestic resource availability in Africa and West Asia.

UN 2016 Figure 20

Figure 20. Per capita domestic extraction (DE) by seven world regions, 1970–2010,

Detail of the composition of the materials used by a society is important and can yield information on where a society is situated in the transition from an agrarian to an industrial society, and on the speed with which that transition is taking place. One important piece of information in this context is biomass inputs relative to mineral inputs. A high biomass share is indicative of a more agrarian economy, with mineral materials (encompassing fossil fuels, metal ores, and non-metallic minerals) increasing their shares as a society increasingly adopts the mineral-based energy and materials systems typical of industrial society

Figure 21 shows a very wide range in the proportion of domestic extraction (DE) of biomass between the different regions, and some markedly different trajectories. The AsiaPacific region stands out as the region which has most radically shifted away from biomass, which had a share of 53% of all materials in 1970, decreasing to just 22% by 2010.   While the Asia-Pacific region’s per capita extractions of fossil fuels grew twofold and metal ores grew more than threefold, it was growth in non-metallic minerals (dominated by construction aggregates) which contributed by far the greatest share, increasing by over six-fold, a compounding growth rate of 5.1% per year over the past four decades, and of 6.5% per year over the most recent two decades.

Latin America saw growth in DE per capita of all categories of materials over the period, with least growth in fossil fuels (20%) and greatest in metal ores (139%). It saw a significant decline in the share of biomass from 52% to 43%. However, this is still high by global standards, exceeded only by Africa, where biomass accounted for 46% of materials extraction in 2010;

UN 2016 Figure 21

Figure 21. Per capita domestic extraction (DE) in 7 world regions, 1970–2010, tonnes per capita

The Asia-Pacific region has shown by far the most rapid and consistent growth in its requirement for imports, which increased more than fourfold between 1970 and 2010 at a compounding rate of 4.4% per year, and 6.5% per year over the latter two decades. In contrast, Europe’s total net imports only increased by 50% over the full period. The high ongoing dependence of Europe on net physical imports indicates how it has been able to maintain high material living standards while having levels of Domestic extraction of some key material categories at or below the levels of less wealthy regions.

West Asia maintained major net exporter status over the full period, but its relative importance declined as it moved from being the World’s largest net exporter in 1970 to second largest by 2010, with total net exports increasing by 35% in total. Latin America shows relatively consistent growth in its net exports over time, which increased by a total of 164%, a compounding rate of 2.5% p.a.

It must be noted, however, that primary materials are often traded in much more concentrated form than they are extracted, and so traded primary products are frequently of much greater value to an economy than an equivalent tonnage of DE. This phenomenon is particularly pronounced for metal ores, but is also significant for biomass (Schandl and West 2012).

North America also figures as a much more significant importer of raw materials relative to Europe.

In Figure 26 we return to the Physical Trade Balance (PTB) metric, in this case giving more detailed disaggregation by the four main material categories, on a per capita basis. A first insight from an overview of Figure 26 is the dominance of fossil fuels in net physical trade terms. Regions tend to start out and remain major net importers or major net exporters for the full time period. In all cases except Latin America, fossil fuels are clearly the major net import/export item in volume terms. For Latin America, net exports of metal ores are frequently larger than fossil fuels. Europe and North America have consistently been major net importers of fossil fuels, although the trajectory for North America is notably more volatile, probably reflecting that region’s greater ability to satisfy domestic demand from Regional physical trade balance per capita.

UN 2016 Figure 26

Figure 26. Per capita physical trade balance (PTB) for 7 world regions, 1970–2010, tonnes

UN 2016 Figure 29

Figure 29. Per capita domestic material consumption (DMC) by seven subregions, 1970–2010, tonnes

UN 2016 Figure 30

Figure 30. Per capita domestic material consumption (DMC) by region, 1970–2010, million tonnes

UN 2016 Figure 33

Figure 33. Per capita material footprint of consumption (MF) by seven world regions, 1990–2010, tonnes.  Before the global financial crash, North Americans were consuming 34 tonnes per person.

Figure 82 shows the global extraction of non-metallic minerals from the study of Miatto et al. (in review), starting at around 10 billion tonnes in 1970 and reaching about 35 billion tonnes in 2010, a 3.5-fold growth and a yearly average growth rate of 3.4%.

Sand and gravel constituted the main share of global non-metallic minerals extraction in 2010 (40.8% gravel and 31.1% sand). Limestone, for cement production, had the fastest average annual growth rate of 4.5%, gravel extraction grew by 3.7% per year, and clay extraction grew by 3% per year.

Non-metallic minerals for roads and bricks are of a similar magnitude and show a slower average growth rate compared to non-metallic minerals for buildings. The average annual growth rate for roads was 0.8%, compared to 2.8% for bricks. The amount of non-metallic minerals required for rail tracks is negligible.

UN 2016 Figure 82

UN 2016 Figure 83

Figure 83. Global extraction of non-metallic minerals by sector of use, 1970–2010, million tonnes. Buildings include the actual buildings, and other infrastructure such as dams, water tanks, bridge pillars, and so on.

Source: Vaclav Smil. 2013. Making the Modern World: Materials and Dematerialization. Wiley.

Source: Vaclav Smil. 2013. Making the Modern World: Materials and Dematerialization. Wiley.

References

Ayres, R. U. & U. E. Simonis. (1994) Industrial metabolism. Restructuring for sustainable development. Tokyo and New York: United Nations University Press.

BGS. (2015) World Mineral Statistics. London: BGS – British Geological Survey.

BGS. (2013) World Mineral Statistics. London: BGS – British Geological Survey.

Bringezu, S. (2015) Possible Target Corridor for Sustainable Use of Global Material Resources. Resources, 4, 25–54. Cordell, D., J. O. Drangert & S. White (2009) The story of phosphorus: Global food security and food for thought. Global Environmental Change- Human and Policy Dimensions, 19, 292–305.

Carrington, D. 2020. World’s consumption of materials hits record 100bn tonnes a year. Unsustainable use of resources is wrecking the planet but recycling is falling, report finds. The Guardian.

EIA. (2015) International Energy Statistics. Washington: US Energy Information Administration.

Eurostat. (2001) Economy-wide material flow accounts and derived indicators. A methodological guide. Statistical Office of the European Union, Luxembourg.

Eurostat. (2007) Economy-wide Material Flow Accounting – A compilation guide. By Weisz, H., Krausmann, F., Eisenmenger, N., Schütz, H., Haas, W. and A. Schaffartzik. Eurostat, Luxembourg. Eurostat. (2009) Economy-Wide Material Flow Accounts: Compilation Guidelines for reporting to the 2009 Eurostat questionnaire – v01.

Eurostat. (2012) Economy-wide Material Flow Accounts (EW-MFA). Compilation Guide 2012. Statistical Office of the European Communities, Luxembourg.

Eurostat. (2013) Economy-wide Material Flow Accounts (EW-MFA). Compilation guide 2013. Statistical Office of the European Communities, Luxembourg.

FAO. (2014a) Fishstat database. Food and Agriculture Organization of the United Nations. FAO. (2014b) Subscribers section – Bulk downloads – Food balance sheets. Food and Agriculture Organization of the United Nations.

FAO. (2014c) Subscribers section – Bulk downloads – Forestry. Food and Agriculture Organization of the United Nations.

FAO. (2014d) Subscribers section – Bulk downloads – Production. Food and Agriculture Organization of the United Nations. Fischer-Kowalski, M. & H. Haberl. (2007) Socioecological transitions and global change. Trajectories of social metabolism and land use. Cheltenham, UK: Edward Elgar.

Fischer-Kowalski, M. (1997) Society’s metabolism: on the childhood and adolescence of a rising conceptual star. In The international handbook of environmental sociology, eds. M. Redclift & G. Woodgate. Cheltenham:

Edward Elgar. Fischer-Kowalski, M., F. Krausmann, S. Giljum, S. Lutter, A. Mayer, S. Bringezu, Y. Moriguchi, H. Schütz, H. Schandl & H. Weisz. (2011) Methodology and Indicators of Economy-wide Material Flow Accounting. Journal of Industrial Ecology, 15, 855–876.

Fishman, T., H. Schandl, H. Tanikawa, P. Walker & F. Krausmann (2014) Accounting for the Material Stock of Nations. Journal of Industrial Ecology, 18, 407–420.

Foley, J. A., R. DeFries, G. P. Asner, C. Barford, G. Bonan, S. R. Carpenter, F. S. Chapin, M. T. Coe, G. C. Daily, H. K. Gibbs, J. H. Helkowski, T. Holloway, E. A. Howard, C. J. Kucharik, C. Monfreda, J. A. Patz, I. C. Prentice, N. Ramankutty & P. K. Snyder (2005) Global consequences of land use. Science, 309, 570–574.

Geschke, A., R. Wood, K. Kanemoto, M. Lenzen & D. Moran (2014) Investigating alternative approaches to harmonise multiregional input-output data. Economic Systems Research, 26, 354.385.

Giljum, S., M. Bruckner & A. Martinez (2015) Material Footprint Assessment in a Global Input-Output Framework. Journal of Industrial Ecology, 19, 792.804.

Giljum, S., M. Dittrich, M. Lieber & S. Lutter (2014) Global patterns of material flows and their socio-economic and environmental implications: a MFA study on all countries world-wide from 1980 to 2009. Resources, 3, 319.339.

Gordon, R.B., et al. 2006. Metals stocks and sustainability. Proceedings of the National Academy of Sciences (USA) 103:12-9-1214

Haas, W., F. Krausmann, D. Wiedenhofer & M. Heinz (2015) How Circular is the Global Economy?: An Assessment of Material Flows, Waste Production, and Recycling in the European Union and the World in 2005. Journal of Industrial Ecology.

Haberl, H., M. Fischer-Kowalski, F. Krausmann, H. Weisz & V. Winiwarter (2004) Progress towards sustainability? What the conceptual framework of material and energy flow accounting (MEFA) can offer. Land Use Policy, 21, 199.213.

Haberl, H., M. Fischer-Kowalski, F. Krausmann, J. Martinez-Alier & V. Winiwarter (2011) A Sociometabolic Transition towards Sustainability? Challenges for Another Great Transformation. Sustainable Development, 19, 1.14.

IEA. (2014a) World Energy Statistics . Documentation for Beyond 2020 Files. IEA. (2014b) World energy statistics, IEA World Energy Statistics and Balances (database).

IEA. (2013a) Energy statistics of non-OECD countries, 1960.2011. Online database. Paris: IEA.

IEA. (2013b) Energy statistics of OECD countries, 1960.2011. Online database. Paris: IEA.

IEA. (2014a) World Energy Statistics – Documentation for Beyond 2020 Files.

IEA. 2014b. World energy statistics, IEA World Energy Statistics and Balances (database).

Jölli, D., Giljum, S. (2005) Unused biomass extraction in agriculture, forestry and fishery. Sustainable Europe Research Institute, Vienna.

Krausmann, F., Gingrich, S., Eisenmenger, N., Erb, K.-H., Haberl, H., Fischer-Kowalski, M. (2009) Growth in global material use, GDP and population during the 20th century. Ecological Economics 68, 2696–2705.

Lamb, W. F., J. K. Steinberger, A. Bows- Larkin, G. P. Peters, J. T. Roberts & F. R. Wood (2014) Transitions in pathways of human development and carbon emissions. Environmental Research Letters, 9.

Lambin, E. F. & P. Meyfroidt (2011) Global land use change, economic globalization, and the looming land scarcity. Proceedings of the National Academy of Sciences of the United States of America, 108, 3465–3472.

Lenzen, M., D. Moran, K. Kanemoto & A. Geschke (2013) Building Eora: A global multi-region input-output database at high country and sector resolution. Economic Systems Research, 25, 20–49.

Lenzen, M., K. Kanemoto, D. Moran & A. Geschke (2012) Mapping the Structure of the World Economy. Environmental Science & Technology, 46, 8374–8381.

Lenzen, M., R. Wood & T. Wiedmann (2010) Uncertainty analysis for multiregion input-output models – A case study of the UK’s carbon footprint. Economic Systems Research, 22, 43–63.

Leontief, W. W. (1936) Quantitative input and output relations in the economic system of the United States. Review of Economics and Statistics, 18, 105–125.

McKinsey Global Institute. (2011) Resource revolution: meeting the world’s energy, materials, food and water needs. London.

Mudd, G. M. (2008) Sustainability of uranium mining and milling: toward quantifying resources and eco-efficiency. Environmental Science & Technology, 42, 2624–2630.

Narayanan, G., A. A. Badri & R. McDougall. (2012) Global Trade, Assistance, and Production: The GTAP 8 Database. Purdue University: Center for Global Trade Analysis.

OECD. (2004) Recommendation on material flows and resource productivity. OECD, Paris.

OECD. (2008) Measuring Material Flows and Resource Productivity. The OECD guide Environment Directorate. Organisation for Economic Co-operation and Development, Paris.

Peters, G. P. & E. G. Hertwich (2008) CO2 Embodied in International Trade with Implications for Global Climate Policy Environmental Science & Technology, 42, 1401–1407.

Peters, G. P., R. Andrew & J. Lennox (2011) Constructing an environmentally extended multi-regional input-output table using the GTAP database. Economic Systems Research, 23, 131–152.

Reichl, C., Schatz, M., Zsak, G. (2015) World Mining Data 2015, in: Federal Ministry for Economics and Labour, Austria (Ed.). Federal Ministry for Economics and Labour, Austria, Wr. Neustadt.

Schaffartzik, A., N. Eisenmenger, F. Krausmann & H. Weisz (2014) Consumption-based Material Flow Accounting. Austrian Trade and Consumption in Raw Material Equivalents 1995– 2007. Journal of Industrial Ecology, 18, 102–112.

Schandl, H. & J. West (2010) Resource use and resource efficiency in the Asia-Pacific region. Global Environmental Change-Human and Policy Dimensions, 20, 636–647.

Schandl, H. & J. West (2012) Material Flows and Material Productivity in China, Australia, and Japan. Journal of Industrial Ecology, 16, 352–364.

Schandl, H. & N. Eisenmenger (2006) Regional Patterns in Global Resource Extraction. Journal of Industrial Ecology, 10, 133–147.

Schoer, K., J. Weinzettel, J. Kovanda, J. r. Giegrich & C. Lauwigi (2012) Raw Material Consumption of the European Union–Concept, Calculation Method, and Results. Environmental Science & Technology, 46, 8903–8909.

SERI, WU-Vienna. (2014) Technical Report on the compilation of the material flow database for www.materialflows.net. Sustainable Europe Research Institute, Vienna University of Economics and Business, Vienna.

Steen-Olsen, K., J. Weinzettel, G. Cranston, A. E. Ercin & E. G. Hertwich (2012) Carbon, Land, and Water Footprint Accounts for the European Union: Consumption, Production, and Displacements through International Trade. Environmental Science & Technology, 46, 10883–10891.

Steinberger, J. K. & J. T. Roberts (2010) From constraint to sufficiency The decoupling of energy and carbon from human needs, 1975– 2005. Ecological Economics, 70, 425–433.

Steinberger, J. K., F. Krausmann & N. Eisenmenger (2010) Global patterns of material use: a socioeconomic and geophysical analysis. Ecological Economics, 69, 1148–1158.

Steinberger, J. K., F. Krausmann, M. Getzner, H. Schandl & J. West (2013) Development and Dematerialization: An International Study. PloS one, 8, e70385.

Takiguchi, H. & K. Takemoto (2008) Japanese 3R Policies Based on Material Flow Analysis. Journal of Industrial Ecology, 12, 792–798.

Tukker, A. & E. Dietzenbacher (2013) Global Multiregional Input-Output Frameworks: An Introduction and Outlook. Economic Systems Research, 25, 1–19.

UNEP. (2011a) Decoupling natural resource use and environmental impacts from economic growth. Nairobi: United Nations Environment Programme.

UNEP. (2011b) Resource efficiency: economics and outlook for Asia and the Pacific. Melbourne: CSIRO Publishing.

UNSD. (2015) Energy Statistics Database. United Nations Statistics Division.

USGS. (2015) International Minerals Statistics and Information. US Geological Survey, Washington, DC.

USGS. (2013) International Minerals Statistics and Information. Washington, DC: US Geological Survey.

Watts J (2019) Resource extraction responsible for half world’s carbon emissions. The Guardian.

Weisz, H., W. Haas, N. Eisenmenger, F. Krausmann & A. Schaffartzik. (2007) Economy-wide Material Flow Accounts Resource Productivity. EU-15. 1990– 2004 Luxembourg: Eurostat.

Wiedmann, T. (2009) A review of recent multi-region input-output models used for consumption-based emission and resource accounting Ecological Economics, 69, 211–222.

Wiedmann, T. O., H. Schandl, M. Lenzen, D. Moran, S. Suh, J. West & K. Kanemoto (2015) The material footprint of nations. Proceedings of the National Academy of Sciences, 112, 6271–6276.

Wirsenius, S. (2000) Human Use of Land and Organic Materials: Modelling the Turnover of Biomass in the Global Food System. In Department of Physical Resource Theory. Göteborg: Chalmers University of Technology.

Wood, R., K. Stadler, T. Bulavskaya, S. Lutter, S. Giljum, A. de Koning, J. Kuenen, H. Schütz, J. Acosta-Fernández & A. Usubiaga (2015) Global Sustainability Accounting—Developing EXIOBASE for Multi-Regional Footprint Analysis. Sustainability, 7, 138–163.

Posted in ! PEAK EVERYTHING, Distribution of Wealth, Exponential Growth, Limits To Growth, Organizations, Other Experts | Tagged , , | 5 Comments

M. King Hubbert and the future of peak oil by Kurt Cobb

Preface. M. King Hubbert predicted that if we were unable to replace fossil energy with water, nuclear and solar power, that we would go back to an agrarian existence (Hubbert MK (1949) Energy from Fossil Fuels. Science). That is how I see the future too. If trucks have to run on petroleum diesel as I show in “When Trucks Stop Running” as well as why the electric grid can’t exist without natural gas, and manufacturing must use fossils for high heat as well as the feedstock for half a million products, as I show in “Life After Fossil Fuels”, then we are indeed returning to the Agrarian lifestyle. We should be using our remaining precious fossil energy to build up long-lasting infrastructure and preserving knowledge for future generations. Oil peaked in 2018, so time is running out.

Alice Friedemann www.energyskeptic.com  author of “Life After Fossil Fuels: A Reality Check on Alternative Energy“, 2021, Springer; “When Trucks Stop Running: Energy and the Future of Transportation”, 2015, Springer; Barriers to Making Algal Biofuels, and “Crunch! Whole Grain Artisan Chips and Crackers”. Podcasts: Collapse Chronicles, Derrick Jensen, Practical Prepping, KunstlerCast 253, KunstlerCast278, Peak Prosperity , XX2 report

* * *

Kurt Cobb. July 17, 2016. M. King Hubbert and the future of Peak Oil. ResourceInsights.

Almost synonymous with the term “peak oil” is M. King Hubbert, perhaps the foremost geophysicist of the 20th century, who first theorized about the eventual decline of oil production in the 1930s. His life has now been chronicled by science writer Mason Inman in a new biography entitled The Oracle of Oil.

Depending upon whom you speak with, peak oil is either a catastrophe waiting to happen or a far-off concern that has already been solved or will be soon. Frequently, peak oil is referred to as a myth. What you rarely hear is that peak oil is an empirical fact having already occurred in dozens of countries.

The term “peak oil” simply means that crude oil production for any field, region or country eventually reaches a peak or plateau from which it inexorably declines. Because the amount of oil in the Earth’s crust is finite, it is logical to assume that one day peak oil production will occur worldwide. The concern is that we as a global society are so accustomed to rising oil production that we have built an entire world around that assumption. Will we be ready when oil production begins to decline?

To shed some light on that and other questions author Inman takes us from Hubbert’s early days at the University of Chicago to his famous speech in 1956 (in which he predicted a peak in U.S. crude oil production no later than 1970) to his days in Washington, D.C. working for the U.S. Geological Survey and his fights there concerning the timing of a U.S. oil production peak.

In the course of the story Inman puts to rest misconceptions about Hubbert and about peak oil. First and foremost, peak does NOT mean running out. As explained above it means the trend of rising oil production reverses into a decline. When this reversal occurs worldwide, it could pose challenges for a society that has yet to find a cheap, widely available substitute for petroleum to fuel its transportation system. Electric vehicles are still in their infancy and would require huge infrastructure investments. And, petrochemicals made from oil are the basis for a wide variety of clothing, medicines, lubricants, pesticides, and industrial chemicals. Oil is embedded practically everywhere in our lives, and finding substitutes won’t be easy in many cases.

Second, forecasting peak oil is NOT tantamount to forecasting disaster. Hubbert himself believed that society could make a successful transition away from petroleum and other fossil fuels to a nuclear- and solar-powered world so long as we started early enough. Far from being a pessimist, Inman tells us, Hubbert was a utopian who believed an efficiently run technocratic society with plenty for all was possible if only we would take the necessary steps.

In fact, Hubbert foresaw some things we now take for granted, for example, that postal mail would be largely replaced by “signals sent by wire” which we, of course, call email. He believed that energy efficiency in the form of thick insulation for homes would become increasingly common. We now see that development in weatherization programs for homeowners and the spread of Passive House technology which reduces heating and cooling needs by 80 to 90 percent.

Third, Hubbert was NOT anti-oil. In fact, he worked for Shell Oil Company for 20 years in production research. Hubbert understood deeply the benefits of oil to human society, and he wanted those benefits to continue. But he believed they would not continue unless new sources of energy were deployed before fossil fuel production began its inevitable decline.

Fourth, contrary to what his critics say, Hubbert did take technological improvements into account when calculating his forecasts for peak. He was aware of unconventional sources of oil such as tar sands, oil shale, and coal-to-liquids technology. But he realized that these sources would be challenging and expensive to exploit.

It turns out he was right. Operators in the Canadian tar sands today are having a difficult time simply maintaining production in the current low-price environment for oil. As for oil shale, despite more than 30 years of research and development including pilot plants, there is no commercial production of oil from oil shale in the United States (which has by far the largest deposits) and very limited production in Estonia (where oil shale is mostly burned directly to produce electricity). It’s not clear that standalone facilities that would produce only oil from oil shale would be economical given the American experience.

Coal-to-liquids technology continues to be too expensive to deploy worldwide though it does have a foothold in South Africa. South Africa built these expensive and environmentally dirty facilities during the apartheid period when the country’s leaders feared an embargo might curtail oil shipments to South Africa.

There is, of course, the question of just how oracular the “oracle of oil” was. As it turns out, Hubbert’s prediction of a peak in U.S. production (which at that time covered the lower 48 states) was right on the money. U.S. crude oil production fell starting in 1970 and continued to fall (with a short respite when Alaskan oil began to flow) until 2008. Then, the advent of a new kind of hydraulic fracturing or fracking (as it is popularly called) made possible the extraction of previously difficult-to-get oil from deep shale deposits (not to be confused with oil shale mentioned above).

U.S. production last year came close to eclipsing the 1970 number, but has fallen back as low prices have forced deep reductions in drilling. Meanwhile, non-shale production continues to fall. A rise in oil prices would certainly revive drilling in American shale deposits. But it is doubtful that this will happen before shrinking conventional production makes it all but impossible to achieve a new all-time high in U.S. production.

As for world production, in the early 1970s Hubbert calculated that a worldwide peak might come as soon as the mid-1990s. But, he did his original calculations before the high prices and oil crises of the 1970s led to an energy efficiency drive worldwide and resulted in the first ever sustained decline in world oil consumption and flat consumption for many years thereafter.

He later revised his view which ended up being close to that of the U.S. Energy Information Administration in the late 1970s. The agency forecast a probable peak about 2010, but offered a range of 1995 to 2035 depending on energy policies and consumption patterns.

As it turned out, conventional oil, the kind that Hubbert used in his models, the kind that flows as a liquid from the ground–which I call “Beverly Hillbillies oil” after the “bubbling crude” seen in the introduction to the now long-defunct television series–this kind of oil peaked in 2006 according to the International Energy Agency, a consortium of 29 countries which provides ongoing research and information about energy supplies worldwide.

Despite all protestations to the contrary, Hubbert proved prescient once again. That world oil production continues to eke out small gains is due entirely to production from unconventional sources not included in Hubbert’s models. But those sources have shown themselves to be exquisitely sensitive to price.

In the two countries best known for unconventional oil, the United States and Canada, production from U.S. deep shale deposits and Canadian tar sands is now shrinking. Alarmingly, without recent growth in oil production in these two countries, worldwide oil production would have declined from 2005 to today. Now that the twin engines of growth, the United States and Canada, are in decline, we may see a fall in worldwide production soon (though whether this will mark the ultimate peak will not be known until many years thereafter).

But, any peak will inevitably result from a mix of economic and geologic factors. So, the new question about oil is, “Can we afford to extract and refine the oil we have left?” Or, more precisely, “Will the cost of extracting these unconventional sources cause economic growth to slow or stagnate?”

This is just the sort of scenario Hubbert feared if we waited too long to address the inevitable transition away from fossil fuels. And, there is reason to believe that low oil prices today reflect an economy slowed by previously high oil prices. These high prices themselves are an indication that we are now facing ever more difficulty and effort in extracting the remaining marginal sources of oil. And, the fact that so many oil companies are now going bankrupt due to low prices tells us that high prices will have to return if we want to extract this difficult-to-get oil in great quantities again.

Hubbert died in 1989 living to see the nuclear accidents at Three Mile Island and Chernobyl. Long concerned about nuclear waste and impatient for a transition, Hubbert decided that global society needed to undertake the rapid deployment of an indisputably clean source of energy, solar power. We would use solar power not only for electricity, but also to make the liquid fuels needed for our transportation system which could be adapted to run on methanol or hydrogen.

Perhaps what irked Hubbert’s critics the most was his lifelong skepticism about exponential economic and population growth. So, firmly did he believe that population growth needed to be curtailed that he and his wife had no children. There were limits, he believed, and if they were breached, humans would pay dearly.

Hubbert and his work have once again come into our worldwide discourse as a result of the 2008 oil price spike and the highest ever daily average prices for oil from 2011 through 2014. He is much maligned and much praised these days. But he is perhaps not well understood.

Mason Inman’s compelling biography gives all of us, critics and supporters alike, a chance finally to understand this scientific giant and the context within which he spawned insights that continue to be central to our lives.

Kurt Cobb is an author, speaker, and columnist focusing on energy and the environment. He is a regular contributor to the Energy Voices section of The Christian Science Monitor and author of the peak-oil-themed novel Prelude. In addition, he has written columns for the Paris-based science news site Scitizen, and his work has been featured on Energy Bulletin (now Resilience.org), The Oil Drum, OilPrice.com, Econ Matters, Peak Oil Review, 321energy, Common Dreams, Le Monde Diplomatique and many other sites. He maintains a blog called Resource Insights and can be contacted at kurtcobb2001@yahoo.com.

Posted in How Much Left, Kurt Cobb, Peak Oil | Tagged , | Comments Off on M. King Hubbert and the future of peak oil by Kurt Cobb