
Art Berman. July 15, 2016. Oil Prices Lower Forever? Hard Times In A Failing Global Economy. Forbes.
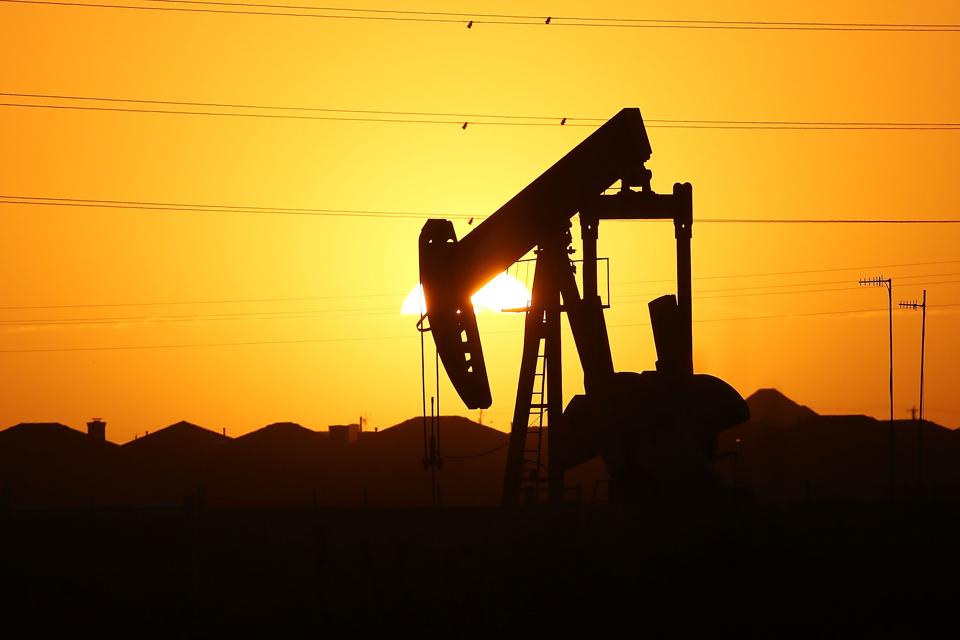
A pumpjack sits on the outskirts of town at dawn in the Permian Basin oil field on January 21 in the oil town of Midland, Texas. (Photo by Spencer Platt/Getty Images)
Two years into the global oil-price collapse, it seems unlikely that prices will return to sustained levels above $70 per barrel any time soon or perhaps, ever. That is because the global economy is exhausted.
The current oil-price rally is over, as I predicted several months ago, and prices are heading toward $40 per barrel.
Oil has been re-valued to affordable levels based on the real value of money. The market now accepts the erroneous producer claims of profitability below the cost of production and has adjusted expectations accordingly. Be careful of what you ask for.
Meanwhile, a global uprising is unfolding.
The U.K. vote to exit the European Union is part of it. So is the Trump presidential candidacy in the U.S. and the re-run of the presidential election in Austria. Radical Islam and the Arab Spring were precursors. People want to throw out the elites who led the world into such a mess while assuring them that everything was fine.
The uprising seems to be about immigration and borders but it’s really about hard times in a failing global economy. Debt and the cost of energy are the pillars that underlie that failure and the resulting discontent. Immigrants and infidels are scapegoats invented by demagogues.
Energy Is The Economy
Energy is the economy. Energy resources are the reserve account behind currency. The economy can grow as long as there is surplus affordable energy in that account. The economy stops growing when the cost of energy production becomes unaffordable. It is irrelevant that oil companies can make a profit at unaffordable prices.
The oil-price collapse that began in July 2014 followed the longest period of unaffordable oil prices in history. Monthly oil prices (in 2016 dollars) were above $90 per barrel for 48 months from November 2010 through September 2014 (Figure 1).

Figure 1. Oil Prices in 2016 Dollars, 1950-2016. Source: EIA, Federal Reserve Bank of St. Louis and Labyrinth Consulting Services, Inc.
That was more than 3.5 times longer than the period from September 2007 through September 2008 just before the Financial Collapse. It was almost twice as long as the period from September 1979 through November 1981 that preceded the longest oil-price collapse in history.
There is nothing magic about $90 per barrel but major economic dislocations have occurred following periods above that level. Few economists or world leaders seem to understand this or include the cost of energy in their models and policies.
There is a clear correlation between oil price and U.S. GDP (Gross Domestic Product) when both are normalized in real current dollar values (Figure 2). Periods of low or falling oil prices correspond to periods of increasing GDP and periods of high or rising prices coincide with periods of flat GDP.

Figure 2. U.S. GDP and WTI Oil Price. Source: U.S. Bureau of Labor Statistics, The World Bank, EIA and Labyrinth Consulting Services, Inc.
Economic growth is complex and some will object to this correlation. Fine. But energy is also complex. Most people think about it as an independent topic or area of our lives. Like business, politics, economics, education, agriculture, and manufacturing, there is energy. This is understandable but wrong.
Energy underlies and connects everything. We need energy to make things, transport and sell things and to transport ourselves so that we can work and spend. We need it to run our computers, our homes and our businesses. It takes energy to heat, cool, cook and communicate. In fact, it is impossible to think of anything in our lives that does not rely on energy.
When energy costs are low, the costs of doing business are correspondingly low. When energy prices are high, it is difficult to make a profit because the underlying costs of manufacture and distribution are high. This is particularly true in a global economy that requires substantial transport of raw materials, goods and services.
The global economy expanded in the mid-1980s through 1990s when oil prices averaged $33 per barrel. Then, oil prices nearly doubled to an average of $68 per barrel from 1998 to 2008, and subsequently increased after 2008 to 2.5 times more than in the 1990s. When oil prices exceed $90 per barrel, the global economy is no longer profitable.
America’s Golden Age
The United States experienced a golden age of economic growth and prosperity during the 25 years following World War II. This period forms the basis for U.S. and indeed global expectations that growth is the norm and that recessions and slow growth are aberrations that result from mis-management of the economy. This is the America that today’s populists want to return to.
The Golden Age, however, was a singular phenomenon that is unlikely to recur. After 1945, the economies and militaries of Europe and Japan were in ruins. The U.S. was the only major economy that survived the war intact. Having no competition is a huge competitive advantage.
The U.S. was the first country to fully convert to petroleum, another competitive advantage. A barrel of oil contains about the same amount of energy as a human would expend in calories in 11 years of manual labor. Crude oil contains more than twice as much energy as coal and two-and-a-half times more than wood. And it’s a liquid that can be moved easily around the world and put in vehicles for transport.
In 1950, the U.S. produced 52% of the crude oil in the world and was largely self-sufficient. Texas was the largest U.S. producing state and the Texas Railroad Commission (TXRRC) controlled the world price of oil through a system of allowable production that also ensured spare capacity.
Oil was cheap, the U.S. controlled its price and had a positive balance of payments.
Oil Shocks of the 1970s and 1980s
That began to change toward the end of the 1960s. A rebuilt Europe and Japan rose to challenge American commercial dominance and the costs of fighting the spread of communism–especially in Vietnam–weakened the American economy. In 1970, the U.S. economy went into recession and President Nixon took drastic steps including the end of backing the dollar with gold reserves. The rest of the countries that were part of the Bretton Woods Agreement did the same resulting in the largest global currency devaluation in history.
In November 1970, U.S. oil production peaked and began to decline. In March 1972 the TXRRC abandoned allowable rates. The United States no longer had any spare capacity. OPEC had long objected that oil prices were held artificially low by the U.S. Now OPEC had the clout to do something about it.
In October 1973, OPEC declared an oil embargo against Israel’s allies including the U.S. during the Yom Kippur War. This was really was just an excuse to adjust oil prices to the devalued Western currencies following the end of the Bretton Woods Agreement.
The price of oil more than doubled by the end of January 1974 from $22 to $52 per barrel (2016 dollars). When the Arab-Israeli conflict ended a few months later, oil prices did not fall.
Real oil prices more than doubled again in 1980 to $117 when Iran and Iraq began a war that took more than 6 million barrels off the market by 1981. The effect of these price hikes on the world economy was devastating. World demand for oil decreased by almost 10 million barrels per day and did not recover to 1979 levels until 1994 (Figure 3). Real prices did not recover to $40 until 2004 except for a brief excursion during the First Persian Gulf War in 1990.

Figure 3. OPEC and world liquids production compared to 1979 and world oil prices. Source: BP and Labyrinth Consulting Services, Inc.
The Miracle of Reagan Economics: Low Oil Price
Ronald Reagan is remembered as a great U.S. president because the economy improved and the Soviet Union fell during his administration. Both of these phenomena were because of low oil prices.
After U.S. oil production peaked, imports increased 5-fold from 1.3 to 6.6 mmbpd from 1970 to 1977 (Figure 4).

Figure 4. U.S. crude oil production, imports and oil price in 2016 dollars. Source: EIA, Federal Reserve Bank of St. Louis and Labyrinth Consulting Services, Inc.
When oil prices rose to nearly $110 per barrel during the Iran-Iraq War, the U.S. went into recession from mid-1981 through 1982. Oil consumption fell more than 3 million barrels per day. Production from Prudhoe Bay began in 1977 and somewhat dampened the overseas outflow of capital but it did not help consumers with price.
Federal Reserve Chairman Paul Volker raised interest rates to more than 16% by 1981 to bring the inflation caused by higher oil prices under control (Figure 5). This worsened the economic hardship for Americans in the short term but also became the foundation of the Reagan economic revival.

Figure 5. U.S. public and consumer debt and interest rates. Source: U.S. Treasury, U.S. Federal Reserve Banks and Labyrinth Consulting Services, Inc.
Much of the developing world had survived the oil shocks of the 1970s by borrowing from U.S. commercial banks. Higher U.S. interest rates put those countries into recession and that helped keep oil demand and prices low. By 1985, oil prices had fallen below $40 per barrel and would not rise above that level again until 2005.
Volker found an opportunity in the demand destruction from oil shocks. By raising U.S. interest rates, he managed to roll back oil prices almost to levels before the 1973 oil embargo and created a great economic boon for the U.S.
“He [Volker] used the strategic price that America continued to control—namely, world interest rate—as a weapon against the price of the strategic commodity that America no longer controlled, which was oil.”
–James Kenneth Galbraith*
High interest rates attracted investment. Along with low oil prices, a strong dollar, tax cuts and increased military spending, Volker and Reagan restored growth to the U.S. economy. By 1991, the Soviet Union collapsed under the strain of low oil prices, debt, and military spending.
Things Fall Apart; The Center Cannot Hold
Treasury bonds became the effective reserve asset of the world. The U.S. put economic growth on a credit card that it never planned to pay off. Public debt increased almost 6-fold from the beginning of Reagan’s administration ($1 trillion) in 1981 to the end of Clinton’s ($6 trillion) in 2000 (Figure 5). By the end of Bush’s presidency in 2008, debt had reached $10 trillion. It is now more than $18 trillion.
The 1990s were the longest period of economic growth in American history. There are, of course, limits to growth based on debt but the new economy seemed to be working as long as oil prices stayed low. Then, Prudhoe Bay peaked in 1985. Total U.S. production declined, and imports increased sharply as the economy improved (Figure 4). Similarly, the world economy slowly recovered after 1985 with lower oil prices.
Consumer credit expanded under President Clinton through mortgage debt. Manufacturing had been progressively outsourced to Latin American and Asia, and the evolving service economy was underwritten by consumer debt that increased 7-fold from less than $0.5 trillion in 1981 to $2.6 trillion in 2008 (Figure 5).
The “dot.com” market collapse in 2000 and the September 11, 2001 terror attacks pushed the U.S. economy into recession and the Federal Reserve reduced interest rates below 2%, the lowest levels in U.S. history to date. Mortgage financing boomed.
The 1993 repeal of The Glass-Steagall Act allowed banks to package mortgage debt into complex, high-risk securities (CDOs or collateralized debt obligations). In what can only be described as out-of control speculative greed and institutional fraud, CDOs, synthetic CDOs that bet on the outcome of CDO bets, and the credit default swaps that bet against both propelled the economy to levels of leverage and instability not seen since the 1920s.
“This was the new new world order: better living through financialization.”
–James Kenneth Galbraith**
From 2004 through 2008, world liquids production reached a plateau around 86 million barrels per day (Figure 5). Increased demand from China and other developing economies pushed oil prices higher as traders and investors worried that Peak Oil had perhaps arrived.

Figure 6. World liquids production and oil price in 2016 dollars. Source: EIA June 2016 STEO and Labyrinth Consulting Services, Inc.
Oil prices soared to more than $140 per barrel and interest rates rose above 5%. The adjustable interest rates that underlaid much sub-prime debt also rose. Mortgage holders began to default and world financial markets collapsed in 2008.
The Second Coming
Debt and higher oil prices had spoiled the party. The problem was addressed with more debt and higher oil prices.
The Federal Reserve Bank brought interest rates to almost zero, created money and bought Treasury bonds while the government bailed out the banks and auto industry. OPEC cut production by 2.6 million barrels from December 2008 to March 2009 and oil prices recovered from $43 to $65 by May, and were more than $80 by year-end propelled by a weak dollar and easy credit.
Tight oil, deep water and oil sands projects that needed sustained high oil prices took off. Unconventional production in the U.S. and Canada increased 5 million barrels per day between January 2010 and October 2015 (Figure 7).

Figure 7. Incremental world crude oil + lease condensate production. Source: EIA and Labyrinth Consulting Services, Inc. after Crude Oil Peak.
Tight oil used the same horizontal drilling and hydraulic fracturing technology that had been pioneered in earlier shale gas plays. The technology was expensive but once oil price topped $90 per barrel in late 2010 and stayed high for the next 4 years, the plays were deemed successful by producers and credit markets.
U.S. tight oil and deep-water production resulted in a second coming of sorts with monthly crude oil output reaching 9.69 million barrels per day in April 2015. That was 350,000 bopd less than the 1970 peak of 10.04 million bopd.
The difference of course was cost. In 1970, the market price of a barrel of oil in 2016 dollars was $20 per barrel versus $100 from 2011 to 2014, and $55 per barrel in 2015.
And this is precisely the problem with the almost universally held belief that technology will make all things possible, including making a finite resource like oil infinite. Technology has a cost that its evangelists forget to mention.
The reality is that technology allows us to extract tight oil from non-reservoir rock at almost 3 times the cost of high-quality reservoirs in the past. The truth is that we have no high-quality reservoirs left with sufficient reserves to move the needle on the high global appetite for oil. The consequence is that to keep consuming and producing as we always have will inevitably cost a lot more money. This is basic thermodynamics and not a pessimistic opinion about technology.
Nevertheless, in a zero-interest rate world, there was great enthusiasm for yields greater than conventional investments like U.S. Treasury bonds and savings accounts that continue to pay less than 2%. Bank and mezzanine debt, high-yield corporate (“junk”) bonds and share offerings promised yields in the 6 to 10% range. As long as prices were high and the plays were marginally profitable, risks were downplayed and capital was almost unlimited. Two years into the oil-price collapse, capital is more limited because banks and investors have been burned.
Producers continue the mantra that costs keep going down and well performance keeps getting better. Those with some history and perspective, however, know and remember that they always say that but the balance sheets never reflect the claims.
In 1996, the late Aubrey McClendon made the following statement about the Louisiana Austin Chalk play:
“Today, because of improvements in horizontal drilling technology, you’ve got a play that could be the largest onshore play in the country, not only in size of potential reserves but also in a real extent.”
That play was a total failure for McClendon’s Chesapeake Energy Corporation and today Chesapeake is on the verge of bankruptcy for the second time.
People want to believe that things keep getting better and that they won’t have to change their behavior—even if these beliefs defy common sense and the laws of nature.
Slouching Toward Bethlehem
The oil-price collapse that began in July 2014 was technically about over-production. A surplus of unconventional oil from the United States and Canada, and a hiatus in geopolitical outages upset the world market balance and pushed prices lower.
Some have tried to emphasize the role that demand played. But there is simply no comparison to the 10 mmbpd demand destruction that occurred between 1979 and 1983 nor is this anything like the 2.6 mmbpd demand decline in 2008-2009.
This price collapse is simply different than the others. It more fundamental. The economy has been pushed beyond its limits.
Post-Financial Collapse monetary policies, the cumulative cost of nearly four decades of debt-financed growth, and the return of higher oil prices have exhausted the economy. Most debt is non-productive, interest rates cannot be increased, and 2016′s low oil prices are still one-third higher than in the 1990s (in 2016 dollars).
Producers and oil-field service companies are on life support. One-third of U.S. oil companies are in default. Yet some analysts who have no experience working in the oil industry proclaim break-even prices below $40 per barrel and breathlessly predict that the business will come roaring back when prices exceed $50. Producers don’t help with outrageous claims of profitability at or below current oil prices that exclude costs and are not generally applicable to their portfolios.
As a result, the public and many policy makers believe that tight oil is a triumph of American ingenuity and that energy will be cheap and abundant going forward. The EIA forecasts that U.S. crude oil production will exceed the 1970 annual peak of 9.6 mmbpd by 2027 and that tight oil will account for almost 6 million barrels per day. Although I have great respect for EIA, these forecasts reflect a magical optimism based on what is technically possible rather than what is economically feasible.
Renewable energy will be increasingly part of the landscape but its enthusiasts are also magical thinkers.
In 2015, renewables accounted for only 3% of U.S. primary energy consumption. No matter the costs nor determination to convert from fossil to renewable energy, a transition of this magnitude is unlikely in less than decades.
Solar PV and wind provide much lower net energy than fossil fuels and have limited application for transport–the primary use of energy– without lengthy and costly equipment replacement. The daunting investment cost becomes critically problematic in a deteriorating economy. Although proponents of renewable energy point to falling costs, more than half of all solar panels used in the U.S. are from China where cheap manufacturing is financed by unsustainable debt.
It is telling that energy and its cost can hardly be found among the endless discussions about the economy and its failure to grow. Technology optimists have disparaged the existence of an energy problem since at least the 1950s. Neither unconventional oil nor renewable energy offer satisfactory, reasonably priced, timely solutions to the dilemma.
As political leaders and economic experts debate peripheral issues, the public understands that there is something horribly wrong in the world. It is increasingly difficult for most people to get by in a failing global economy. That is why there are political upheavals going on in Britain, the United States and elsewhere.
The oil industry is damaged and higher prices won’t fix it because the economy cannot bear them. It is unlikely that sustained prices will reach $70 in the next few years and possibly, ever.
The British exit from the European Union adds another element of risk for investors. Lack of investment will inevitably lead to lower production, supply deficits and price spikes. These will further damage the economy.
The future for oil prices and the global economy is frightening. I don’t know what beast slouches toward Bethlehem but I am willing to bet that it does not include growth. The best path forward is to face the beast. Acknowledge the problem, stop looking for improbable solutions that allow us live like energy is still cheap, and find ways to live better with less.
—————————————————————————-
*J.K. Galbraith, 2014, The End of Normal, p.54. Much of the economic interpretation in this post is based on Galbraith’s work.
**J.K. Galbraith, 2014, The End of Normal, p.57.
Art Berman
Petroleum Geologist and Professional Speaker
Visit my website for more information: artberman.com
5 Responses to Art Berman: Oil Prices Lower Forever? Hard Times In A Failing Global Economy