Hall and Lambert: EROI of different fuels and the implications for society

[ Excerpts from the Hall, Lambert, and Balogh EROI paper. You may want to read the original paper here since I’ve left out charts, figures, and text.  In my opinion, EROI is important because it is  due diligence – society ought to find out if there is any energy resource that can replace oil for transportation, since without transportation you can not build electricity-producing contraptions and you’re wasting rare earth minerals, steel, fossil fuels, and other finite materials making them.  It is unlikely transportation can be electrified for reasons explained in my book When Trucks Stop Running: Energy and the future of transportation

If decreasing numbers of trucks, rail, and ships will be running if oil can’t be replaced or heavy-duty vehicles electrified, our remaining energy should be used to clean up nuclear waste, superfund sites, the half million leaking mines, and other messes since future generations won’t have the energy to do so, lower our population ASAP to get within the carrying capacity of a non-fossil-fueled civilization (Plan B is bullets and disease), change our culture from one of consumption to one of sharing, teach different skills in schools to prepare the youngest generation, and prepare for going back to the age of wood (i.e. more insulation, gravity based water and sewage infrastructure that doesn’t require electric pumps where possible, and so on).    Alice Friedemann   www.energyskeptic.com ]

Charles A.S. Hall, Jessica G. Lambert, Stephen B. Balogh. 2014. EROI of different fuels and the implications for society. Energy Policy 64 (2014) 141–152

In the nations examined, the EROI for oil and gas has declined during recent decades. Lower EROI for oil may be masked by natural gas extracted/used in oil production. The EROI trend for US coal is ambiguous; the EROI for Chinese coal is declining.

All forms of economic production and exchange involve the use of energy directly and in the transformation of materials. Until recently, cheap and seemingly limitless fossil energy has allowed most of society to ignore the importance of contributions to the economic process from the biophysical world as well as the potential limits to growth.

This society must have an energy surplus for there to be division of labor, creation of specialists and the growth of cities, and substantially greater surplus for there to be wide-spread wealth, art, culture and other social amenities. Economic fluctuations tend to result, directly or indirectly, from variations in a society’s access to cheap and abundant energy

Today, fossil fuel re and economic expansion are eventually constrained by these higher prices (Jones et al., 2004). Economic growth and stability is dependent on not only the total quantity of energy accessible to society but also the cost of this energy to different sectors of that society.sources are among the most important global commodities and are essential for the production and distribution of the rest.

Economic production, exchange and growth requires work and consequently a steady and consistent flow of energy to do that work. Longer intervals of sustained economic growth in countries and the world have been punctuated by numerous oscillations; i.e. there are periods of economic expansion but also recession. In general, the growth of real GDP is highly correlated with rates of oil consumption (Murphy et al., 2011). Four out of the five recessions experienced since 1970 can be explained by examining oil price shocks (Hamilton, 2009; Hall and Groat, 2010; Jones et al., 2004). During periods of recession, oil prices tend to decline, eventually encouraging increased consumption. Alternatively, during periods of expansion, oil prices usually increase and higher energy consumption and economic expansion are eventually constrained by these higher prices (Jones et al., 2004).

Economic growth and stability is dependent on not only the total quantity of energy accessible to society but also the cost of this energy to different sectors of that society increases in the economic cost of energy (e.g. from five to ten percent) result in the diversion of funds from what is typically devoted to discretionary spending to energy acquisition (Hall and Klitgaard, 2012). Consequently, large changes in energy prices influence economies strongly.

Energy return on investment (EROI) is a means of measuring the quality of various fuels by calculating the ratio between the energy delivered by a particular fuel to society and the energy invested in the capture and delivery of this energy.

Much of the current EROI analysis literature tends to focus on the net or surplus for a given project, industry, nation, fuel, or resource, for example recent discussions on the “energy break even” point of EROI for corn based ethanol, i.e. whether the EROI is greater than 1:1. The apparently different results from this seemingly straightforward analysis generated some controversy about the utility of EROI. But, the variation in these findings is mostly the result of the choice of direct and indirect costs associated with energy production/extraction included within the EROI calculations: i.e. the boundaries of the denominator (Hall et al., 2011). The possible boundaries of the various net energy assessments evaluated in this study are illustrated in Fig. 1.

These and other boundary issues are addressed in Murphy et al.’s recent paper, Order from Chaos: A Preliminary Protocol for Determining the EROI of Fuels (Murphy et al., 2011). We clarify further the boundaries used in the EROI calculations given here into the following categories derived

Our research and that of Dale (2010) summarizes EROI estimates for the thermal energy delivered from various fossil fuels and also the electric power generated using fossil fuel and various other energy technologies. These initial estimates of general values for contemporary EROI provide us with a beginning on which we and others can build as additional and better data become available. We have fairly good confidence in the numbers represented here, in part because various studies tend to give broadly similar results.

Values from different regions and different times for the same fuels, however, can give quite different results. Given this, we present these values with considerable humility because there are no government-sponsored programs or much financial support to derive such numbers.

EROI values for our most important fuels, liquid and gaseous petroleum, tend to be relatively high. World oil and gas has a mean EROI of about 20:1

The EROI for the production of oil and gas globally by publicly traded companies has declined from 30:1 in 1995 to about 18:1 in 2006 (Gagnon et al., 2009).

The EROI for discovering oil and gas in the US has decreased from more than 1,000:1 in 1919 to 5:1 in the 2010s, and for production from about 25:1 in the 1970s to approximately 10:1 in 2007 (Guilford et al., 2011).

Alternatives to traditional fossil fuels such as tar sands and oil shale (Lambert et al., 2012) deliver a lower EROI, having a mean EROI of 4:1 (n of 4 from 4 publications) and 7:1 (n of 15 from 15 publication) (Fig. 2).

It is difficult to establish EROI values for natural gas alone as data on natural gas are usually aggregated in oil and gas statistics.

The other important fossil fuel, coal, has a relatively high EROI value in some countries (U.S. and presumably Australia) and shows no clear trend over time. Coal internationally has a mean EROI of about 46:1 (n of 72 from 17 publications) (see Lambert et al., 2012 for references). Cleveland et al. (2000) examined the EROI values for coal production in the United States. They found a general decline from an approximately 80:1 EROI value during the mid 1950s to 30:1 by the middle of the 1980s. Coal, however, regained its former high EROI value of roughly 80:1 by 1990. This pattern may reflect an increase in less costly surface mining. The energy content of coal has been decreasing even though the total tonnage has continued to increase (Hall and Klitgaard, 2012). This is true for the US where the energy content (quality) of coal has decreased while the quantity of coal mined has continued to increase.

The maximum energy from US coal seems to have occurred in 1998 (Hall et al., 2009; Murphy and Hall, 2010).

Meta-analysis of EROI values for nuclear energy suggests a mean EROI of about 14:1 (n of 33 from 15 publications)(see Lambert et al., 2013 for references). Newer analyses need to be made as these values may not adequately reflect current technology or ore grades. Whether to correct the output for its relatively high quality is an unresolved issue and a quality correction for electricity appears to contribute to the relatively high value given here.

Hydroelectric power generation systems have the highest mean EROI value, 84:1 (n of 17 from 12 publications), of electric power generation systems (see Lambert et al., 2012 for references). The EROI of hydropower is extremely variable although the best sites in the developed world were developed long ago (Hall et al., 1986).

We calculate the mean EROI value for ethanol from various biomass sources using data from 31 separate publications covering a full range of plant-based ethanol production e.g. EROI of 0.64:1 Pimentel and Patzek, 2005 for ethanol produced from cellulose from wood to EROI of 48:1 for ethanol from molasses in India (Von Blottnitz and Curran, 2007)). These values result in a mean EROI value of roughly 5:1 with an n of 74 from 31 publications (Fig.

Diesel from biomass is also quite low (2:1 with an n of 28 from 16 publications) (see Lambert et al., 2012 for references). The average is skewed in a positive direction by a handful of outliers (four EROI figures are above 30:1)

Wind power has a high EROI value, with the mean perhaps as high as 18:1 (as derived in an existing meta-analysis by Kubiszewski et al., 2010) or even 20:1 (n of 26 from 18 publications) (see Lambert et al., 2012 for references). The value in practice may be less due to the need for backup facilities.

We believe that outside certain conditions in the tropics most ethanol EROI values are at or below the 3:1 minimum extended EROI value required for a fuel to be minimally useful to society.

It should be noted that several recent studies that have broader boundaries give EROI values of 2 to 3:1 (Prieto and Hall, 2012; Palmer, 2013; Weissbach et al., 2013), although these are not weighted for the higher quality of the electricity when compared with thermal energy input.

A positive aspect of most renewable energies is that the output of these fuels is high quality electricity. A potential drawback is that the output is far less reliable and predictable. EROI values for PV and other renewable alternatives are generally computed without converting the electricity generated into its “primary energy- equivalent” (Kubiszewski et al., 2009) but also without including any of the considerable cost associated with the required energy back-ups or storage.

Poisson and Hall found that the EROI of conventional oil and gas has decreased since the mid-1990s from roughly 20:1 to 12:1, a 40% decline. The EROI of conventional combined oil-gas- tar sands has also decreased during this same period from 14:1 to 7.5:1, a decline of 46% (Poisson and Hall). Poisson and Hall’s estimated EROI values for Canadian oil and gas are about half those calculated by Freise and their rate of decline is somewhat less rapid (Freise, 2011; Poisson and Hall).

Poisson and Hall ‘s estimate of the EROI of tar sands is relatively low, around 4.5 (a conservative (i.e. high) estimate, using only the front end of the life-cycle); incorporating tar sands into total oil and gas estimates decreases the EROI of the oil and gas extraction industry as a whole (Poisson and Hall). These estimates would be lower if more elements of the full life-cycle (e.g. environmental impact) were included in the calculation.

Are studies at the regional level comparable to those at the national level and how do these “size up” when presented next to “international” studies that include a small subset of representative countries?

Energy analysts are not in agreement on what indirect costs should and should not be included in an EROI assessment. When complete systems are analyzed for solar PV installations, their financing, their operations and maintenance costs and their backups are included the energy costs are about three times larger than for just the modules and inverters. One very contentious indirect cost is the inclusion or exclusion of the energy cost of supporting human labor.

New work on the EROI for oil and gas produced by horizontal drilling and rock fracturing indicate that the EROI can be very high, in part because it is not necessary to pressurize the fields (e.g. Aucott and Mellilo 2013; Moeller and Murphy personal communication; Waggoner personal communication) but that these high values are likely to decline substantially as production is moved off the “sweet spots”.

The EROI for coal production in the US declined from 80:1 in the 1950s to 30:1 in the 1970s (Cleveland et al., 1984). During this time period, coal was mined almost exclusively in the Appalachian mountain region areas of the US using a combination of room and pillar mines with conventional and continuous mining methods. The coal initially extracted from these locations was a combination of anthracite and high quality bituminous coal, coal with high BTUs/ton. As the best coal was used first, the EROI for coal decreased over time.

The EROI of US coal returned to 80:1 by about 1990. This pattern reflects a shift in the quality of coal extracted, the technology employed in the extraction process and especially the shift from underground to surface mining. A shift in mining location, from Appalachia to the central and northern interior states of Montana and Wyoming and extraction method, from underground to surface mining (area, contour, auger, and mountain top mining techniques) have resulted in less energy required to mine and beneficiate coal. The energy content of the coal extracted, however, has decreased. The coal currently mined is lower-quality bituminous and sub-bituminous coal with much lower BTUs/ton (Hall et al., 1986; Hall and Klitgaard, 2012) The increased efficiency of surface mining seems to just about compensate for the decline in the quality of the coal mined.

Discretionary spending decreased with the energy price increases from 2007 to the summer of 2008. Oil prices hit an all time high of $147 per barrel in the summer of 2008 (Read, 2008). This extra 5-10% “tax” from increased energy prices was added to the US (and other) economy as it had been in the 1970s, and much discretionary spending disappeared (Hall et al., 2008). Speculation in real estate (in the US) was no longer desirable or possible as consumers tightened their belts because of higher energy costs (Hall and Klitgaard, 2012). The stock market crashed in September 2008 reducing market value by $1.2 trillion and forcing the Dow to suffer its “biggest single-day point loss ever” (Twin, 2008), and most Western economies have essentially stopped growing since.

Much of the discussion about “peak coal” (e.g. Patzek and Croft, 2010) involves changing mining technology and capacity, rather than the quantity and quality of coal that remains available for extraction. Peak coal will likely have the greatest impact on the world’s largest coal user, China. Nations with abundant untapped coal resources (i.e. the US, Australia and Russia) are likely to be less affected. The total recoverable coal estimated for the US alone is approximately 500 billion tons.

US coal production in 2009 was about one billion tons. Although it is difficult to predict future production technology, environmental issues, consumption patterns and changes in EROI, it appears that coal may be abundantly available through the next century.

Renewable energy sources: are not sufficiently “energy dense”, tend to be intermittent, lack transportability, most have relatively low EROI values (especially when corrections are made for intermittency), and currently, lack the infrastructure that is required to meet current societal demands.

If we were to replace traditional nonrenewable energy with renewables, which seems desirable to us in the long run, it would require the use of energy-intensive technology for their construction and maintenance. Thus it would appear that a shift from nonrenewable to renewable energy sources would result in declines in both the quantity and EROI values of the principle energies used for economic activity.

Although wind, apparently relatively favorable from an EROI perspective and photovoltaic (PV) energy, are currently the world’s fastest growing renewable energy sources, they continue to account for less than one percent of the global energy portfolio (REN21, 2012). Nevertheless there are many informal reports of PV reaching “price parity” with fossil fuels and to many the future of PV is very bright.

Proponents of EROI assessments using actual operational installations (rather than laboratory estimates) believe that, in order to portray renewable energy technology accurately, it is necessary to make note of the fact that these technologies are dependent upon (i.e. constructed and maintained using and therefore subsidized by) high EROI fossil fuels. Higher EROI values found in conceptual studies often result from assumptions of more favorable conditions (within simulations) than those actually experienced in real life. For example, English wind turbines were found to operate considerably fewer hours per month than anticipated (Jefferson, 2012).

Kubiszewski et al. (2010) infer that variations in EROI values, in the case of reported EROI values for wind energy, (between process and input output analyses) stems from a greater degree of subjective system boundary decision-making by the process analyst, resulting in the exclusion of certain indirect costs.

Also of concern is that wind and PV technology are not “base load technologies”, meaning that future large scale deployment, beyond 20 percent of the grid capacity, will likely require the construction of large, energy intensive storage infrastructures which, if included within EROI assessments, would likely reduce EROI values considerably. In the case of wind, the cost for inclusion within a wind EROI analysis requires not only the initial capital costs per unit output but also the backup systems required for the 70 or so percent of the time when insufficient wind is blowing. Thus, the input for an EROI analysis of wind and PV technology is by and large “upfront” capital costs. This is in sharp contrast to the less well known “return” over the lifespan of the system. Therefore, a variable referred to as “energy payback time” is often employed when calculating the EROI values of wind and other renewable energy sources. This is the time required for the renewable energy system to generate the same amount of energy that went into the creation, maintenance, and disposal of the system.

The boundaries utilized to define the energy payback time are incorporated into most renewable EROI calculations. Other factors influencing wind and PV EROI values include energy storage, grid connection dynamics and variations in construction and maintenance costs associated with the installation location. For example, off-shore turbines, while located in wet salty areas with more reliable energy-generating winds, require replacement more often. Turbines located in remote mountainous areas require long distance grid connections that result in energy loss and reduced usable energy values (Kubiszewski et al., 2010).

Policy implications

In conclusion, the EROI for the world s most important fuels, oil and gas, has declined over the past one to two decades for all nations examined. It remains possible that the relatively high EROI values for the natural gas extracted during, and often used for, the production of oil may mask a much steeper decline in the EROI of oil alone. Declining EROI is probably already having a large impact on the world economy (Murphy and Hall, 2010; Tverberg, 2012). As oil and gas provide roughly 60-65% of the world’s energy, this will likely have enormous economic consequences for many national economies. Coal, although abundant, is very unevenly distributed, has large environmental impacts and has an EROI that depends greatly on the region mined.

The decline in EROI among major fossil fuels suggests that in the race between technological advances and depletion, depletion is winning. Past attempts to rectify falling oil production i.e. the rapid increase of drilling after the 1970 peak in oil production and subsequent oil crises in the US only exacerbated the problem by lowering the net energy delivered from US oil production (Hall and Cleveland, 1981). Increasing prices, thought by most economists to negate depletion through increasing incentives for exploitation, cannot work as EROI approaches 1:1, and even now has made oil too expensive to support the high economic growth it once did. It would be tempting

from a net energy perspective, to recommend that we replace fossil fuels with renewable energy technologies as the EROI for fossil fuel falls to a level where these technologies become competitive. While EROI analyses generate numerical assessments using quantitative data that include many production factors, they do not include other important data such as climate change, air quality, health benefits, and other environmental qualities that are considered “externalities” to these analyses.

The energy intensive carbon capture and sequestration (CCS) required to reduce fossil fuel emissions to levels equivalent with that of wind or PV electricity production would reduce the final coal EROI value considerably ((e.g. Akai et al. 1997 in Dale, 2010 and Lund and Biswas, 2008). EROI figures do not take into account the high life-cycle greenhouse gas emissions from thermal electricity production, and coal fired systems in particular (Raugei et al., 2012). This could, with difficulty, be worked into future, more comprehensive EROI calculations.

Most alternative renewable energy sources appear, at this time, to have considerably lower EROI values than any of the non-renewable fossil fuels. Wind and photovoltaic energy are touted as having substantial environmental benefits. These benefits, however, may have lower returns and larger initial carbon footprints than originally suggested (e.g. the externalities associated with the mining of neodymium and its subsequent use in wind turbine construction). The energy costs pertaining to intermittency and factors such as the oil, natural gas and coal employed in the creation, transport and implementation of wind turbines and PV panels may not be adequately represented in some cost-benefit analyses. On the positive side, the fact that wind and PV produce high quality electricity needs to be considered as well.

Thus society seems to be caught in a dilemma unlike anything experienced in the last few centuries. During that time most problems (such as needs for more agricultural output, worker pay, transport, pensions, schools and social services) were solved by throwing more technology investments and energy at the problem. In many senses this approach worked, for many of these problems were resolved or at least ameliorated, although at each step populations grew so that more potential issues had to be served. In a general sense all of this was possible only because there was an abundance of cheap (i.e. high EROI) high quality energy, mostly oil, gas or electricity. We believe that the future is likely to be very different, for while there remains considerable energy in the ground it is unlikely to be exploitable cheaply, or eventually at all, because of its decreasing EROI.

Alternatives such as photovoltaics and wind turbines are unlikely to be nearly as cheap energetically or economically as past oil and gas when backup costs are considered.

In addition there are increasing costs everywhere pertaining to potential climate changes and other pollutants. Any transition to solar energies would require massive investments of fossil fuels.

Despite many claims to the contrary- from oil and gas advocates on the one hand and solar advocates on the other-we see no easy solution to these issues when EROI is considered.

If any resolution to these problems is possible it is probable that it would have to come at least as much from an adjustment of society’s aspirations for increased material affluence and an increase in willingness to share as from technology.

Unfortunately recent political events do not leave us with great optimism that such changes in societal values will be forthcoming.

Posted in EROEI Energy Returned on Energy Invested | Tagged , , , , , | Comments Off on Hall and Lambert: EROI of different fuels and the implications for society

How Nixon and the Catholic Church conspired to stop actions to prevent overpopulation

[ All of what follows is from the article below.  Mumford makes the case that:

“Had the recommendations of NSSM 200 been implemented in 1975, the world would be very different today. The prospects would have improved for every nation and people to be significantly more secure. There would be less civil and regional warfare, less starvation and hunger, a cleaner environment and less disease, greater educational opportunities, expanded civil rights, especially for women, and a political climate more conducive to the expansion of democracy.”  

In other words, we wouldn’t be 6.5 billion over the carrying capacity of the planet, and 235 million over the carrying capacity of the United States (~100 million).  There’d be more ground water, fossil fuels would have lasted decades longer, there’d be less top soil erosion and pollution, less of the (rain)forest would be clearcut — really — can you think of a single problem that wouldn’t benefit from fewer people?   

But hey, Nixon wanted to get reelected, and made a deal with the Catholic Church that he’d back off on population measures in exchange for more Catholic voters.  Republicans have extended that deal to right-wing fundamentalists to remain in power.

Alice Friedemann   www.energyskeptic.com  author of “When Trucks Stop Running: Energy and the Future of Transportation, 2015, Springer]

Mumford, S. D. February 5, 2012. Excerpts from: The Life and Death of NSSM 200: How the Destruction of Political Will Doomed a U.S. Population Policy. Church and State.

“Editor’s note: Given this November’s U.S. Presidential election and the Catholic Church’s immense stake in the outcome, we are publishing a series of articles by our chairman Dr. Stephen D. Mumford, founder and President of the North Carolina-based Center for Research on Population and Security. The following article draws from selected passages of Dr. Mumford’s seminal book, The Life and Death of NSSM 200: How the Destruction of Political Will Doomed a U.S. Population Policy (1996). It reveals the anti-democratic and anti-American machinations of the Vatican that killed the United States’ National Security Study Memorandum 200 (NSSM 200) report and succeeded in destroying American political will to deal with the overpopulation problem. This article is as relevant and revealing today as it was when it was first published by Focus in 1998.

The 1960s saw a surge in American public awareness of the world population problem. The invention of the contraceptive pill in 1960 stimulated broad public debate on birth control and the need for it.

When Pope John XXIII created the Papal Commission on Population and Birth Control in 1963, he gave the world hope that the Church was about to change its position on birth control. After all, why would the Vatican study the issue if the Church was not in a position to change its teaching on birth control?

In 1968, Paul Ehrlich published his book, The Population Bomb, the most successful book of its kind, ever.[1] That same year, the journal Science published one of its most controversial articles ever, an essay by Garrett Hardin titled, “The Tragedy of the Commons,”[2] which sparked much discussion of the overpopulation threat.

Among mainstream protestant denominations, the Presbyterians were one of the first to call for a forthright response to the problem. In 1965, the General Assembly of the Presbyterian Church (U.S.A.) urged “the government of the United States to be ready to assist countries who request help in the development of programs of voluntary planned parenthood as a practical and humane means of controlling fertility and population growth.”

In 1971, it recognized that reliance on private, voluntary decisions:  “will not be sufficient to provide the necessary limitation of population growth unless there is a radical and rapid change in the attitudes and desires. The Church must commit itself to effecting this change. The assumption that couples have the freedom to have as many children as they can support should be challenged. We can no longer justify bringing into existence as many children as we desire. Our corporate responsibility to each other prohibits this. Given the population crisis we must recognize and teach, beginning with ourselves, that man has an obligation to limit the size of his family.”

And in 1972, the Presbyterians called on governments “to take such actions as will stabilize population size…. We who are motivated by the urgency of over-population rather than the prospect of decimation would preserve the species by responding in faith: Do not multiply—the earth is filled!”[3]

This kind of increasing out cry for action made it safe—almost compelling—for American political leadership to identify with the concept of population growth control and to call for new programs to deal with the problem.

It was in this climate of rising concern that President Nixon sent to Congress his “Special Message on Problems of Population Growth.” Special messages to the Congress are exceedingly rare and this was the first such message on population. This action punctuated the beginning of the peak of American political will to deal with the mounting population crisis. The message, for the first time, committed the United States to confronting the population problem. Also rare, this special message was approved by the Congress. Its passage was bipartisan, indicating broad political support for American political action to combat this problem. The message was a water shed development, yet few recall it.

The most important element of the Special Message was its creation of the Commission on Population Growth and the American Future. During the signing of the bill establishing the Commission, President Nixon commented on the broad political and public support: “I believe this is an historic occasion. It has been made historic not simply by the act of the President in signing this measure, but by the fact that it has had bipartisan support and also such broad support in the Nation.”

The 24 member Commission was chaired by John D. Rockefeller 3rd. It ordered more than 100 research projects which collected and analyzed data that would make possible the formulation of a comprehensive U.S. population policy. After 2 years of intense effort, the Commission completed a 186-page report titled, Population and the American Future which offered more than 70 recommendations. The recommendations were a bold but sane response to the challenges we faced in 1973. For example, they called for: passage of a Population Education Act to help school systems establish well-planned population education programs; sex education to be widely available for all, including minors, at government expense if necessary; vastly expanded research in many areas related to population-growth control; and the elimination of all employment of illegal aliens.

The recommendations represented the conclusions of some of the nation’s most capable people. The scientists who completed the Commission’s 100 research projects were among the best in their fields. These recommendations are included in this book because it is important for the reader to know what the U.S. response to the population problem could have been and should have been. On May 5, 1972, at a ceremony held for the purpose of formally submitting the Commission’s findings and conclusions, President Nixon publicly renounced the report.[4] This was 6 months before the President faced re-election and he was feeling intense political heat from one particularly powerful, foreign-controlled special interest group—the hierarchy of the Roman Catholic Church. Nothing happened toward implementation of any of the more than three score recommendations that collectively would have created a comprehensive U.S. population policy. Not one recommendation was ever adopted. To this day, the U.S. has no population policy, one of the few major countries with this distinction.

Had these 70 carefully reasoned recommendations been adopted as U.S. population policy in 1973—or if even a dozen or so of the most important ones had been adopted—America would be very different today. We would be more secure, subjected to less crime, better educated now with even greater educational opportunities ahead, living with less stress in a healthier environment, with more secure employment and greater employment opportunities, with better medical care, all in a physically less crowded America.

We would have set an example for the world, and we have good reason to believe that much of the world would have followed. Ironically, the American people were better prepared to accept these recommendations in 1973 than in 1994, even though world population during this brief period has mushroomed a horrendous 43 percent. For the past 20 years, all of us have been subjected to an intense disinformation program staged by the opposition to raise doubts in each of us regarding the seriousness of the population problem.

Despite the intense opposition President Nixon encountered in the wake of the Rockefeller Commission Report, his assessment of the gravity of the overpopulation problem and his desire to deal with it evidently remained unchanged. On April 24, 1974, nearly 18 months after his re-election, in the single most significant act of his presidency regarding the population crisis, Mr. Nixon directed, in NSSM 200, that a comprehensive new study be undertaken to determine the “Implications of World Population Growth for U.S. Security and Overseas Interests.” The report of this study would become one of the most important documents on world population growth ever written.

In NSSM 200, National Security Advisor Henry Kissinger, acting for the President, directed the Secretaries of Defense and Agriculture, the Director of the Central Intelligence Agency, the Deputy Director of State and the Administrator of the Agency for International Development (AID), to undertake the population study jointly. The report on this study was completed on December 10, 1974 and circulated to the designated Secretaries and Agency heads for their review and comments.

On August 9, 1974, Gerald Ford succeeded to the presidency. Revisions of the study continued until July, 1975. On November 26, 1975, the 227-page report and its recommendations were endorsed by President Ford in NSDM 314: “The President has reviewed the interagency response to NSSM 200…,” wrote the new National Security Advisor, Brent Scowcroft. “He believes that United States leadership is essential to combat population growth, to implement the World Population Plan of Action and to advance United States security and overseas interests. The President endorses the policy recommendations contained in the Executive Summary of the NSSM 200 response…”

President Ford, recognizing the gravity of the situation, directed NSDM 314 not only to the Departments and Agencies cited above. He also directed it to the Secretaries of Health, Education and Welfare and Treasury, the Director of Management and Budget, the Chairmen of the Joint Chiefs of Staff, the Council of Economic Advisers, and the Council on Environmental Quality. He made it clear to all of the relevant Departments and Agencies of the United States Government that he intended this to become the foundation of population policy for our government.

Mr. Ford assigned responsibility for further action to the National Security Council (NSC): “The President, therefore, assigns to the Chairman, NSC Undersecretaries Committee, the responsibility to define and develop policy in the population field and to coordinate its implementation beyond the NSSM 200 response.” To this day, the policy set forth in NSDM 314 has not been officially rescinded.

NSSM 200 itself is a 227-page document. The report requested in NSSM 200 bears the title, NSSM 200: Implications of Worldwide Population Growth for U.S. Security and Overseas Interests. It consists of a 29-page Executive Summary and a two-part report 198 typescript pages in length. The report was never printed or published. It was typewritten, double-spaced.

The potential importance of this document to U.S. security and the security of all nations was and remains immense. Both the findings and the recommendations have become increasingly relevant and urgent over the years. For this reason I have included the complete document here.

The NSSM 200 study details how and why continued rapid world population growth gravely threatens U.S. and global security. It also provides a blueprint for the U.S. response to this burgeoning problem, reflecting the deep concern of those who produced the report. Their strategy is complex, raising difficult questions. Some suggested policies are necessarily bold and the report’s authors urged that it be classified for five years to prepare the American public for full acceptance of the goals proposed. However, it remained classified for 14 years for reasons that are unclear.

The intense concern of the authors is clearly evident. NSSM 200 reports:

There is a major risk of severe damage [from continued rapid population growth] to world economic, political, and ecological systems and, as these systems begin to fail, to our humanitarian values.”[5] “…World population growth is widely recognized within the Government as a current danger of the highest magnitude calling for urgent measures.”[6] “…It is of the utmost urgency that governments now recognize the facts and implications of population growth, determine the ultimate population sizes that make sense for their countries and start vigorous programs at once to achieve their goals.[7]

NSSM 200 made the following recommendations, to mention a few:

  • The U.S. would provide world leadership in population growth control.[8]
  • The U.S. would seek to attain its own population stability by the year 2000.[9] This would have required a one-child family policy for the U.S., thanks to the phenomenon of demographic momentum, a requirement the authors well understood (the Chinese did not adopt their one-child family policy until 1977).
  • Have as goals for the U.S.: making family planning information, education and means available to all people of the developing world by 1980,[10] and achieving a 2-child family in the developing countries by 2000.”[11]
  • The U.S. would provide substantial funds to help achieve these goals.[12]

But, as in the case of the Rockefeller Commission Report, the implementation of recommendations made in NSSM 200—approved by President Ford, with his approval communicated to all relevant Departments and Agencies in our government—was halted mainly through the influence of the same opposition that had precluded adoption of the Rockefeller Commission recommendations.

Had the recommendations of NSSM 200 been implemented in 1975, the world would be very different today. The prospects would have improved for every nation and people to be significantly more secure. There would be less civil and regional war fare, less starvation and hunger, a cleaner environment and less disease, greater educational opportunities, expanded civil rights, especially for women, and a political climate more conducive to the expansion of democracy.

Excerpts from: Chapter 5: “What Happened to the Momentum?”

November 26, 1975 marked the end of the peak of American political will to deal with the overpopulation problem. This was the day that President Ford approved NSDM 314, committing the U.S. to a bold policy of population growth control. The peak lasted less than 6 years and then the momentum plummeted and our commitment has since diminished every year.

As noted in the Introduction, when Mr. Nixon received the report, Population and the American Future, from Mr. Rockefeller in May 1972, the President publicly rejected it—just six months before he faced reelection. In his book, Catholic Bishops in American Politics, Timothy A. Byrnes, assistant professor of political science at the City College of New York, states,

Hoping to attract Catholics to his reelection campaign, Nixon publicly disavowed the pro-choice findings of his own presidential commission on population in 1972. He communicated that disavowal in an equally public-letter to Cardinal Terence Cooke [of New York], a leading spokesman for the bishops’ opposition to abortion…. The Catholic vote was especially important to Nixon and his publicists in 1972. They referred to Catholic support of the Republican ticket in order to refute the notion that Nixon had formed his new coalition by cynically appealing to the baser motives of Southern whites. They relied on Catholic participation in the new majority, in other words, as proof that the “social issue” was much more than repackaged racial prejudice. As one of these publicists, Patrick Buchanan, put it: “Though his critics were crying ‘Southern Strategy,’ the President’s politics and policy decisions were not going unnoticed in the Catholic and ethnic communities of the North, East, and Midwest.[13]

Nixon was convinced that if he were to win in 1972, he must carry Southern whites and northern Catholics. He looked to the Catholic bishops for their support. Byrnes goes on to say, “Regardless of what it is based on, however, a perception that the bishops can influence votes has been enough to make candidates sensitive to the bishops.” And as the saying goes, in politics perceptions often create their own realities. He continues,

The bishops have more than just access to Catholic voters, of course. They also have virtually unparalleled institutional resources at their disposal. ‘If you are a bishop,’ Walter Mondale’s 1984 campaign manager said to me, ‘you’ve got some pretty substantial organizational capabilities…. You’ve got a lot of people, you’ve got money, places to meet…. You’ve got a lot of things that any good politician would like to have at his disposal.’ You also have the ability, if you are the Catholic hierarchy collectively, to create or fortify movements in support of your preferred policy positions.[14]

Byrnes argues that: the bishops are able to bring virtually unrivaled resources to any cause or effort they decide to support; the bishops committed those resources to the fight against abortion in the 1970s; in the process they played a key role in the creation and maintenance of a large social movement. This movement was the so-called Religious New Right movement. This movement was still in its infancy at the time of Nixon’s reelection bid in 1972 but the bishops were highly organized, single minded and prepared to deal. In his letter to Cardinal Cooke, Nixon made it clear that he too was prepared to deal. Nixon was reelected with the bishops’ support.

During the year that followed the presentation of the Rockefeller Commission Report, it became clear that there would be no further response to the Commission’s recommendations. In May, 1973 a group of pioneer population activists acknowledged this inaction and asked Ambassador Adolph Schmidt to speak with his friend, Commission Chairman John D. Rockefeller 3rd. They met in June, 1973 at the Century Club in New York City. Schmidt noted his own disappointment and that of his colleagues because no program had been mounted as a result of the Commission’s recommendations. What had gone wrong? Rockefeller responded: “The greatest difficulty has been the very active opposition by the Roman Catholic Church through its various agencies in the United States.”[15]

In 1992, one Rockefeller Commission member, Congressman James Scheuer (D-NY), spoke out publicly for the first time on what had happened: “Our exuberance was short-lived. Then-President Richard Nixon promptly ignored our final report. The reasons were obvious—the fear of attacks from the far right and from the Roman Catholic Church because of our positions on family planning and abortion. With the benefit of hindsight, it is now clear that this obstruction was but the first of many similar actions to come from high places.”[16]

None of the Commission’s more than 70 recommendations was ever implemented. It is most disturbing that the American people were kept in the dark about this undemocratic and unAmerican intervention by the Vatican. It simply was not considered newsworthy because the press chose not to make it so. I believe both Catholic and non-Catholic Americans would have strongly rejected such interference in the American democratic process had they been aware of it. The quality of life for all Americans has been diminished by this unconstitutional manipulation of American policy, undertaken for the purposes of protecting papal interests.

Excerpts from: Chapter 6: “Why Did our Political Will Fade Away?”

How Population Growth Control Threatens the Papacy

Why is the Catholic Church obliged to halt legalized abortion and contraception despite the strong wishes of Americans? When our government legalized contraception and abortion, it pitted civil authority against papal authority. The Vatican demands supremacy over civil governments in matters of faith and morals, but our government has rejected this concept. Thus, while the Church is saying that family planning and abortion are evil and grave sins, our government is saying they may be good and should be used. Obviously, most American Catholics are accepting morality as defined by the government and rejecting morality as defined by the pope. As a result, papal authority is undermined.

There are a number of Catholic countries in Latin America which have abortion rates 2 to 4 times as high as the U.S. rate. But the bishops ignore abortions there. Why? Because they are illegal abortions, not legal ones. They do not threaten papal authority! Only legal abortions do, because their legalization establishes their morality. Thus, the bishops take no significant actions to halt abortions in Latin America.

In Papal Power: A Study of Vatican Control Over Lay Catholic Elites,[35] published by The University of California Press in 1980, Jean-Guy Vaillancourt, Associate Professor of Sociology at the University of Montreal, closely examines the sources of papal power and how it evolved. He found that papal authority is vital to the maintenance of papal power. This power is derived in significant part from papal authority. If the pope’s authority is diminished, papal power is diminished. However, some authority is derived from papal power and if papal power is diminished, then authority is undermined. The relationship is circular. Less authority means less power which means even less authority. With diminishing power, survival of the institution of the Roman Catholic Church in its present hierarchical form is gravely threatened. Thus, the very survival of the Vatican is threatened by programs of population growth control.

In his book, Persistent Prejudice: Anti-Catholicism in America, published by Our Sunday Visitor in 1984, Michael Schwartz summarized the position of Catholic conservatives on the abortion issue:

The abortion issue is the great crisis of Catholicism in the United States, of far greater import than the election of a Catholic president or the winning of tax support for Catholic education. In the unlikely event that the Church’s resistance to abortion collapses and the Catholic community decides to seek an accommodation with the institutionalized killing of innocent human beings, that would signal the utter failure of Catholicism in America. It would mean that U.S. Catholicism will have been defeated and denatured by the anti-Catholic host culture.[36]

In April, 1992, in a rare public admission of this threat, Cardinal John O’Connor of New York, delivering a major address to the Franciscan University of Steubenville, Ohio, acknowledged, “The fact is that attacks on the Catholic Church’s stance on abortion—unless they are rebutted—effectively erode Church authority on all matters, indeed on the authority of God himself.”[37]

This threat to papal authority was recognized decades ago by the Papal Commission on Population and Birth Control. The two tiered commission consisted of a group of 15 cardinals and bishops and a group of 64 lay experts representing a variety of disciplines. The Commission met from 1964 until 1966. According to commission member Thomas Burch, the pope himself, Pope Paul VI, assigned the commission the task of finding a way of changing the Church’s position on birth control without destroying the pope’s authority.[38]

After 2 years of studying the dilemma, the laymen voted 60 to 4 and the clerics 9 to 6 to change the Church’s teaching on birth control even though it would mean a loss of papal authority because it was the right thing to do. The minority also submitted a report to the pope.

In 1967, two newspapers published without authorization the full texts of the Papal Commission’s report. Thus the world knew that a substantial majority of the double commission had recommended liberalization on birth control.[39] The commission, of course, failed to find an acceptable way to accomplish this, and the result was the publication In 1968 of the encyclical, Humanae Vitae, which banned the use of contraception.

It was not until 1985 that Thomas Burch, in the 1960s a professor at Georgetown University and more recently chairman of Western Ontario’s Sociology Department, revealed to the world the real assignment of the commission. When Pope Paul issued Humanae Vitae, he admitted to the world that the Church cannot change its position on birth control without undermining papal authority—an unacceptable sacrifice. However, it was not until 1979, when August Bernhard Hasler published his book, How the Pope Became Infallible, that the world was given the text of the minority report which persuaded Pope Paul VI to reject the majority position.[40] Hasler was a Catholic theologian and historian who served for five years in the Vatican Secretariat for Christian Unity. During this period, he was given access to the Vatican Archives where he discovered numerous documents, which had never been studied before, that revealed the story of Vatican Council I. Dr. Hasler died suddenly at age 43, four days after writing a critical open letter to Pope John Paul II and six months after completing the second edition of this book.[41]

“The Declaration of Papal Infallibility” was a product of Vatican Council I, which preceded Vatican Council II more than a century ago, and was considered vital to the continuation of papal power. According to Vaillancourt,

During the Middle Ages and under feudalism, when the Catholic Church was a dominant institution in society, papal power grew in importance, relying often on force to attain its ends, which were political as much as they were religious. The Crusades and later on, the Inquisition, stand as the two most notorious of these violent papal ventures. But with the decline of the Portuguese and Spanish empires, with the advent of the Reformation and of the intellectual, democratic, and Industrial revolutions, the Catholic hierarchy lost much of its influence and power. Unable to continue using physical coercion, the Papacy was led to strengthen its organizational structure and to perfect a wide range of normative means of control. The declaration of papal Infallibility by the first Vatican Council (Vatican I), in 1870, was an important milestone in that direction. The stress on the absolute authority of the pope in questions of faith and morals helped turn the Church into a unified and powerful bureaucratic organization, and paved the way for the establishment of the Papacy-laity relationship as we know it today.[42]

Pope Paul VI was faced with the prospect of personally destroying the concept of papal infallibility, a concept vital to the continuation of papal power. Hasler notes, “But for Paul VI there already were infallible declarations of the ordinary magisterium on the books concerning contraception. And so, unlike the majority of his commission of experts, the pope felt bound to these declarations by his predecessors.” Thus the pope was forced to agree with the minority report of the commission.

Hasler quotes from that report:

If it should be declared that contraception is not evil in itself, then we should have to concede frankly that the Holy Spirit had been on the side of the Protestant churches in 1930 (when the encyclical Casti conubli was promulgated), in 1951 (Pius XII’s address to the midwives), and in 1958 (the address delivered before the Society of Hematologists in the year the pope died). It should likewise have to be admitted that for a half century the Spirit failed to protect Pius XI, Pius XII, and a large part of the Catholic hierarchy from a very serious error.

This would mean that the leaders of the Church, acting with extreme imprudence, had condemned thousands of innocent human acts, forbidding, under pain of eternal damnation, a practice which would now be sanctioned. The fact can neither be denied nor ignored that these same acts would now be declared licit on the grounds of principles cited by the Protestants, which popes and bishops have either condemned or at least not approved.[43]

Hasler concludes, “Thus, it became only too clear that the core of the problem was not the pill but the authority, continuity, and infallibility of the Church’s magisterium.”

This is at the very core of the world population problem. The papacy simply cannot survive the solutions—i.e. contraception, abortion, sex education, etc. The Vatican believes, probably correctly, that if the solutions to the population problem are applied, the dominance of Vatican power will soon wither. Grasping the implications of the principal of infallibility are crucial to understanding the underlying basis of the world population problem.

It is most important to understand that the Vatican leadership can visualize a world where it no longer exists. It was this chilling vision that drove the conservative members of the Vatican leadership and Pope Paul VI to reject the majority report and accept the minority report of the Papal Commission on Population and Birth Control in 1968. This vision has driven Vatican behavior on family planning ever since. Thus, the security survival of the papacy is now pitted directly against the security-survival of the United States. The Vatican simply cannot accommodate U.S. security interests.

This is not the first time our security interests have been in conflict. There are many examples of the American Catholic hierarchy supporting papal security interests at the expense of U.S. security interests. One example is the Spanish Civil War between the democratic constitutional government and the Vatican supported fascist Franco. Byrnes states, “The bishops also broke with Roosevelt over the issue of the Spanish Civil War…. The bishops instinctively supported Franco in the war…. Caught between mainstream views on foreign policy and the interests of their church, the bishops…opted for defense of the international church.”[44]

It is institutional survival that governs the behavior of the Catholic hierarchy in all matters. The claim that “morality” governs its behavior in the matters of family planning and abortion is fraudulent. The hierarchy has a long history of determining which position is in the best interests of the papacy—including the survival of the papacy—and then framing that position as the moral position. Father Arthur McCormack was for 23 years the Vatican consultant to the UN on development and population, leaving that post in 1979. In 1982, he went public with his conclusion that the Vatican position on family planning and population growth control is immoral.

American political will to deal with the overpopulation problem fell victim to the Vatican’s inexorable position. In the next chapter we will discuss how the Vatican achieved this vital objective, as it set about protecting its security interests.

Excerpts from: Chapter 7: “What was the Role of the Vatican?”

Did the Vatican succeed in changing U.S. policy on family planning, abortion and population growth control? Time magazine concluded that it most certainly did. The headline on the cover of the February 24, 1992 issue of Time magazine was “Holy Alliance: How Reagan and the Pope conspired to assist Poland’s Solidarity movement and hasten the demise of Communism.”[48] The cover article was written by Pulitzer prize-winning journalist Carl Bernstein. Bernstein listed Reagan’s “Catholic team,” noting that “The key administration players were all devout Roman Catholics—CIA chief William Casey, [Richard] Allen [Reagan’s first National Security Advisor], [William] Clark [Reagan’s second National Security Advisor], [Alexander] Haig [Secretary of State], [Vernon] Walters [Ambassador at Large] and William Wilson, Reagan’s first ambassador to the Vatican. They regarded the U.S.-Vatican relationship as a holy alliance: the moral force of the Pope and the teachings of their church combined with…their notion of American democracy.”

How the Catholic church

The Pope Called the Tune

In a section of his Time article headed “The U.S. and the Vatican on Birth Control,” Bernstein included three revealing paragraphs:

In response to concerns of the Vatican, the Reagan Administration agreed to alter its foreign-aid program to comply with the church’s teachings on birth control. According to William Wilson, the President’s first ambassador to the Vatican, the State Department reluctantly agreed to an outright ban on the use of any U.S. aid funds by either countries or international health organizations for the promotion of…abortions. As a result of this position, announced at the World Conference on Population in Mexico City in 1984, the U.S. withdrew funding from, among others, two of the world’s largest family planning organizations: the International Planned Parenthood Federation and the United Nations Fund for Population Activities.

‘American policy was changed as a result of the Vatican’s not agreeing with our policy,’ Wilson explains. ‘American aid programs around the world did not meet the criteria the Vatican had for family planning. AID [the Agency for International Development] sent various people from [the Department of] State to Rome, and I’d accompany them to meet the president of the Pontifical Council for the Family, and in long discussions they finally got the message. But it was a struggle. They finally selected different programs and abandoned others as a result of this intervention.’

‘I might have touched on that in some of my discussions with [CIA director William] Casey,’ acknowledges Pio Cardinal Laghi, the former apostolic delegate to Washington. ‘Certainly Casey already knew about our positions about that.’

Thus, Bernstein makes clear what the cadre of devout Catholics in the Reagan Administration did to protect the Papacy from the recommendations of NSSM 200. Simply put, these strategically-placed Catholic laymen, and the U.S. bishops with direct papal support and intervention, succeeded in destroying the American political will to deal with the population problem.”

References

Introduction
[1]. Ehrlich PR. The Population Bomb. New York: Ballantine Books, 1968.
[2]. Hardin G. “The Tragedy of the Commons.” Science 1968 162: 1243-8.
[3]. Beck R. “Religions and the Environment: Commitment High Until U.S. Population Issues Raised.” The Social Contract 1993:3: 76-89.
[4]. (a) Nixon, R. “Special Message to the Congress on Problems of Population Growth,” July 18, 1969. Public papers of the Presidents, No. 271, p. 521, Office of the Federal Register, National Archives, Washington, DC. 1971. (b) Commission on Population Growth and the American Future. “Population and the American Future.” Washington, DC: U.S. Government Printing Office, 1972. 176 pp.
[5]. National Security Council. NSSM 200: Implications of worldwide population growth for U.S. security and overseas Interests. Washington, DC, December 10, 1974.
[6]. Ibid., p. 184.
[7]. Ibid., p. 78.
[8]. Ibid., p. 59.
[9]. Ibid., p. 62.
[10]. Ibid., p. 148.
[11]. Ibid., p.59.
[12]. Ibid., p. 65.

Chapter 5
[13]. Brynes TA. Catholic Bishops In American Politics, Lawrenceville, New Jersey: Princeton University Press, 1991. P. 66
[14]. Ibid., p.4
[15]. Schmidt AW. Personal Communication. August 28, 1992.
[16]. Scheuer J. “A disappointing outcome: United States and World Population Trends since the Rockefeller Commission.” The Social Contract 1992; Summer: 203-206.

Chapter 6
[35] Vaillancourt JG. Papal Power: A Study of Vatican Control Over Lay Catholic Elites. Berkeley: University of California Press, 1980.
[36] Schwartz M. Persistent Prejudice: Anti-Catholicism In America. Huntington Indiana: Our Sunday Visitor, 1984. P. 132.
[37] King HV. “Cardinal O’Connor Declares That Church Teaching On Abortion Underpins All Else.” The Wanderer, April 23, 1992, p. 1.
[38] Jones A. Vatican, “International Agencies Hone Family, Population Positions.” National Catholic Reporter (reprinted in Conscience, May/June 1984. P. 7).
[39] Murphy FX, Erhart JF. “Catholic perspectives on population Issues.” Pop Bulletin 1975; 30(6): 3-3 1.
[40] Hasler AB. How the Pope Became Infallible. Garden City, New York: Doubleday, 1981.
[41] Ibid. (cover)
[42] Vaillancourt, op.cit., p. 2.
[43] Hasler, op. cit., p. 270.
[44] Byrnes, op. cit., p. 29.

Chapter 7
[48] Bernstein C. “The Holy Alliance.” Time, February 24, 1992.

Posted in Overpopulation, Population | Tagged , , | Comments Off on How Nixon and the Catholic Church conspired to stop actions to prevent overpopulation

The Hidden Costs of Oil. U.S. Senate hearing 2006.

[ This post has excerpts from the 2006 U.S. Senate hearing “The Hidden Cost of Oil”.  It is a timely reminder, now that gasoline prices are low and peak oil off the radar, that we are nowhere near the American Energy Independence bragged about currently in Congress.

I’d like to remind everyone of what James Schlesinger, former Secretary of Defense said at two Senate hearings in 2005 and 2006:

By about 2010, we should see a significant increase in oil production as a result of investment activity now under way. There is a danger that any easing of the price of crude oil will, once again, dispel the recognition that there is a finite limit to conventional oil.  In the longer run, unless we take serious steps to prepare for the day that we can no longer increase production of conventional oil, we are faced with the possibility of a major economic shock—and the political unrest that would ensue.” (1, 2)

So here is a little sanity from the past.  Some highlights from this hearing:

Senator Joseph R. Biden, Delaware (now vice-president):  Does anybody think we would be in the Middle East if, in fact, we were energy independent? Is there any American out there willing to give their son or daughter’s life if in fact, we didn’t need anything that the oil oligarchs had to offer? They get that pretty quickly.

Senator Richard Lugar, Indiana, ChairmanIf we blithely ignore our dependence on foreign oil, we are inviting an economic and national security disaster. Most of the world’s oil is concentrated in places that are either hostile to American interests or vulnerable to political upheaval and terrorism.  Oil supplies are vulnerable to natural disasters, wars and terrorist attacks. Reliance on fossil fuels contributes to environmental problems, including climate change. In the long run, this could bring drought, famine, disease, and mass migration, all of which could lead to conflict and instability.

Essentially, we’re talking here about what we think is going to be catastrophe.  Somebody will say, ‘‘Why was there no vision? Why was there no courage? Why didn’t somebody rise up?’’

Maybe if we try some element of pricing that is different from what we do now, without getting into all the political hazards that Joe Biden has discussed, namely, woe be to the person that suggests a 25-cent tax. The [public] would say, ‘‘Why?’’ Or … a little more tax each year, that is even worse, because you invite a congressional candidate or a President to say, ‘‘We’ve had enough of this kind of stuff. I’m going to reduce your taxes. And we’re not going to take a look at a long-term future.’’

Milton R. Copulos, president of the National Defense Council Foundation: A supply disruption of significant magnitude, such as would occur should Saudi supplies be interdicted, would also dramatically undermine the Nation’s ability to defend itself. A shortage of global oil supplies not only holds the potential to devastate our economy, but could hamstring our Armed Forces as well. Last year marked the 60th anniversary of the historic meeting between Saudi monarch King Abdul Aziz and U.S. President Franklin Roosevelt where he first committed our Nation to assuring the flow of Persian Gulf oil—a promise that has been reaffirmed by every succeeding President, without regard to party.

Without oil our economy could not function, and, therefore, protecting our sources of oil is a legitimate defense mission, and the current military operation in Iraq is part of that mission. [My comment: golly, so it isn’t because of Weapons of Mass Destruction?]

One point we have to look at here, in terms of the argument over domestic oil/foreign oil, misses the point.  We’re going to run out of oil. That’s a given. If you take a look at global demand, I don’t care how much we produce.  The Chinese are adding 120 million cars.  If you look at Third World demand alone, in 2025, it is going to require an additional 30 million barrels a day. When you add in the rest of us, it’s 40. And there’s no ‘‘there’’ there. Can’t be done.

  1. Senate 109-860. May 16, 2006. Energy security and oil dependence. U.S. Senate hearing.
  2. Senate 109-64. June 2006. Energy diplomacy and security. a compilation of statements by witnesses before the Committee on Foreign Relations. U.S. Senate.

Alice Friedemann  www.energyskeptic.com  Author of Life After Fossil Fuels: A Reality Check on Alternative Energy; When Trucks Stop Running: Energy and the Future of Transportation”, Barriers to Making Algal Biofuels, & “Crunch! Whole Grain Artisan Chips and Crackers”.  Women in ecology  Podcasts: WGBH, Financial Sense, UCSC, Jore, Planet: Critical, Crazy Town, Collapse Chronicles, Derrick Jensen, Practical Prepping, Kunstler 253 &278, Peak Prosperity,  Index of best energyskeptic posts

***

Senate 109-861. March 30, 2006. The Hidden Cost of Oil. U.S. Senate hearing. 53 pages

SENATOR RICHARD LUGAR, INDIANA, CHAIRMAN.  The committee meets today to consider the external costs of United States dependence on fossil fuels. The gasoline price spikes following Katrina and Rita hurricanes underscored for Americans the tenuousness of short-term energy supplies. Since these events, there is a broader understanding that gasoline and home heating prices are volatile and can rapidly spike to economically damaging levels due to natural disasters, terrorist attacks, or other world events. But, as yet, there is not a full appreciation of the hidden costs of oil dependence to our economy, our national security, our environment, and our broader international goals.

We’re aware that most, if not all, energy alternatives have some externality costs. But we’re starting from the presumption that if we blithely ignore our dependence on foreign oil, we are inviting an economic and national security disaster.

With less than 5 percent of the world’s population, the United States consumes 25 percent of its oil.

Most of the world’s oil is concentrated in places that are either hostile to American interests or vulnerable to political upheaval and terrorism. More than three-quarters of the world’s oil reserves are controlled by national oil companies, and within 25 years the world will need 50 percent more energy than it does now.

There are at least six basic threats associated with our dependence on fossil fuels:

First, oil supplies are vulnerable to natural disasters, wars and terrorist attacks that can produce price shocks and threats to national economies. This threat results in price instability and forces us to spend billions of dollars defending critical fossil fuel infrastructure and shipping choke points.

Second, finite fossil fuel reserves will be stressed by the rising demand caused by explosive economic growth in China, India, and many other nations. This is creating unprecedented competition for oil and natural gas supplies that drives up prices and widens our trade deficit. Maintaining fossil fuel supplies will require trillions in new investment, much of it in unpredictable countries that are not governed by democracy and market forces.

Third, energy-rich nations are using oil and natural gas supplies as a weapon against energy-poor nations. This threatens the international economy and increases the risk of regional instability and even military conflict.

Fourth, even when energy is not used overtly as a weapon, energy imbalances are allowing oil-rich regimes to avoid democratic reforms and insulate themselves from international pressure and the aspirations of their own people. In many oil-rich nations, oil wealth has done little for the people, while ensuring less reform, less democracy, fewer free-market activities, and more enrichment of elites. It also means that the United States and other nations are transferring billions of dollars each year to some of the least accountable regimes in the world. Some of these governments are using this money to invest abroad in terrorism and instability or demagogic appeals to anti-Western populism.

Fifth, reliance on fossil fuels contributes to environmental problems, including climate change. In the long run, this could bring drought, famine, disease, and mass migration, all of which could lead to conflict and instability.

Sixth, our efforts to facilitate international development are often undercut by the high costs of energy. Developing countries are more dependent on imported oil, their industries are more energy intensive, and they use energy less efficiently. Without a diversification of energy supplies that emphasizes environmentally friendly options that are abundant in most developing countries, the national incomes of energy-poor nations will remain depressed, with negative consequences for stability, development, disease eradication, and terrorism.

Each of these threats comes with a short- and long-term cost structure, and, as a result, the price of oil dependence for the United States is far greater than the price consumers pay at the pump. Some costs, particularly those affecting the environment and public health, are attributable to oil no matter its source; others, such as costs of military resources dedicated to preserving oil supplies, stem from our dependence on oil imports. But each dollar we spend on securing oil fields, borrowing money to pay for oil imports, or cleaning up an oil spill is an opportunity missed to invest in a sustainable energy future.

Certain types of costs are extremely difficult to quantify, and we understand that many national security risks are heightened by our dependence. But how, for example, would we assign a dollar figure to Iran’s use of its energy exports to weaken international resolve to stop its nuclear weapons program? Yet, we should do our best to quantify the external costs of oil so we have a clearer sense of the economic and foreign policy trade-offs that our oil dependence imposes upon us.

As the U.S. Government and American business consider investments in energy alternatives, we must be able to compare the costs of these investments with the entire cost of oil. Public acknowledgment of the billions of dollars we spend to support what the President has called our, ‘‘oil addiction,’’ would shed new light on investment choices related to cellulosic ethanol, hybrid cars, alternative diesel, and other forms of energy.

Milton R. Copulos, president of the National Defense Council Foundation.

I would like to commend Chairman Lugar for … his leadership addressing our Nation’s perilous energy dependence.

America is rushing headlong into disaster. What is worse, however, is that it is a disaster of our own design.

More than three decades have passed since the 1973 Arab Oil Embargo first alerted the Nation to its growing oil import vulnerability. Yet, despite this warning, we are now importing more than twice as much oil in absolute terms than we did in 1973, and the proportion of our oil supplies accounted for by imports is nearly double what it was then. What makes this dependence even more dangerous than it was three decades ago is the fact that the global market has become a far more competitive place with the emerging economies of China, India, and Eastern Europe creating burgeoning demand for increasingly scarce resources.

Even conservative estimates suggest that nearly 30 million barrels per day of new oil supplies will be required by the year 2025 just to service the developing world’s requirements. When Europe and the Americas are included, the requirement is closer to 40 million barrels per day. It is doubtful that new supplies sufficient to meet this skyrocketing demand will be found from conventional sources.

UNCERTAIN SUPPLIERS.  The top six sources of U.S. oil imports—Canada, Mexico, Saudi Arabia, Venezuela, Nigeria, and Iraq—account for 65.1% of all foreign crude reaching our shores and 38.9% of total domestic consumption. Of these four, Saudi Arabia, Venezuela, Nigeria, and Iraq, provide 38.2% of oil imports and 22.6 percent of total consumption. For a variety of reasons, none of the four I just mentioned can be considered a reliable source of supply.

THE CONSEQUENCES OF DISRUPTION.  The supply disruptions of the 1970s cost the U.S. economy between $2.3 trillion and $2.5 trillion. Today, such an event could carry a price tag as high as $8 trillion—a figure equal to 62.5% of our annual GDP or nearly $27,000 for every man, woman, and child living in America.

But there is more cause for concern over such an event than just the economic toll. A supply disruption of significant magnitude, such as would occur should Saudi supplies be interdicted, would also dramatically undermine the Nation’s ability to defend itself.

Oil has long been a vital military commodity, but today has taken on even more critical importance. Several examples illustrate this point:

  • A contemporary U.S. Army Heavy Division uses more than twice as much oil on a daily basis as an entire World War II field army.
  • The roughly 582,000 troops dispatched to the Persian Gulf used more than twice as much oil on a daily basis as the entire 2-million-man Allied Expeditionary Force that liberated Europe in World War II.
  • In Operation Iraqi Freedom, the oil requirement for our Armed Forces was 20% higher than in the first gulf war, Operation Desert Storm, and now amount to one barrel of refined petroleum products per day for each deployed service member.

Moreover, the military’s oil requirements will be even higher in the future. Therefore, a shortage of global oil supplies not only holds the potential to devastate our economy, but could hamstring our Armed Forces as well.

THE HIDDEN COST OF IMPORTED OIL.  While it is broadly acknowledged that our undue dependence on imported oil would pose a threat to the Nation’s economic and military security in the event of a supply disruption, less well understood is the enormous economic toll that dependence takes on a daily basis. The principal reason why we are not fully aware of the true economic cost of our import dependence is that it largely takes the form of what economists call ‘‘externalities,’’ that is, costs or benefits caused by production or consumption of a specific item, but not reflected in its pricing. It is important to understand that even though external costs or benefits may not be reflected in the price of an item, they nonetheless are real.

In October 2003, my organization, the National Defense Council Foundation, issued ‘‘America’s Achilles Heel: The Hidden Costs of Imported Oil,’ a comprehensive analysis of the external costs of imported oil. The study entailed the review of literally hundreds of thousands of pages of documents, including the entire order of battle of America’s Armed Forces and more than a year of effort. Its conclusions divided the externalities into three basic categories: Direct and Indirect Economic Costs, Oil Supply Disruption Impacts, and Military Expenditures.

Taken together, these costs totaled $304.9 billion annually, the equivalent of adding $3.68 to the price of a gallon of gasoline imported from the Persian Gulf. As high as these costs were, however, they were based on a crude oil refiner acquisition cost of $26.92. Today, crude oil prices are hovering around $60 per barrel and could easily increase significantly. Indeed, whereas, in 2003 we spent around $99 billion to purchase foreign crude oil and refined petroleum products, in 2005 we spent more than $251 billion, and this year we will spend at least $320 billion.

But skyrocketing crude oil prices were not the only factor affecting oil-related externalities. Defense expenditures also changed. In 2003, our Armed Forces allocated $49.1 billion annually to maintaining the capability to assure the flow of oil from the Persian Gulf.  Expenditures for this purpose are not new. Indeed, last year marked the 60th anniversary of the historic meeting between Saudi monarch King Abdul Aziz and U.S. President Franklin Roosevelt where he first committed our Nation to assuring the flow of Persian Gulf oil—a promise that has been reaffirmed by every succeeding President, without regard to party.

I am stressing the longstanding nature of our commitment to the gulf to underscore the fact that our estimates of military expenditures there are not intended as a criticism. Quite the opposite, in fact.

Without oil our economy could not function, and, therefore, protecting our sources of oil is a legitimate defense mission, and the current military operation in Iraq is part of that mission.

To date, supplemental appropriations for the Iraq war come to more than $251 billion, or an average of $83.7 billion per year. As a result, when other costs are included, the total military expenditures related to oil now total $132.7 billion annually.

In 2003, as noted, we estimated that the ‘‘hidden cost’’ of imported oil totaled $304.9 billion. When we revisited the external costs, taking into account the higher prices for crude oil and increased defense expenditures we found that the ‘‘hidden cost’’ had skyrocketed to $779.5 billion in 2005. That would be equivalent to adding $4.10 to the price of a gallon of gasoline if amortized over the total volume of imports. For Persian Gulf imports, because of the enormous military costs associated with the region, the ‘‘hidden cost’’ was equal to adding $7.41 to the price of a gallon of gasoline. When the nominal cost is combined with this figure it yields a ‘‘true’’ cost of $9.53 per gallon, but that is just the start.

What then can we do? The first step is to recognize that we face a two-fold problem. The first part entails assuring adequate fuel supplies for the 220 million privately owned vehicles on the road today. These vehicles have an average lifespan of 16.8 years and the average age of our vehicle fleet is 8.5 years. Therefore, we will require conventional fuels or their analogs for at least a decade, even if every new vehicle produced from this day forth runs on some alternative.

In the near term, say the next 5 to 10 years, we essentially have two options. First, to make the greatest possible use of our readily accessible conventional domestic resources, particularly the oil and natural gas that lay off our shores. We should also consider using some of our 1,430 trillion cubic feet of domestic gas reserves as a feedstock for motor fuels produced through the Fischer-Tropsch process. Indeed, we currently have 104 trillion cubic feet of so-called ‘‘stranded’’ natural gas in Alaska and a pipeline with some 1.1 million barrels per day of excess capacity. Stranded gas could be converted into clean burning motor fuel and transported in the existing pipeline to the lower 48 states.

Another point is to make sure that we do not forget to address non-transportation petroleum consumption. The fact that two-thirds of our petroleum is consumed in the transportation sector means that one-third is not. The opportunities to reduce oil consumption from non-transportation are greater than you might expect.

Take residential energy use, for example. Roughly 12% of distillate use goes to home heating, most of it imported from the Middle East. Yet, there are alternatives readily available that could totally eliminate this use, and at the same time save consumers money. For instance, a developer in Moline, IL, is currently building homes that are between 85 to 90% energy efficient, and meet their heating and cooling requirements with geothermal energy. More important, these homes are being sold for 20% less than conventional housing sold in the same area. So consumers are not only saving energy, they are saving enormous amounts of money.

In the longer term, there are other domestic energy resources that can be brought into play. We have between 500 billion and 1.1 trillion barrels of oil contained in our huge oil shale resources. We have 496.1 billion tons of demonstrated coal reserves—27 percent of the world total. We also have 320,222 trillion cubic feet of natural gas in the form of methane hydrates. This is equivalent to 51.1 trillion barrels of oil. Indeed one on-shore deposit in Alaska, alone, contains 519 trillion cubic feet of natural gas. That is equal to 82.9 billion barrels of oil.

To conclude, while our Nation is in dire peril due to its excessive dependence on imported oil, the situation is far from hopeless. We have the resources necessary to provide our Nation’s energy needs if we can only find the political will to do so.

HILLARD HUNTINGTON, Executive Director, Energy Modeling forum, Stanford University.

Tight oil markets with minimal surplus capacity have made world oil prices particularly jumpy over recent months. In the last 6 months, a series of political and natural events have cascaded around the globe and left their impact on increasingly nervous oil-consuming nations. These developments have been extremely varied and include the following:

  • A thwarted suicide attack in February at the Abqaiq oil processing facility in eastern Saudi Arabia;
  • A string of turmoil in the Niger Delta highlighted by a recent speedboat attack in January by gunmen on the riverside offices of Italian oil company Agip;
  • Antigovernment attempts to disrupt congressional elections in Venezuela culminating in an explosion at an oil pipeline connected to that country’s largest oil refinery;
  • Devastating Hurricanes Katrina and Rita in the United States in August and September.

Their sporadic nature conveys an element of unpredictability and surprise. I have recently coordinated several studies for the Energy Modeling Forum at Stanford University that relate directly to this issue. I would like to share a few observations that I think summarize the perspectives of many (but certainly not all) participants who were involved in the studies. Our forum frequently brings together the leading experts and advisors from government, business, and university and other research organizations to discuss how we can improve analysis of key energy problems that keep policymakers awake at night. In this particular case, the work was done primarily for the U.S. Department of Energy, but we were asked to invite individuals we thought were the leading people on this issue.

Our two studies focused on the risks of another major oil disruption and the economic consequences of oil price shocks. I am also submitting both reports that expand considerably over my brief remarks here today. I will also briefly discuss a third issue: Our dependence on the oil-producing cartel. Although these episodes have made oil-importing countries nervous and have imposed some very high costs on people and infrastructure, they have yet to duplicate the types of oil shocks that were experienced during the 1970s and early 1990s. As a result, their economic impacts have been more tolerable than in the past. Despite recent oil price volatility, for example, real GDP in the United States has grown strongly, by 3.5 percent annually since the end of 2001.

A number of knowledgeable experts, however, are concerned about the very real possibility of much more damaging shocks in the future. A group assembled by Stanford’s EMF thought that the odds of, at least, one very damaging shock over the next 10 years were higher than those of an oil market with some volatility but without such a shock. Although another major oil disruption is not a certainty, its likelihood is significantly high enough to be worrisome. Your odds of drawing a club, diamond, or heart from a shuffled deck of playing cards are three out of four. In the EMF study, the participants found that the odds of a foreign oil disruption happening over the next 10 years are slightly higher at 80 percent. Disruption events included surprise geopolitical, military, or terrorist turmoil that would remove at least 2 million barrels per day—an amount representing about 2.1 percent of expected global oil production. Foreign disruptions of this magnitude would have more serious effects on oil prices and the economy than we have seen with the Katrina and Rita hurricanes. Oil prices, however, would rise more and for longer than a few months or a heating season. In the study, experts estimated the amount of oil lost to the market as the number of barrels removed by the initial disruption, minus any offsets from the use of excess capacity from undisrupted regions. The experts were asked to exclude any releases from the U.S. strategic petroleum reserve, as these actions require separate decisions from the government during an emergency. The approach identified four major supply regions where disruptions are most likely. These regions account for approximately similar shares of total world oil production. Collectively, they account for about 60 percent of total world oil production. The study lumped Algeria, Angola, Libya, Mexico, Nigeria, and Venezuela as the first region, called ‘‘West of Suez.’’ Saudi Arabia was the second region, and other Persian Gulf States—Iran, Iraq, Kuwait, Qatar, UAE, and Oman—were the third. Russia and the Caspian States comprised the fourth region. The riskiest areas were the Persian Gulf countries outside of Saudi Arabia and several countries along the Atlantic Basin, such as Nigeria and Venezuela. The least risky area was Russia and the Caspian States. Although the participants found the possibility of disruptions was lower in Saudi Arabia than in several other vulnerable regions, disruptions there would tend to have larger effects.

In the second study on the economic consequences of a major disruption, we sought to understand how easily the economy could absorb such a shock. Figure 1 shows that oil price shocks preceded 9 of the last 10 recessions in the United States. The solid line indicates the path of inflation-adjusted crude oil prices since 1950. The gray bars denote periods when the U.S. economy was experiencing recessions as defined by the National Bureau of Economic Research (NBER). This finding was first advanced by Professor James Hamilton at University of California at San Diego and has been confirmed by numerous other researchers.

If a large disruption does occur, we can expect very serious economic consequences. Large disruptions, especially if they move inflation-adjusted oil prices higher than experienced recently, will cause unemployment and excess capacity to grow in certain key sectors.

Other researchers, however, think that these estimates underestimate the impacts, because they do not focus explicitly on sudden and scary oil price shocks. These other researchers think that our historical experience suggests that the level of real GNP would decline by more, at 5 percent for a doubling of the oil price. My personal view is that the higher estimate may be closer to what would actually happen if we had a major disruption. That would mean a recession.

Some people think that oil shocks may not be a problem because the Federal Reserve Board could intervene and lessen the impact. I have a great deal of faith in the Federal Reserve Board. They have done a marvelous job in controlling inflation, which places the U.S. economy in a better position for offsetting oil disruptions than in previous decades. I am not yet convinced that they can compensate the economy for a large devastating disruption. They would have to make some important decisions, very quickly, at a time when fears were running rampant. They may also find it difficult to stimulate the economy because nominal interest rates are already very low, not only here but also abroad. For this reason, I think that the United States should seriously consider other types of insurance policies that would allow the Federal Reserve Board more leeway and flexibility in controlling our inflation rates.

As a general rule, strategies that reduce our dependence on oil consumption are more effective than policies that reduce our imports. One should view the world oil market as one giant pool rather than as a series of disconnected puddles. When events happen anywhere in the market, they will raise prices not only there but also everywhere that connect to that large pool. Since reducing our imports with our own production does not sever our link to that giant pool, disruptions will cause prices to rise for all production, including that originating in the United States. More domestic supplies do not protect us from these price shocks. Unfortunately, insurance policies are never free. It will cost us something to implement a strategy that reduces our risk to another major oil disruption. But it will also cost us a lot of money and jobs if we do not adopt an insurance policy and the Nation faces another major disruption.

As a result of the 1970 oil price shocks, we shifted away from oil in many sectors in the early 1980s, but that trend has slowed considerably since then. Moreover, transportation remains strongly tied to oil use. The dependence on oil in transportation not only affects households directly through higher gasoline costs but it also raises the costs of transporting goods around the country.

Our most recent studies did not address a third issue that could influence the costs of using oil. It is sometimes argued that the United States could adopt policies that would try to minimize or break the oil-producing cartel’s control over the market. Our forum addressed this issue many years ago. Although the range of views was wide, our working group conservatively estimated that the hidden cost of oil from this source might be $5 per barrel, or 12 cents per gallon. Several years ago, the National Research Council used a very similar estimate in their review of the corporate average fuel economy standards for automobiles. That estimate is not trivial, but it is considerably smaller than various estimates for gasoline’s hidden costs due to pollution, congestion, and automobile accidents.

In summary, the Nation is vulnerable to another major disruption not because the economy imports oil but primarily because it uses a lot of oil, primarily for gasoline and jet fuel. Even if domestic production could replace all oil imports, which I am not advocating, the economy would remain vulnerable to the types of disruptions discussed here. However, it is very appropriate that this committee focus its energy on this issue. Oil-importing governments have committed significant political and military resources to the Middle East over a number of decades in order to provide regional stability that is critical to world oil supplies. Excessive exposure to oil vulnerability risks in this country increases these costs or reduces the capacity to pursue foreign policy objectives that are critical for mitigating nuclear proliferation, terrorism and other risks that reduce global security. I cannot provide you with an estimate for this political cost of using oil, but it is extremely important.

JOSEPH R. BIDEN, JR., U.S. SENATOR FROM DELAWARE.  For most of us, the costs of oil seem far from hidden. They are right up there on the signs at our gas stations, they are there in black and white on our heating bills.

Those prices conceal the hidden tax we pay to OPEC countries who use their pricing power to charge us more than they could get in an open international market for oil.  In addition, those prices conceal the costs of the security commitments we face to protect the supply of oil from OPEC and other foreign sources. And they conceal the costs to our foreign policy, which has been handcuffed for over half a century by our dependence on oil from parts of the world with very different interests from our own.

Finally, the price at the pump hides the long-term environmental damage—as well as the economic and social disruptions—that will come with global warming. The economic, social, political, and environmental costs we face today—and the costs of dealing with their repercussions in the future—will not stay hidden. There is no free lunch, as economists never tire of telling us. Somebody eventually has to pick up the tab. That is a dead-weight loss for the entire economy. Every watt of electricity from our power plants, every minute we run a refrigerator or air-conditioner, every trip to the store, everything shipped by truck or rail—all those parts of our everyday lives costs more than they should. That leaves us with less to spend on other priorities. It make us poorer—as individuals, as families, as a nation.

But there are real costs to our policies, too, of course. As hard as they may be to calculate, we must try to measure the economic costs of our reliance on oil, especially on imported oil, on oil from countries that are themselves unstable or that promote instability.

[In addition to] the costs of our foreign entanglements to secure that oil, [are] the costs we will incur to cope with the climate change that will result from our use of oil and other fossil fuels.

You and I share a concern about all of the foreign policy implications of climate change, Mr. Chairman. Climate change will alter growing seasons, redistribute natural resources, lift sea levels, and shift other fundamental building blocks of economic, social, and political arrangements around the world. It could spark massive human migrations and new wars over resources. We will pay a price for those, too.

In every one of the areas we will look at today, the near term prospects are grim. The rise of the massive economies of China and India will continue to put pressure on supply, will demand tens of billions in investments, will further complicate global oil and energy politics, and will accelerate the accumulation of carbon dioxide and other greenhouse gases.

Half the world’s population—3 billion people—live on $2 a day. Just to provide them with a little electricity to replace wood and kerosene for cooking, to pump water, to light a schoolhouse—will require more than our current energy system can provide.

SENATOR LUGAR. Let me begin with some topical references to what we’re talking about today that I culled from the New York Times this morning. Three perspectives. The first deals with the problems in Ukraine following the election, but really going back to January 1, when Russia cut off some gas lines and delivery to Ukraine. Ukraine citizens then took some gas from lines that were going across Ukraine to Europe. A 48-hour contretemps occurred. The article describes the very unusual organization that was formed by Russia. It starts with the rather bizarre thought that the head of this organization is in a remote house, and no one has ever heard of him. The problem, however, is acute for the citizens of Ukraine, even as they try to form their government. In large part because the gas was shut off, it is apparent that President Yushchenko lost a great deal of authority. He lost it in two ways, one of which was that his country was cold. People were cold, physically. Their industry, which was fledgling, was stymied. I’ve described this, I hope in not ultradramatic ways, as waging war without sending the first troops across the line, or bombing or strafing. You can ruin, decimate a country by cutting off energy.

I mention that, because this comes in the same paper with the headline, ‘‘Automakers Use New Technology to Beef Up Muscle, Not Mileage.’’  In improving fuel economy, virtually everyone agrees that there is only one way to do it. There has to be a will. ‘‘There’s no shortage of technology,’’ said a senior analyst at Environmental Defense. However, the fact is that the automobile companies have decided the most saleable product is more zoom in the cars. If you want to, at least have something that is marketable, a car that gets off the mark faster, rather than slower, is more desirable. Some would emphasize, ‘‘After all, a large car is safer.’’ So, all things considered, the technology may be there, but the market strategy is really to sell something else, which is somewhat discouraging, you know, given our parlay this morning.

Finally, there is a very interesting profile of the new president, or chief executive, of Exxon Mobil.  He said, ‘‘we are looking for fundamental changes, but that is decades away. The question is, what are we going to do in the meanwhile?’’  His suggestion is: Explore for oil and gas. And it commends finds in Indonesia, for example, which have been significant recently. But then it also points out in the article that it’s hard even for Exxon Mobil, with all of its resources, to find enough gas or oil, day by day, to replenish that which is already being produced.

And this is why the President’s statement, ‘‘We’re addicted to oil, and we have to transfer 50 or 75 percent of our needs somewhere else in a while,’’ is important, because it catches the attention of tens of millions of people all at once; whereas, we capture very few.

Essentially, we’re talking here about what we think is going to be catastrophe.  Somebody will say, ‘‘Why was there no vision? Why was there no courage? Why didn’t somebody rise up?’’ This is the attempt to do that, to have hearings like this in which these questions are raised, and hopefully people who are expert, like you, inform us, who are learners and are trying very hard to see what sort of public policy ought to be adopted, or at least advocated by some of us, understanding that you have to be patient sometimes for some of these things get through two houses and be signed.

Senator BIDEN. Gentlemen, there used to be a song that was popular back in the late fifties, when I was in high school, and I forget who sang it, but the lyrics were—I remember, the lyrics went ‘‘Tick-a-tick-atock. Timin’ is the thing. Timin’ is everything.’’ And it seems to me—and I have been of the view that there is an environmental catastrophe in the making.  But I don’t get the sense that that has been in any way absorbed by the public.

If you look at it optimistically—the idea of an environmental tax is—you first have to convince people there’s an environmental disaster in the making,

To see the correlation between a $10-a-barrel tax, or whatever the number is, and their ability to breathe clean air or have—not have their roses grow in December in New York State.  When you have this conversation at the barbeque in the backyard with your next-door neighbor, who works for the electric company or is—you know, is a salesman for whatever, I mean, what do you—how do you talk to them about it? Or do you?

Mr. COPULOS. I had a recent experience that really brought that home to me. I have an article in the current issue of the American Legion Magazine, dealing with this, and possible solutions, and I’ve had 200 e-mails from members of the legion around the country who’d read the article and responded. And, uniformly, they have expressed concern. They kind of understand it, but the problem is, they don’t know what to do about it, and that’s why they’re asking—that, plus some rhetoric about brain-dead people in Washington not addressing the issue.  It’s not that people don’t ‘‘get it.” Americans are doers. They don’t want you to preach catastrophe. They know there’s a problem. They’re not stupid. What they say is, ‘‘OK, now, what are you going to do about it?’’ We’re a practical people. If we point them in the right direction, ‘‘Look, you can do X, Y, and Z, and it makes real good sense’’. Just do these things, and you can save yourself’’— geothermal heat pumps, for example, day one of installation in every heating zone in this country, you save money if you use a geothermal heat pump.

Senator BIDEN.  What would some guy say if you said ‘‘I’ve just convinced Congress to raise the price of a gallon of gasoline at the pump 35 cents or a dollar’’? Is he going to say, ‘‘Great’’?

Mr. COPULOS. He’s going to say, ‘‘I’m going to vote against him.’’

Senator BIDEN. That’s right.

Mr. COPULOS.  There were only two times—1973 and 1979—when purchases of autos related to mileage—and they both were specifically tied to an absence of energy. We had gasoline lines, and people were shooting each other. And that gets down to a very fundamental point that we have to understand. And that is that it is the availability of energy that drives behavior, not the price. Whatever the price of energy is, we will adjust, sooner or later. The only times prices are a factor is if it’s a shocking price. In Maryland, in several other States, we see electricity prices predicted to go up 72% this summer. Consumers are up in arms, because they see this as a huge spike. But, I’ll tell you what, 6 months after it’s in effect, people will have adjusted, and they won’t have changed their behavior.

Senator BIDEN.  I hope that’s wrong, but I’m afraid  you may be right.  What I’m deliberately and intentionally asking [given] the extent of the problem, the need to deal with the problem, and the fact that those boneheads here in Washington aren’t paying attention to this, and we’re going to all say, 2, 5, 10, 12 years from now, ‘‘My God, why didn’t anybody talk about this?’’ So, we’re all on the same page on—in that regard.

One of the things that seems to sell with average people, as it relates to the notion of whether or not their behavior will be affected by anything, is: Should we be spending more Federal tax dollars investing in alternative energy sources? Should we be doing it through incentives? Should we be doing it through direct loans?

In Huntington’s statement he said strategies to reduce our dependence on oil are more effective than policies that reduce our imports. We should view the oil market as one giant pool, rather than a series of disconnected puddles. Whatever—when events happen anywhere in the market, they will raise prices, not only there, but also everywhere, that connect to the—that large pool. More domestic supplies will not protect us from these price shocks.

The oil companies and others—have this nice mantra,  that the way in which to drive down prices is, ‘‘We’ve got to go out and find more oil,’’ particularly domestic oil, and then we’re not home free, but we’re going to have a lot more control.  For example, we passed an energy bill at the time when the oil companies were having gigantic surpluses, in terms of profit —and I’m not making the populist argument, but just a factual argument. And we decided we needed to give them a $2.5 billion incentive for them to go out and look for more oil. And people here, they drank the Kool-Aid.  They said, ‘‘Yeah, it sounds right, because we’ve got to get more domestic oil.’’ Talk to me a moment about what benefit—let’s assume we were able to discover and produce three times the amount of oil we are now producing domestically—and we found it overnight—that could come online over the next 4 years. We found it in—you know, in the middle of Delaware or, in Maine, in Washington State– in unlikely places.  What would be the effect of that?

Dr. HUNTINGTON. The price is going to rise for everything, and just having more domestic supplies is not going to protect you from that price rise. More domestic supplies is going to help pull down the price of oil on the market. Just by putting that more supply on, we will help the market out that way. So, the price will be lower. And so, that would actually be beneficial. If it was economic, it would be beneficial.

The problem would come in if it was not economic. Then you’re really hiding the cost, in a way. You’re saying, ‘‘Yes, I’m putting on more supply, but it’s really costing the taxpayers a whole lot more money somehow, because we’re giving it a subsidy for it to come on.’’  [ My note: which is what happened, but not with subsidies, but with another financial bubble similar to the mortgage bubble – shale companies went $300 billion into debt. ]

Mr. COPULOS.  One point we have to look at here, in terms of the argument over domestic oil/foreign oil, misses the point.  We’re going to run out of oil. That’s a given. If you take a look at global demand, I don’t care how much we produce.  The Chinese are adding 120 million cars. You look at  just Third World demand alone, in 2025, is going to require an additional 30 million barrels a day. When you add in the rest of us, it’s 40. And there’s no ‘‘there’’ there. Can’t be done.

What we need to do is to facilitate the transition away from a reliance on oil as a motor fuel and in other areas. But to do that, we have another problem. There are 220 million privately owned vehicles on the road today. They have an average age of 8.5 years, an average life span of 16.8 years. So for a decade, because people are not going to junk their cars, you’re going to have to do something to provide them with fuel. That means you need something that can burn in those cars.

Senator BIDEN. Let me conclude by recounting a similar example. In 1974, I was a young Senator  and I got a call from a fellow named Mr. Ricardo, chairman of the board of the Chrysler Corporation, and Leonard Woodcock, the president of the UAW, and he  asked if they could come to see me. And they sat in my office and jointly told me that I could not support the Clean Air Act, because the Clean Air Act was going to put restrictions on tailpipe emissions of automobiles. I’ll never forget Mr. Ricardo looking at me—this was 1974—and saying, ‘‘You don’t understand’’ — we now have 18% of the large-car market. It is our plan, in the next 5 years, to get 35% of the large-car market.’’ So much for management vision about how they were going to move.

RICHARD G LUGAR, INDIANA, CHAIRMAN. Let me just pick up a little bit on… what is being offered to American motorists in this particular year. The New York Times story that I mentioned earlier says that the 1975 Pontiac Firebird could get from zero to 60 miles per hour in 9.8 seconds. The 2005 Toyota Camry can make it in 8.1. Now, the point they’re trying to make is that the developments in the last 30 years have been largely in terms of performance and the ‘‘zoom’’ speed.  The dilemma here is described further in the New York Times story by someone who noted that he would like to get better gas mileage, but he’s been driving  a truck for years, and he’s comfortable in a truck. He doesn’t want a Prius. He wants a truck. And, therefore, even though it does cost more, all things considered, that is his comfort level, his feeling of safety. He doesn’t want to zoom off at 5.1 for the first stretch after the stoplight, but he does really want to have safety and comfort. We’ve been talking, ‘‘Does price at the pump influence people?’’ Probably, somewhat.

Now, I want to zero in on one of the strategic predicaments. And this really has to do with the thoughts that you had, Mr. Copulos, on the Armed Forces. You point out, just historically, that in 1983 the implicit promise to protect Persian Gulf oil supplies became an explicit element of U.S. military doctrine with the creation of the United States Central Command, CENTCOM. And their official history makes the point clear, you point out, and I quote, ‘‘Today’s command evolved as a practical solution to the problem of projecting U.S. military power to the gulf region from halfway around the world.’’ And they further have refined the doctrine by saying, ‘‘Without oil, our economy could not function.’’ And, therefore, protecting our sources of oil is a legitimate defense mission. And the current military operation in Iraq really is a part of that mission.

To date, supplemental appropriations for the Iraq war come to more than $251 billion—this is supplemental appropriations, on top of our regular military budget—an average of $83.7 billion a year. As a result, when other costs are included, the total military expenditures related to oil now are $132.7 billion annually. That is a big figure.

But it’s not reflected, in terms of our market economy. The automobile companies have to make their own strategy. So do the oil companies. What I’ve suggested from the New York Times story is their strategy is to use technology for so-called performance and safety, not for what we’re talking about today with regard to disruption or the oil economy or what have you.

Some oil companies say, ‘‘Our job is performance for our stockholders, first of all, those who have invested in this place. And, second, it’s to try to think about the future, and that is getting more of whatever we sell. We’ll do a little bit of research on the side and genuflect in that direction. But that is very long term.  Not this year. We are oil people.’’  That is still, I’m afraid, the prevailing view among major players in this. What I’m trying to figure out—and I’m certain Senator Biden shares this thought—how do we get a recognition that our military doctrine, our national defense, now commits $132 billion a year to the protection of Middle East oil lines? Not just for us, but for everybody else, for that matter.

You, in your paper, even go back to Franklin Roosevelt and his original meeting with the Saudi King in which, essentially, this is the assurance that came, ‘‘If you produce it, we’ll protect it.’’

Americans have not only spent money, but they’ve lost a lot of lives defending all of this. And that is not reflected in the market situations that we’re talking about today.

Do we make an explicit foundation or endowment in which we set aside so much? Because simply to add $1.50 to the price of a barrel or a gallon or so forth may not make it. It may be that my friend, who is in the article, says, ‘‘I still want the comfort of my truck.’’ So, in terms of a market choice, I’m not sure we get there. Maybe some administration will come along and say, ‘‘Listen, folks, this is what our doctrine costs, $132 billion a year,’’ explicitly, ‘‘plus whatever lives we lose, whatever risks Americans take, to keep all this going. Do you like that, or not?’’ As Senator Biden says, our constituents are saying, ‘‘Why don’t you guys do something about $3 gas?  Why are you just sitting there in Washington, fiddling around?’’ This is the big issue out here. If I had a dollar for every Republican banquet I’ve attended in which people, in February, March, or whenever a crisis occurs, come to me and say, you know, ‘‘Why aren’t you doing anything about that?’’

That’s the politics of the country. Why? Because the public recognition of this problem is at that point, that $3 at the pump. They pay it, but they’re irritated. And they think that we ought to perform and get it down. Now, we can say, theoretically, that’s a part of the problem—it goes up, down. It’s forgotten. People go through an upset period, but then they get over it. But, here, you’re looking at climate change, which keeps it going on inexorably, whether we’re having this discussion or not. Or disruptions—you’ve illustrated those in your paper, Dr. Huntington, that are actual facts. Plus, you know, the huge problem that might have occurred in the Saudi refinery if the terrorists actually had gotten down the road and disrupted 13% of the oil supply that day. You’ve indicated we could have as much as a 5% loss in GNP. Well, we don’t have 5% gain in GNP now. That takes us to a negative figure. That takes us to a huge unemployment in our country. The same motorist who wanted the comfort of his van is unemployed, and then the whole agenda of this government changes. How do we bring compensatory payments, safety nets, retraining? What in the world do we do at this particular point? And whatever is on these charts today is sort of forgotten, but it shouldn’t have been, because this is the reason we got to that point.

As a practical matter, how do we translate the wisdom of this testimony into measures that give us some protection?

Maybe if we try some element of pricing that is different from what we do now, without getting into all the political hazards that Joe Biden has discussed, namely, woe be to the person that suggests a 25-cent tax. They’d say, ‘‘Why?’’ Or the thought that you do a little bit more tax each year, that is even worse, because you invite a congressional candidate or a President to come along and say, ‘‘We’ve had enough of this kind of stuff. I’m going to reduce your taxes. And we’re not going to take a look at a long-term future.’’

Dr. HUNTINGTON. One of the ways to look at this hidden cost is as a tax put on people’s purchase of gasoline.  You won’t see a lot of effect in the first few years. The real effect will be in the types of vehicles that people buy later on. [Consumers may not do this right away, but the auto makers will] realize that [autos] need to be more efficient…. That is the important effect.  Let’s say we’ve just decided that a tax is not the way we’re going to go, and that we need another approach. The one way I look at this hidden cost is that it’s a measure of how much you should do in an area. Suppose you want to discourage gas-guzzling vehicles in some manner, or you want to encourage a substitute fuel for gasoline. What it should tell you is that you shouldn’t go above, perhaps, $10 a barrel, or whatever.   You shouldn’t make it more costly than whatever that hidden-cost estimate is.

Senator BIDEN.   It seems to me that American business and industry is much more sensitive to price than the consumer at the pump is. If, in fact, the major or small businesses in my State, realize they can add literally a penny or two pennies to their bottom line by economically shifting to another source of fuel, they’ll do it. They’re much more price sensitive—even though they pass on the price, because they’re competing.  If that’s true, has anybody thought about strategies that deal with that smaller percent of the market, where you won’t get as big a bang for the buck, but they will be more likely to embrace the change that takes place—the incentive offered, or the disincentive? Have there been any studies done?  There seem to be two hidden costs that fall into categories the American public could understand. One is the hidden costs relating to environmental costs. The other hidden costs are defense costs. It seems to me  that the public believes that the defense costs are more real, apparent, and immediate than the environmental costs, even though I think they know there are environmental costs.

Does anybody think we would be in the Middle East if, in fact, we were energy independent?

Is there any American out there willing to give their son or daughter’s life if in fact, we didn’t need anything that the oil oligarchs had to offer? They get that pretty quickly.

So, as you think through the things that we can, or should, be doing— what about focusing on the smaller end of the consumption continuum here—that is, industry? And what about a strategy relating to making the defense piece a more palatable or understandable argument as an incentive to change behavior?

When it gets down to it, we have to come up with concrete, specific ways to fiddle. I mean, you know, it’s not like we can’t talk about this. Assuming the Federal Government has any role to play in affecting this behavior.


[ Scorecard on oil dependence or vulnerability mentioned above: Senator Lugar (5), Mr. Copulos (7), Mr. Huntington (4), Senator Biden (1) ]

Posted in Caused by Scarce Resources, Military, Peak Oil, U.S. Congress Energy Dependence, U.S. Congress Energy Policy | Tagged , , , | Comments Off on The Hidden Costs of Oil. U.S. Senate hearing 2006.

Energy return of ultra-deepwater Gulf of Mexico oil and gas

Moerschbaecher, M., John W. Day Jr. October 21, 2011. Ultra-Deepwater Gulf of Mexico Oil and Gas: Energy Return on Financial Investment and a Preliminary Assessment of Energy Return on Energy. Sustainability 2011, 3, 2009-2026

[Excerpts from this 18 page paper follow, graphs and tables not included. A related post is “How much net energy return is needed to prevent collapse?” ]

We believe that the lower end of these energy return on invested (EROI) ranges (i.e., 4 to 7:1) is more accurate since these values were derived using energy intensities averaged across the entire domestic oil and gas industry.

Abstract: The purpose of this paper is to calculate the energy return on financial investment (EROFI) of oil and gas production in the ultra-deepwater Gulf of Mexico (GoM) in 2009 and for the estimated oil reserves of the Macondo Prospect (Mississippi Canyon Block 252). We also calculated a preliminary Energy Return on Investment (EROI) based on published energy intensity ratios including a sensitivity analysis using a range of energy intensity ratios (7 MJ/$, 12 MJ/$, and 18 MJ/$). The EROFI for ultra-deepwater oil and gas at the well-head, ranged from 0.019 to 0.022 barrels (BOE), or roughly 0.85 gallons, per dollar. Our estimates of EROI for 2009 ultra-deepwater oil and natural gas at the well-head ranged from 7–22:1. The independently-derived EROFI of the Macondo Prospect oil reserves ranged from 0.012 to 0.0071 barrels per dollar (i.e., $84 to $140 to produce a barrel) and EROI ranged from 4–16:1, related to the energy intensity ratio used to quantify costs. Time series of the financial and preliminary EROI estimates found in this study suggest that the extraction costs of ultra-deepwater energy reserves in the GoM come at increasing energetic and economic cost to society.

Introduction

Since the early 1970s, rates of domestic oil production in the U.S. have decreased, and domestic demand has been met increasingly by oil imports. Domestic oil is becoming scarcer and more difficult to produce due to reservoir depletion and a sharp decrease in the number of large, easily accessible discoveries onshore or in shallow coastal environments [1-3].

Consequently deep water and ultra-deepwater Gulf of Mexico (GoM) oil has become increasingly important to U.S. domestic oil production over the last 20 years [4]. Not surprisingly, energy extraction in the ultra-deepwater environment requires more financial and energy resources than from onshore or in shallow-water environments. Drilling costs increase exponentially with depth in the ultra-deepwater environment [5].

The increase in energy and financial costs results in decreased net energy available to society. The recent era of deep-water drilling is often associated with the notion of national energy independence and has been touted as a potential solution to decrease dependency on imports. However, proven oil reserves in the federal waters of the GoM (approximately 3.5 billion barrels at year-end 2008) are inadequate to support national domestic oil consumption for even one year [6,7].

Production of deep and ultra-deepwater reserves has become profitable in part due to the establishment of government subsidies and the increase in oil prices over the last decade [7-9].

Gately (2007) reported without explicit quantification that the energy return on investment (EROI) for deepwater and ultra-deepwater oil is low, decreases with an increase in water depth and is less than 10:1 [10]. Gately et al. [10] estimated EROI for deepwater (depths of 900 m +) GoM using production data from the Minerals Management Service (MMS, now Bureau of Ocean Energy Management, Regulation and Enforcement) combined with previously published operational dollar cost estimates [11] and energy intensity factors which allow for the conversion from dollars to energy units [12]. EROI including only direct costs at 900m+ water depths ranged from 10–27:1 for the years 2000–2004 and 3–9:1 for the same years when including indirect costs of production [10].

The energy intensity factors used in past studies may be inaccurate due to changes in technology, advances in energy efficiency, and the scale of offshore operations since they were first proposed [12,13]. Unfortunately it is impossible to verify the accuracy of Gately’s study [10] or to recreate either analysis since no data were given.

The purpose of this paper is to calculate explicitly the Energy Return on Financial Investment (EROFI) [14] of oil and gas production in the ultra-deepwater Gulf of Mexico (GoM) for 2009 and the EROFI of oil in the Macondo Prospect. We also derived preliminary EROI estimates based on a range of energy intensity ratios [14,15].

The EROFI is an estimate of the financial cost for the production of a barrel of oil or natural gas expressed as barrel of oil equivalent (BOE). EROFI is the amount of money expended by an energy producing entity divided by the amount of energy produced. An energy producing entity must produce energy at sufficient economic profit while paying off the costs of the full supply chain of labor, materials, and transport in order to maintain a profitable business [14].

Profitability is, however, related directly to the supply chain costs. The entity fails to be financially profitable when the incurred costs are greater than the price of the product being sold. EROFI analysis provides insight into the base price for which a barrel of oil must be sold in order to maintain economic profitability.

EROI analysis is a tool used to measure the net energy of an energy supply process [16]. The net energy of an energy source is the amount of energy returned to society divided by the energy required to get that energy [17]. An energy source becomes an energy sink when the amount of energy used in extraction is greater than the extracted amount of energy (EROI < 1:1).

In 1930, the average domestic oil discovery yielded at least 100 units of energy equivalent output production for every unit of input, and that oil could be produced at a return of about 30 for one. [15,18]. Today, the average net energy measured by EROI of domestic oil production has declined to about 10:1, or 10 units of output for every unit of input [15,18].

The importance of EROI to a society is that the analysis provides a measure of the surplus energy gained from an energy source that can be diverted to other sectors of the economy to produce goods and services other than those required for energy extraction.

Decreasing EROI increases the proportion of economic output that goes into the energy extraction sector of the economy leaving fewer economic and energy resources available for non-energy extraction sectors. Net energy, and the associated surplus energy to society, declines with declining EROI. The trend towards low EROI fuels affects the quantity and affordability of the fuel supply [3].

This paper presents a detailed although non-comprehensive analysis of the EROFI for ultra-deepwater oil and gas in the GoM in 2009 and potential Macondo Prospect reserves using updated financial data. In particular data that have become available in the wake of the Deepwater Horizon oil rig disaster are used to increase understanding of the EROFI for energy production in the federally regulated ultra-deepwater outer continental shelf of the GoM. Because of a lack of access to accurate, comprehensive ultra-deepwater energy input production data and a degradation of federal energy use statistics, it is necessary to use financial data and convert this to energy inputs using energy intensity ratios in order to estimate the energy return on energy investment in the ultra-deepwater GoM in 2009.

GoM Oil Production

GoM federal offshore oil production accounted for approximately 29% of total U.S. oil production in 2009. Deepwater and ultra-deepwater GoM areas contributed to 80% of total federal offshore GoM oil in 2009 [19]. Deepwater (1,000–5,000 ft.) oil production in the GoM became a major part of U.S. domestic energy production in 1998 when shallow water production began to decline. Deepwater production peaked in 2004 and has been in decline ever since. Ultra-deepwater (>5,000 ft.) production has helped to offset the deepwater production decline in a similar manner as deepwater production had previously offset shallow-water production in the late 1990s.

Federal offshore production, formerly declining, increased by 33% (over 147 million barrels) between 2008 and 2009 [7,20]. The increase in production for 2009, however, reflects not only production from the new projects that came online, but also the addition of volumes that were shut-in during 2008 as a result of hurricane activity [9]. For oil, 75-percent of the increase in production in 2009 is a reflection of shut-in volumes coming back online [9]. Approximately one third of federal Outer Continental Shelf (OCS) oil production and one quarter of natural gas production in 2009 came from ultra-deepwater (depths >5000 ft).

The production from shallow waters is projected to continue to decline into the future [4]. Shallow water discoveries have declined from approximately 44 discoveries in 2005 to four discoveries in 2009 [21]. Deepwater and ultra-deepwater production is important for offsetting the loss of production from onshore and shallow water in order to maintain the domestic oil industry in the Gulf Coast region. Operating offshore in ultra-deepwater is more complex and more capital-intensive than operating in onshore environments where fixed costs are smaller and production profiles tend to decline at more predictable rates [4], which suggests that EROI there should be lower than for onshore oil. In addition, the largest remaining oil reserves in the GoM exist in the deepwater and ultra-deepwater environments [9] and thus we would expect that EROI would be lower than for onshore production.

The economic profitability of deep and ultra-deepwater production is dependent upon the price of oil and costs associated with exploration, production, transportation, processing, and delivery to end use as well as government subsidies. Past studies [22] concluded that a discovery containing at least about 1 billion barrels recoverable is required to support an ensuing development project for ultra-deepwater oil, which may cost upwards of $1 to $2 billion dollars in up-front Capital Expenditures (CAPEX, 22). Larger reservoirs generally yield higher production rates per well, thereby increasing net energy and financial profitability because less energy and money is required to extract oil from a larger reservoir (i.e., [14]).

GoM Rig Counts

The number of oil drilling rigs in Federal OCS waters affects the energy return on financial and energy investment. Increasing drilling effort does not always lead to an increase in production [17]. An increase in the number of rigs increases the financial costs of energy extraction, as more energy, labor, and raw materials are required per unit of energy produced. So long as rigs are adding proportional supply to the total energy produced, they are able to offset the increased financial and energy costs of ultra-deepwater projects. The technological advancement in rig design over the last 20 years has allowed for floating rigs including spars, semi-submersibles, and tension leg platforms to tap into multiple wells often miles apart in order to exploit reserves more efficiently, thereby decreasing financial and energy costs [23]. A few dozen rigs were responsible for 72% of the ultra-deepwater oil production in the GoM in 2007 compared to the five thousand or so rigs in shallow water [4]. The percentage of production attributed to smaller rigs is expected to continue to decline into the future [9].

The lifespan of a rig affects the amortized cost of the rig. Rigs have a lifespan of about ten years before a major work over is required [24,25].

Most ultra-deepwater drilling rigs were constructed within the last twenty years, as was the nine year-old Deepwater Horizon. The long-term leasing contract process allows rig construction costs to be recouped over a period of years and insures rig utilization. Rigs are mobile and often produce oil from several different fields over the course of their operational lifetime.

Daily operating costs for deepwater rigs have doubled over the course of the last decade partly as a result of increasing energy costs required by production operations for larger floating rigs often located 100+ miles from shore. At the same time, deepwater and ultra-deepwater drilling operations have become profitable in the age of oil at $50+/barrel and government subsidies [21,26]. Global investment trends provide evidence for continued deepwater production and decreased shallow and mid-water production [27].

Macondo Prospect Reserves and Cost Estimates

The Macondo Prospect is an oil and gas reservoir located in Mississippi Canyon Block 252 in the northern GoM just southeast of the mouth of the Mississippi River. The reservoir is in water depths greater than 4,900 ft. (1,700 m) and located more than 17,700 ft. beneath the ocean floor. BP officials estimated that there were approximately 50–100 million barrels of oil associated with the Macondo Prospect [28,29]. Oil companies do not usually extract 100% of the oil in a field [29]. We estimated that the reservoir would yield about 30% of the total reserves or between 15 million and 50 million barrels prior to the blow out.

The Deepwater Horizon rig was valued at $560 million when delivered to Transocean Ltd. in February 2001 and collapsed into the GoM in April 2010 during deployment at the Macondo Prospect [30]. Deepwater Horizon was a fifth generation semi-submersible offshore drilling rig that required approximately three years to construct. The average construction cost of floater rigs in operation in 2009 was $565 million dollars per rig [31]. At the time of its demise, the Deepwater Horizon was leased for three years at a total cost of $544 million which equates to a bare rig daily lease rate of $496,800/day.

The average daily operations cost for U.S. GoM semi-submersible rigs, including crew, gear, and vessel support operations for 2009 was approximately the same as the daily lease rate [32]. Thus, total daily operational cost was $993,600. This estimate is consistent with industry-wide costs for similar deepwater oil rigs [33,34].

Energy Intensity Ratios

The energy intensity ratio is the amount of energy required to produce $1 of GDP (or of some component of GDP) in a given year. The energy intensity ratio allows for the conversion from financial costs to energy costs in this and other studies. The energy intensity of production is correlated to effort, one variable of which is the number of rigs employed in production [35]. Other variables affecting energy intensity include the size and energy requirements of rigs and support vessels as well as the depth of resource deposits and distance offshore. Energy intensity ratios can be used to estimate approximate costs for many fuels where economic but not energy data are available [14,17,36], which was the case for our study. Usually it is applied only to indirect investments for situations where direct energy is known, such as for other studies in this volume.

Energy intensity ratios, for the economy as a whole and for individual industrial sectors, change due to inflation, as a result of material availability, and through efficiency gains. The mean energy intensity ratio for the U.S. economy in 2005 was approximately 8.3 Megajoules (MJ) per $1 USD.

The oil and gas industry is an energy intensive sector with an estimated energy intensity ratio of 20 MJ per $1 USD in 2005, while heavy construction during the same period was estimated to be 14 MJ per $1 USD [17].

Advances in energy efficiency and the steady decline in energy intensity ratios over time provide the rationale for estimates used in this study [37]. Previous research has shown that energy intensity ratios serve as an effective proxy in determining the EROI of various energy sources [38]. Energy intensity ratios, however, are not the singular, or best, method for determining EROI. Ideally, energy inputs would be measured directly for each step in the production process. This is often proprietary data not made available to the public or unaccounted for and therefore unavailable. Because of data limitations on energy inputs for ultra-deepwater production, the use of financial investment data used in conjunction with energy intensity ratios allows for a first approximation of EROI in analyzing an extremely important issue given the limited data availability and accessibility and the failure of earlier EROI studies to provide explicit data [14].

The objectives of this study were threefold: (1) To derive estimates of the energy return on financial investment for oil and oil + natural gas in the ultra-deepwater GoM in 2009 based on production and financial cost data; (2) To derive estimates of the energy return on financial investment for oil and oil+natural gas in the ultra-deepwater GoM in 2009 based on the same data plus estimates of energy intensities; and (3) To derive an estimate of the energy return on both financial and energy investment for the estimated total oil reserves of the Macondo Prospect based on industry stated estimates of reserves and financial cost data.

Methods

The methodology employed in this paper is based on the second order comprehensive EROI (EROIstnd) protocol described by Murphy and Hall [36] and previously by Mulder and Hagens [39]. We calculated energy return on financial investment based on King and Hall [14]. The EROFI for potential reserves in the Macondo Prospect was estimated based on annual costs multiplied by the number of years it would take to extract the reserves and divided. The EROFI for total energy produced in the ultra-deepwater GoM in 2009 was determined by dividing the by the reserve volume divided by the total financial costs per operational year. EROI estimates were then estimated using energy intensity ratios established for 2005 combined with production cost data adjusted for inflation. Financial input data includes rig construction and operation costs along with exploration costs. Energy output is based on Macondo oil reserve estimates and 2009 GoM ultra-deepwater oil and natural gas production.

The Macondo Prospect is an average ultra-deepwater well with respect to depth and location [40]. Since all GoM well reserves differ in size and productive capacity, we use the Macondo Prospect field as a proxy for similar sized ultra-deepwater GoM reserves. The period of time required to extract the Macondo reserves is important to the analysis. Increased extraction efficiency decreases operating and production costs that positively impact EROFI. A constant flow rate production profile would result in a higher energy return because of a shorter time for total production. However, virtually all producing wells follow a bell-shaped production profile based on the three phases of ramp-up, plateau, and decline [4]. We calculated EROFI and EROI values for constant and bell-shaped production profiles to demonstrate this difference. The bell-shaped profiles were generated using the MMS full potential scenario forecast methods based on past deepwater GoM production wells [41-42] as follows.

For total recoverable reserves of 50 million barrels in the Macondo Prospect and 30% extraction efficiency, 15 million barrels of oil would be pumped in 600 days if a constant flow rate of 25,000 bpd is assumed. If all of the 50 million barrels were recoverable at the same constant flow rate, it would take 2000 days. Peak production is based on the estimated ultimately recoverable reserves using the MMS full potential scenario forecast equation:

Peak Rate = (0.00027455) × (ultimate recoverable reserves) + 9000 where the peak rate is in barrels of oil equivalent (BOE) per day and the ultimate recoverable reserves are in BOE [41,42].

The parameters in this equation were derived by plotting maximum production rates of known fields against the ultimate recoverable reserves of those fields, and performing a linear regression between reserves and production [41,42]. These reserve estimates are on a field-by-field basis, so MMS assumed that this relation, based on historic field trends, could be applied on a project basis [41,42]. This equation is generally applied to reserves of 200 million barrels of oil equivalents and more and assuming peak production lasts for four years. For our analysis, we assumed peak flow rates lasted two years since Macondo reserve estimates were one half to one quarter of 200 million barrels and then declined at 12%/year [9]. During the first year of operation, production was set at half its peak rate [9,41,42].

Energy output for the entire GOM study was (BOE) produced in the ultra-deepwater GoM in 2009 [19]. One BOE is equal to 5,800 cubic feet of natural gas. Ultra-deepwater GoM production in 2009, was 182 million barrels of oil and 572 billion cubic feet of natural gas [9]; equivalent to a oil+natural gas total of 291 million BOE. Production costs were based on published rig counts and rig construction costs (Table 1) [31,43]. At any given time there were 25–30 rigs producing in ultradeepwater [43]. Amortized rig construction costs are based on the number of years it takes to drill a well and extract the resource.

Table 1. Estimated 2009 production costs for the Macondo Prospect and ultra-deepwater GoM rigs. Study # of Amortized Rigs Construction Cost Macondo Prospect 1 $62.2 million per year for nine years Ultra-Deepwater 25–30 $56.5 million per GoM year for 10 years Operating Cost $1 million per day $1 million per day Exploration Cost $1 million per day for 100 days $1 million per day for 100 days Total Cost per Year $527.2 million $13–15.7 billion

Exploratory costs are operational costs associated with finding and accessing a well prior to production. Technological advancement has led to a decrease in the amount of time required to drill a well. The first wells drilled in the GOM and Brazil took 180–240 days on average [43]. Now these wells are being drilled in 90–120 days [43] so we used 100 days at $1 million dollars per day based on average production costs.

We used published energy intensity ratios to derive the EROI values from the EROFI. The energy intensities are rough estimates of the energy used to undertake any economic activity derived from the national mean ratio of GDP to energy [17]. These ratios can be used to estimate rough costs for many fuels where economic but not energy data are available [44] and are based on non-quality corrected thermal equivalents [18].

The EROI calculation is limited by available data and is an estimate at the wellhead and not at the point of end use.

Estimates of the energy intensity ratio of U.S. oil and gas extraction averaged across all domestic fields and well depths was 9.87 MJ/$ in 1997, 14.5 MJ/$ in 2002, and 20 MJ/$ in 2005 [17,45]. This increase was not due to the energy intensity per dollar increasing, but because more of the downstream energy requirements were included in the higher energy intensity values. Based on these reports, we used energy intensity ratios of 7, 12, and 18 MJ to carry out a sensitivity analysis of the impact of different energy intensity ratios on EROI.

Energy output was based on 1 barrel of oil = 6.11 Gigajoules. EROFI costs are in 2009 USD$. EROI is based on 2009 USD$ costs, corrected for inflation using a factor of 1.10 [46], and presented in 2005 USD$ in order to maintain consistency with the energy intensity ratios used in the analysis. Total energy inputs are the summation of 10-year amortized rig construction costs, 100-day exploration costs per rig, and operational costs converted to energy units using the three different energy intensity ratios. Construction, operational, and exploration costs were summed and were then converted to energy units using the three energy intensity ratios described above.

A number of costs were not included because data were not available. These included rig and operator insurance costs, costs associated with enhanced recovery techniques and costs associated with dry holes. However, these costs are substantial [47].

Results

The financial cost per barrel of ultra-deepwater oil in the GoM at the well-head ranged from $71/barrel to $86/barrel based on the number of rigs deployed in production. The EROFI for oil + natural gas at the well-head in the GoM in 2009 ranged from 0.019 to 0.022 barrels (BOE), or roughly 0.85 gallons, per dollar, based on the number of rigs deployed in production.

The financial cost at the well-head per barrel of oil available in the Macondo Prospect based on the constant flow rate production profile, was $62/barrel assuming 15 million barrels produced per day, or $45/barrel if producing 50 million barrels over 2000 days. The EROFI at the well-head was $141/barrel of oil in the Macondo Prospect if 15 million barrels were produced over 4 years, or $84/barrel if producing 50 million barrels over 8 years is.

The preliminary EROI based on financial costs and subsequent sensitivity analysis using three different energy intensity ratios. ranged from 4:1 to 14:1 for 2009 total GoM ultra deepwater oil production while the EROI for total oil plus natural gas production in the ultra-deepwater GoM in 2009 was slightly higher at 7:1–22:1. The EROI for the Macondo Prospect using the MMS full potential scenario forecast varied from 4:1 to 16:1. The EROI of the constant flow rate scenarios for producing 15 and 50 million barrels in the Macondo Prospect at 25,000 bpd

Applying the MMS full potential scenario forecast equation to Macondo field reserves yielded a peak rate of 13,118 barrels/day for 15 million barrels and 22,728 barrels/day for 50 million barrels. If 15 million barrels is recovered, the well would be completely depleted within four years and if 50 million barrels is recovered, the well would be depleted within eight years. The financial costs associated with Macondo reserves on a four-year time scale total $1.8 billion while the costs on an 8-year time scale total $3.5 billion dollars. The EROI using the MMS production equation for one well producing total reserves of 15 and 50 million barrels, respectively, from the Macondo field for four years and eight years, respectively,

Discussion

Our values for EROFI at the well-head ranged from $45/barrel to $141/barrel. By comparison, production costs for Mideast and North Africa oil ranges from $6/barrel to $28/barrel [48] and for the United States overall roughly twice that. These values for the GOM indicate that if these resources are used as the basis of US oil use the price of oil would have to be in the range of current prices, which maybe too high to sustain economic growth [14,17].

Energy intensity ratios from the literature were then used to convert these results to energy-based EROI. The sensitivity analysis yielded EROI values ranging from 4–22:1. The lower end of this range of EROI may be more accurate since these values were derived using energy intensity ratios for the oil and gas industry. Increasing rig counts and time required for extraction negatively influenced EROI for the United States as a whole. EROI for domestic oil and gas has declined from 100:1 for discoveries in 1930 and about 30:1 for production in the 1950s–1970s to about 10:1 in 2005–7 [16,18].

EROI values presented in this study are in the lower range of previously published estimates for domestic oil production, especially if our preferred high energy intensities are used. The EROI for oil and gas at the well-head in ultra-deepwater in 2009 ranged from 7–22:1, while the EROI for oil alone in ultra-deepwater was 4–14:1. Most of the variability was our choice of energy intensities used per dollar, The Macondo Prospect EROI for oil alone using the MMS production profile curve yielded a similar EROI of 4–16:1 based on estimates of varying reserve sizes and costs associated with extraction.

The constant flow rate scenario for the Macondo Prospect yielded similar results in the range of 7–20:1. These values fit the trend of decreasing EROI over time as oil was produced from increasingly expensive fields.

Our EROI values can be compared to other reports of EROI for energy production processes including 80:1 for coal, 12–18:1 for imported oil, 5:1 or less for shale oil, 1.6 to 6.8:1 for solar, 18:1 for wind, 1.3:1 for biodiesel, 0.8 to 10:1 for sugarcane ethanol, and 0.8 to 1.6:1 for corn-based ethanol [3,44].

The EROI values of this study were based on financially-derived energy costs of production at the well-head only, and did not include all of the indirect costs of delivery to end use. Thus, these estimates are conservative.

If all indirect costs were included in the EROI calculations, EROI would decrease

This underscores the need to make accessible better energy accounting information so that more refined analyses of the EROI of ultra-deepwater energy extraction can be carried out. Unfortunately, funding is being cut for the U.S. Energy Information Agency, the agency charged with providing such information to the public [49]. The lack of data availability regarding energy extraction costs in the GoM makes it difficult for the individuals, interest groups, and political representatives to make wise decisions regarding offshore energy policy. Informed decision-making on energy policy is essential to the long-term sustainability of society.

One of the energy cost factors only partially included in this study is the number of exploratory vs. development wells drilled in the ultra-deepwater in 2009. Exploratory wells are necessary for new discovery and in the period from 2004–2008, 226 wells were drilled in the ultra-deepwater GoM, 31% of which were successful [9]. The number of exploratory vs. development wells drilled in 2009 was not factored into the EROI calculations of this study due to data availability constraints. The impact on EROI would depend on how many of the exploratory wells ultimately produce oil and in what quantity. In addition, the insurance costs associated with rigs operating in ultra-deepwater were not included but are estimated by market analysts to range between 10–35% of the present value of the rig [50]. For a $500 million dollar rig, that would add between $50–$175 million in insurance costs per year of operation. If all of these costs were included it might decrease the EROI by perhaps 25 percent.

More expensive, higher capacity rigs produce higher EROI oil when producing from large reservoirs with high daily flow rates. As daily production declines from the plateau phase, the EROI of the well decreases since the same operational and infrastructural costs are being utilized to produce less oil and gas. The tendency to ramp up production early in the production process to get the maximum possible production rates, leads to more rapid decline rates of deep and ultra-deepwater wells [4,21]. High capital costs of production require fast turnaround times to bring energy to market and recoup capital expenditures. Long-term production potential is bypassed for short-term market decision-making. As profit margins decline with decreasing production, marginal wells must be abandoned so that the drilling resources can be utilized at more productive wells.

The constant need to keep rigs in profitable production requires a consistent amount of exploratory drilling and new discoveries. Regardless of oil price, the energy required to extract the resource is relatively constant and increases with depth [10]. Thus, the rate of extraction and timing affects economic profitability but the net energy remains generally the same. Technological advancement may increase efficiency of extraction over time, thereby increasing energy return on investment but technology comes at the cost of research and development funding. A difficult situation arises when drilling contractors are prevented from accessing the resource either through federal regulation, as happened in 2010, or as a result of declining oil prices and decreasing production profitability. The latter is minimized through long-term contractual obligations. At the same time, the limited number of rigs in the deepwater drilling industry helps to maintain high usage rates for rigs in existence.

Whenever a contract goes un-renewed, that rig is often moved to another basin or resource pool where the rig can be put into operation for another contractor. This optimal use of rigs tends to increase EROI. The actual price of oil at any given time is essentially the same worldwide, regardless of energy costs of producing the oil. Thus, the price for deep and ultra-deepwater oil is sub-optimal when world oil prices are low.

A factor contributing to the increased drilling in the deep and ultra-deepwater of the GoM are federal government subsidies to drilling companies. This increases financial profitability for oil companies but does not affect EROI. According to the Federal Land Policy and Management Act [51], the Department of Interior is required by law to ensure that “the United States receive fair market value of the use of public lands and their resources unless otherwise provided for by statute”.

Subsidy statutes applying to deepwater energy production, that circumvent the fair market value provision, are mainly the result of the Deepwater Royalty Relief Act (DWRRA) and the Energy Policy Act of 2005. The Deepwater Royalty Relief Act granted exploration leases issued between 1996 and 2000 an exemption from paying the government royalties on oil produced by wells that would not otherwise be economically viable. The program has been extended since its original expiration date in 2000. In addition, the Energy Policy Act put an oil-price threshold below which producers would not have to pay the government royalties thereby providing further incentive for companies to drill in the offshore GoM.


Numerous studies have shown royalties paid to the government for GoM offshore production are among the lowest rates paid to any fiscal system in the world [52,53]. The government is effectively subsidizing the most profitable corporations in the world at the expense of public taxpayers. These subsidies provide false market signals to continue energy supply processes that otherwise would not be competitive, thereby reducing economic efficiency [54]. This encourages oil companies to go after low EROI oil reserves that would likely not be produced without subsidies. Such subsidies further obscure reality by causing alternative energy markets to be less cost competitive [55].

Another indirect cost not accounted for in this study includes the cost of the loss of the value of ecosystem services as a result of federal offshore energy production. Air and water pollution attributed to the oil and gas industry are market externalities that in reality have costs borne by society. Ecosystem degradation in the form of wetland loss, partly as a result of oil and gas industry infrastructure, has increased the risk of natural disasters to coastal communities [56]. Batker et al. [57] carried out a partial assessment of the value of ecosystem services of the Mississippi River delta. They reported an annual value of ecosystem services of $12 to $47 billion and a minimum natural capital asset value of the delta of $330 billion to $1.3 trillion.

The damage to marine and coastal environments associated with the Macondo Prospect blowout is substantial. Commercial fisheries production and economic losses to the coastal tourism sector are expected to cost tens of billions of dollars. Including such costs in the analysis would likely cause the Macondo Prospect EROI to be negative. Ecosystem service values are largely outside the scope of the market economy, thereby discounting their importance to society.

References and Notes

  1. Hofmeister, J. Shell Oil Company; Statement before the House Select Committee on Energy Independence and Global Warming. Washington, DC, USA, 1 April 2008.
  2. Robertson, P.J. Chevron Corporation; Statement before the House Select Committee on Energy Independence and Global Warming. Washington, DC, USA, 1 April 2008.
  3. Hall, C.A.S.; Day, J.W. Revisiting the limits to growth After Peak Oil. Am. Sci. 2009, 97, 230-237.
  4. Kaiser, M.J.; Yu, Y.; Pulsipher, A.G. Assessment of marginal production in the Gulf of Mexico and lost production from early decommissioning. Prepared for the U.S. Department of the Interior, Minerals Management Service: Gulf of Mexico OCS Region. April, 2010. MMS 2010–007.
  5. Ultra-Deepwater Advisory Committee (UDAC). A Federal Advisory Committee to the U.S. Secretary of Energy Meeting Minutes. San Antonio, TX, USA, 16–17, September 2009. www.fossil.energy.gov/programs/oilgas/ultra_and_unconventional/2010_Annual_Plan/11th_UDAC_ Meeting_Minutes.pdf
  6. USA Central Intelligence Agency World Factbook 2010. https://www.cia.gov/ library/publications/the-world-factbook/fields/2174.html (accessed on 26 January 2011).
  7. USA Energy Information Agency Crude Oil Proved Reserves, Reserve Changes, and Production; Federal Offshore Louisiana and Texas 2010. Available online: http://www.eia.gov/dnav/pet/ pet_crd_pres_dcu_R1901F_a.htm (accessed on 1 February 2011).
  8. USA Department of Energy. Offshore Technology Roadmap for the Ultra- Deepwater Gulf of Mexico, November 2000. fossil.energy.gov/programs/oilgas/publications/ oilgas_generalpubs/offshore_GOM.pdf
  9. USA Minerals Management Service. 2009 Gulf of Mexico Oil and Gas Production Forecast 2009–2018, OCS Report MMS 2009–012; New Orleans, Louisiana May 2009. Available online: www.gomr.boemre.gov/PDFs/2009/2009-012.pdf (accessed on 26 January 2011).
  10. Gately, M. The EROI of US offshore energy extraction: A net energy analysis of the Gulf of Mexico. Ecol. Econ. 2007, 63, 355-364. 11. Dismukes, D.E.; Olatubi, W.O.; Mesyanzhinov, D.V.; Pulsipher, A.G. Modeling the Economic Impacts of Offshore Oil and Gas Activities in the Gulf of Mexico: Methods and Applications. Prepared by the Center for Energy Studies, Louisiana State University, Baton Rouge, La. U.S. Department of the Interior, Minerals Management Service, Gulf of Mexico OCS Region, New Orleans, Louisiana, 2003. MMS 2003–018.
  11. Costanza, R.; Herendeen, R.A. Embodied energy and economic value in the United States economy 1963, 1967, and 1972. Resour. Energy 1984, 6, 129-163.
  12. Gately, M. Rocky Mountain Institute: Boulder, CO, USA. Personal Communication, August 2010.
  13. King C.W.; Hall, C.A.S. Relating financial and energy return on investment. Sustainability 2011, 3, 1810-1832. 15. Guilford, M.C.; Hall, C.A.S.; Cleveland, C.J. A new long term assessment of EROI for U.S. Oil and gas production. Sustainability 2011, 3, 1866-1887.
  14. Cleveland, C.J.; Costanza, R.; Hall, C.A.S.; Kaufmann, R. Energy and the United States economy- A biophysical perspective. Science 1984, 225, 890-897.
  15. Hall, C.A.S.; Balogh, S.; Murphy, D.J.R. What is the minimum EROI that a sustainable society must have? Energies 2009, 2, 25-47.
  16. Cleveland, C.J. Net energy from the extraction of oil and gas in the United States. Energy 2005, 30, 769-782.
  17. USA Minerals Management Service. Energy Information Agency Office of Oil and Gas; Gulf of Mexico Fact Sheet 2010. Available online: www.eia.doe.gov/special/gulf_of_mexico/index.cfm (accessed on 1 February 2011).
  18. IHS CERA. The Role of Deepwater Production in Global Oil Supply. Cambridge Energy Research Associates: Cambridge, MA, USA, 2010. Available online: http://press.ihs.com/pressrelease/energy-power/ihs-cera-role-deepwater-production-global-oil-supply (accessed on 1 February 2011).
  19. S. Gavin ODS-Petrodata Consulting & Research; Presentation entitled “The outlook for offshore drilling” presented in Beijing and Singapore 19 and 22 March 2010. Available online: http://www.ods-petrodata.com/odsp/presentations.php (accessed on 1 February 2011).
  20. Anderson, R.N.; Boulanger, A. Prospectivity of the Ultra-Deepwater Gulf of Mexico. Lean Energy Initiative Lamont-Doherty Earth Observatory Columbia University; Palisades, NY, USA, Energy Initiative Lamont-Doherty Earth Observatory Columbia University; Palisades, NY, USA, 02.pdf (accessed on 1 February 2011).
  21. USA Bureau of Ocean Energy Management, Regulation and Enforcement. Technology Assessment & Research (TA&R) Project Categories: Offshore Structures, 2010. Available online: http://www.boemre.gov/tarprojectcategories/structur.htm (accessed on 1 February 2011).
  22. National Subsea Research Institute. Research aims to double the lifespan of oil rigs. Professional . Professional 2034033771.html (accessed on 1 June 2011).
  23. Sharma, R.; Kim, T.; Sha, O.P.; Misra, S.C. Issues in offshore platform research-Part1: Semi-submersibles. Int. J. Nav. Archit. Ocean Eng. 2010, 2, 155-170.
  24. USA Department of Energy. Offshore Roadmap 2000. Available online: fossil.energy.gov/ programs/oilgas/publications/oilgas_generalpubs/offshore_GOM.pdf (accessed on 1 February 2011). 27. Triepke, J. Analysis: 2009 Jackup Market Review. Rigzone: Houston, TX, USA, 11 December 2009. http://www.rigzone.com/news/article.asp?a_id=83956
  25. Klump, E. Anadarko May Take Biggest Hit from Gulf Oil Spill. Bloomberg News Service: New . Bloomberg News Service: New 13/anadarko-may-take-biggest-hit-from-gulf-oil-spill-as-bp-s-silent-partner.html
  26. Scherer, R. What if BP taps leaking Macondo well again? Christian Science Monitor: Boston, MA, USA, 19 May 2010.   http://www.csmonitor.com/USA/2010/0519/Gulf-oilspill-What-if-BP-taps-leaking-Macondo-well-again 30. Offshore-technology.com. Deepwater Horizon: A Timeline of Events. Available online: http://www.offshore-technology.com/features/feature84446/ (accessed on 1 February 2011).
  27. Offshore Drilling Monthly. Jefferies & Company, Inc.: New York, NY 10022, January-December Issues 2009.
  28. Rigzone Inc. Offshore Rig Day Rates. http://www.rigzone.com/data/dayrates/ (accessed on 31 May 2011).
  29. Leimkuhler, J. Shell Oil: How Do We Drill For Oil? Presented at the 2nd Annual Louisiana Oil & Gas Symposium, Baton Rouge, Louisiana, USA, August 2010.
  30. Rigzone Inc. Today’s Trends: Offshore Rig Construction Costs.

http://www.rigzone.com/news/article.asp?a_id=87487

  1. Hall, C.A.S.; Cleveland, C.J. Petroleum drilling and production in the United States, yield per effort and net energy analysis. Science 1981, 211, 576-579. 36. Murphy, D.J.; Hall, C.A.; Dale, M.; Cleveland, C. Order from chaos: A preliminary protocol for determining the EROI of fuels. Sustainability 2011, 3, 1888-1907. 37. USA Energy Information Agency. Annual Energy Outlook 2011 Report #:DOE/EIA-0383 ER, 2011. Available online: http://www.eia.doe.gov/forecasts/aeo/early_intensity.cfm (accessed on 1 February 2011).
  2. King, C.W. Energy intensity ratios as net energy measures of United States energy production and expenditures. Environ. Res. Lett. 2010, 5, 044006.
  3. Mulder, K.; Hagens, N.J. Energy return on investment: Toward a consistent framework. Ambio 2008, 37, 74-79.
  4. Berman, A. Causes and Implications of the BP Gulf of Mexico Oil Spill Presented at ASPO-USA World Oil Conference. Labyrinth Consulting Services Inc.: Washington, DC, USA, 9 October 2010.
  5. USA Minerals Managements Service. 2007 Gulf of Mexico Oil and Gas Production Forecast 2007–2016. OCS Report MMS 2007–020: New Orleans, LA, USA, May 2007.
  6. USA Minerals Managements Service. 2009 Gulf of Mexico Oil and Gas Production Forecast 2009–2018, OCS Report MMS 2009–012: New Orleans, LA, USA, May 2009.
  7. Triepke, J. Analysis: 2009 Floater Rig Market Review. Available online: http://www.rigzone.com/ news/article.asp?a_id=84343 (accessed on 1 February 2011).
  8. Murphy, D.J.; Hall, C.A.S. Year in review-EROI or energy return on (energy) invested. In Ecological Economics Reviews; Wiley-Blackwell, Ames, IA, USA, 2010; Volume 1185, pp. 102-118.
  9. Carnegie Mellon University Green Design Institute. Economic Input-Output Life Cycle Assessment (EIO-LCA), US 1997 and 2002 Industry Benchmark model. Available online: http://www.eiolca.net (accessed on 28 February 2011). 46. United States Department of Labor, Bureau of Labor Statistics. CPI Inflation Calculator. Available online: http://www.bls.gov/data/inflation_calculator.htm (accessed on 8 July 2011). 47. Weglein, A.B. Statement before the Subcommittee on Energy and Air Quality of the Committee on Energy and Commerce. The Ultra Deepwater Research and Development: What are the Benefits? Serial No. 108-77. 108th Congress U.S. House of Representatives: Washington, DC, USA, April 29, 2004. Available online: http://www.access.gpo.gov/congress/house/ house05ch108.html (accessed on 4 April 2011).
  10. International Energy Agency. World Energy Outlook 2008. ISBN 978-92-64-04560-6 http://www.iea.org/w/bookshop/add.aspx?id=353 (accessed on 23 June 2011).
  11. USA Energy Information Agency. Immediate Reductions in EIA’s Energy Data and Analysis Programs Necessitated by FY 2011 Funding Cut. U.S. Energy Information Administration: Washington D.C., USA; April 28, 2011. http://www.eia.gov/pressroom/ releases/press362.cfm
  12. Slanis, B. Willis Group Holdings: “Upstream insurance” Presented at the 2nd Annual Louisiana Oil & Gas Symposium. Baton Rouge, Louisiana, USA, August 2010.
  13. USA Congress. Federal Land Policy and Management Act. Declaration of Policy. U.S. Code 43, Section 1701(a)(9). U.S. Congress: Washington D.C. USA, 2007. Available online: http://codes.lp.findlaw.com/uscode/43/35/I/1701 (accessed on 1 February 2011).
  14. USA Government Accountability Office. Oil and Gas Royalties: A Comparison of the Share of Revenue Received from Oil and Gas Production by the Federal Government and Other Resource Owners, Report No. GAO-07-676R;U.S. GAO: Washington D.C., USA, 1 May 2007; p. 3.

www.gao.gov/products/GAO-07-676R

  1. USA Government Accountability Office (GAO). Oil and Gas Royalties: The Federal System for Collecting Oil and Gas Revenues Needs Comprehensive Reassessment; U.S. GAO: Washington D.C., USA. September 2008; p. 6. Available online: www.gao.gov/new.items/d08691.pdf (accessed on 16 October 2011)
  2. Freudenburg, W.R.; Gramling, R.; Laska, S.; Erikson, K.T. Organizing hazards, engineering disasters? Improving the recognition of political-economic factors in the creation of disasters. Soc. Forces 2008, 87, 1015-1038.
  3. Environmental Law Institute 2009. Estimating U.S. Government Subsidies to Energy Sources: 2002-2008. The Environmental Law Institute: Washington, D.C., USA. Available online: http://www.eli.org/Program_Areas/innovation_governance_energy.cfm (accessed on 16 October 2011) 56. Costanza, R.; Perez-Maqueo, O.; Martinez, M.L.; Sutton, P.; Anderson, S.J.; Mulder, K. The value of coastal wetlands for hurricane protection. Ambio 2008, 37, 241-248.
  4. Batker, D.; et al. Gaining Ground: Wetlands, Hurricanes and the Economy: The Value of Restoring the Mississippi River Delta. Earth Economics: Tacoma, WA, USA; 2010.

www.eartheconomics.org/FileLibrary/file/Reports/Louisiana/Earth_Economics_Report_on_the_ Mississippi_River_Delta_compressed.pdf


Posted in EROEI Energy Returned on Energy Invested, Threats to oil supply | Tagged , , , , , | 1 Comment

Tar sand EROI 2013 Poisson and Hall

Alexandre Poisson, Charles A. S. Hall. 2013. Time Series EROI for Canadian Oil and Gas. Energies 2013, 6, 5940-5959

[ This is an extract from this 20-page paper. Tar sands are the hope offered by techno-optimists that a great deal of oil remains. Since I leave out tables, charts, and so much of the text, do read the published paper if this interests you. ]

Abstract

Modern economies are dependent on fossil energy, yet as conventional resources are depleted, an increasing fraction of that energy is coming from unconventional resources such as tar sands. These resources usually require more energy for extraction and upgrading, leaving a smaller fraction available to society, and at a higher cost.

Here we present a calculation of the energy return on investment (EROI) of:

  • All Canadian oil and gas (including tar sands) 1990–2008. Since the mid-1990s, total energy used (invested) in the Canadian oil and gas sector increased about 63%, while the energy production (return) increased only 18%, resulting in a decrease in total EROI from roughly 16:1 to 11:1.
  • Tar sands alone (1994–2008). We found (with less certainty) that the EROI for tar sands has been around 4:1 since 1994, with only a slight increasing trend.

My comment: Later on in this paper it states only mined tar sand EROI was calculated (not in situ). Brandt [17] found that mined oil sands have the highest EROI of 5.5 to 6. Poisson and Hall cite 4:1. I think their lower result is because Brandt didn’t include the EROI of refining tar sand oil into usable syncrude oil). Brandt et al found that in situ EROI is only 3.5 to 4. Later, Poisson and Hall imply that in situ may not be viable energetically, but that mined may be possible.  The last I looked, mined was perhaps 10% of the tar sands, which would leave 90% as unexploitable resources (though there are plans to put in nuclear reactors to make in situ possible when the natural gas runs out).

We used energy production and energy use data from Statistics Canada’s Material and Energy Flow Accounts (MEFA). We were able to quantify both direct and indirect energy use, the latter from Statistics Canada’s energy input-output model.

Finally, we analyzed underlying factors possibly influencing these trends.

Introduction

Production of unconventional oil (diluted bitumen and synthetic crude from tar sands) has grown rapidly, almost tripling between 2000 and 2011, from 0.6 mbbl/d to 1.6 mbbl/d [6], and now even surpassing that of conventional oil

Originally, tar sands production (which began in 1967) was restricted to surface mining and upgrading operations. Since approximately the year 2000, recovery of tar sands from deeper layers using underground (in situ) extraction techniques has expanded, and now represents ~50% of total tar sands production

From the perspective of energy systems analysis, the shift in energy resources from conventional to unconventional oil and gas can be described as a decrease in natural resource quality [7]. It can be quantified empirically in part by using the metric of energy return on investment (EROI), the ratio of energy output (returned) over energy input (invested) in an extraction process [8,9]. EROI captures the idea that society has to divert some portion of its existing or immediately available energy resources away from production to meet final demand, and instead invest it to extract more of the same (or an equivalent) energy resource, such as a coal deposit or an oil and gas reservoir. As such it is one index of the quality of that resource. This ratio of energy output over energy input may vary over space and time, based on many geological, technical and economic factors, including:

The initial concentration and total size of a resource, ease of access, efficiency of further conversions (e.g., chemical refining or electricity production) and depletion of the resource. As conventional oil and gas resources are increasingly depleted around the globe, the EROI of these resources are showing declining trends.

Recently, Brandt et al. [17] published the most detailed and complete energy analysis of tar sands. It uses high quality data from the Alberta government in physical units. Their data and analysis covered both in situ and surface mining, was disaggregated in terms of tracking the different types of fuel used, and spanned a wide period of time (from 1970 to 2010), at high temporal resolution (per month). It included good data on the energy used directly but did not include indirect energy uses, that is energy used off site to generate materials used on site.

Freise [16] calculated a preliminary time series EROI for conventional Canadian oil and gas from 1950 to 2010 using a monetary technique that we believe can be improved upon. Thus more accurate estimates of the EROI of Canadian oil and gas are needed to detect important trends in time, compare the extraction efficiency of Canadian oil and gas with that of other countries and compare the EROI of conventional with unconventional oil.

In this paper we present a calculation of the energy return on investment (EROI) for all Canadian oil and gas combined (including conventional oil, natural gas, natural gas liquids and tar sands) from 1990 to 2008, and similarly for that of tar sands alone, from 1994 to 2008. We compare these two results, detect any significant trends, and discuss possible underlying factors which may explain the temporal trends. Due to the high quality of the energy data derived from Statistics Canada’s database (in energy units), our study allowed for independently testing the validity of some common methodological assumptions employed in estimating energy expenditures at the national level over time. We discuss this in more detail below, and make some

Methods

Energy return (outputs, or production) data for hydrocarbons is easily available through various organizations and at different scales. However, it is usually much harder to get data on energy inputs, both direct and indirect, especially in energy units covering long periods of time [18]. In this context, direct energy is defined as the energy commodities (e.g., diesel, gas, electricity) used on sites owned by the industry for its own production [19]. In the case of oil and gas extraction, direct energy use includes the sum of energy commodities used at the site of extraction, up to the point of shipment from the producing property, during all activities in the exploration and preparation of natural gas, crude oil, natural gas liquids, and synthetic crude oil and bitumen (both surface mining and in situ extraction of tar sands). Indirect energy is defined as the energy used elsewhere in the economy for the production of the goods and services that are used by the industry in the production of that resource [7,20,21].

Since the introduction of net energy (and EROI) analysis in the late 1970s, there has been considerable debate as to the most appropriate method to use for estimating indirect energy costs, particularly the energy embedded in materials and services [7,9,19,22–26].

Traditionally, two methods have existed to estimate the indirect energy embodied in goods and services: process-analysis and input-output analysis [7,22]. Process analysis is a micro-level technique which involves tracking, at a very detailed level, all individual materials and energy flows needed to manufacture a unit of product of interest, through many stages of a complex production and supply chain. It carries the advantage of being quite precise and specific. But due to the complexity and interconnectedness of the industrial system, the analysis must eventually be truncated [29] resulting in a systematic underestimation of the energy costs by an unknown factor. The second method, energy input-output analysis, is a more comprehensive and macro-level approach. An input-output model is a complex matrix of all financial transactions in a society, aggregated in sector categories, and organized by government agencies into national input-output accounts [7,24,28]. It can be used to identify how much activity (e.g., energy commodity inputs) from all other sectors of the economy (coal, iron, paper, business services) were necessary to generate a commodity of interest (e.g., steel output).

Although it lacks precision because of data aggregation, it benefits from being very comprehensive as the boundary of analysis is essentially infinite, encompassing all upstream stages of production and supply [28,30]. Early on, Bullard et al. [23] developed a procedure to combine the advantages of both process-analysis and input-output analysis, which they termed the hybrid approach. Increasingly, a hybrid approach is being recommended to provide sufficient precision and accuracy for robust results in both net energy analyses and greenhouse gas emissions inventories [30].

Along these lines, Murphy et al. [18] provide guidelines for evaluating EROI (including time-series EROI), combining direct energy use data in energy units and information derived from industry expenditure or sales data and national energy input-output tables. We essentially follow their description of “standard” EROIstnd at the “mine-mouth”.

Energy Return: Production of Canadian Oil and Gas

We used data on production of Canadian hydrocarbons from Statistic Canada’s Socioeconomic Information Management (CANSIM) database for oil, natural gas and natural gas liquids [5,31,32]. The CANSIM production data covers the period from 1985 to 2010 (although we use only data from 1990 to 2008, to match energy use data), and provides detailed production data by province and by fuel type (in units of volume per year) (see Table 1). We converted these annual production volumes into energy units using energy content factors (heat values) from the Alberta Government (see Table 2) [33]. These numbers differ only slightly from those from other sources, such as from Canada’s National Energy Board [34]. We chose the ones provided by the Alberta government because they were more complete, including values for synthetic crude and bitumen.

EROI of Canadian Oil and Gas

We calculated the EROI time series for Canadian oil and gas in two ways, first by dividing the annual energy production (energy return) by the annual direct (only) energy used (energy invested) and second by both direct and indirect energy used (see Section 2.2). The difference in the two EROI time series shows the sensitivity of the results to a change in the boundary of analysis; from accounting only for the direct consumption of energy commodities (e.g., diesel, gas, etc.), to also including the indirect energy embodied in the equipment and services used in the oil and gas extraction sector.

EROI for Tar Sands

Because of data limitations and study scope, we restricted our EROI calculation of tar sands to surface mining and upgrading operations, and to direct energy use only (thus excluding in situ extraction and indirect energy use).

The end product of surface mining is synthethic crude oil. Bitumen from the mines is upgraded to produce a substance chemically similar to conventional crude oil (named synthetic crude, or syncrude). Our EROI analysis includes the energy required to extract the mixture of bitumen and sand from the ground, separate it, and upgrade it to syncrude oil.

For our EROI calculation, we paired the output energy data from Statistics Canada’s CANSIM dataset (1994–2008) [5] to the energy input data from CIEEDAC (1994–2001) [43] and from Natural Resource Canada’s CIPEC report (2002–2008) [42], as shown in Table 5. We also include the energy production data (million barrels of syncrude) provided in the CIPEC report for the year 2000–2008 (Table 5) [42] to illustrate uncertainties associated with combining these datasets. Unfortunately, these energy production values differ by as much as 60%, which is unusual for energy production data. This results in a high and low estimate for the EROI of tar sands from surface mining for the years 2002 until 2008. We use the average of these two EROI calculations for our final estimate, but also present the high and low estimates in the results section below.

Table 5. Energy use and production for tar sands from surface mining

Results

The EROI for Canadian oil and gas combined using both direct and indirect energy, was about 16:1 in 1997 and has declined to about 11:1 in 2008, whereas when calculated using only direct energy, it was 18:1 in 1998, and decreased to about 13:1 in 2008. The EROI for tar sands alone (from surface mining only, and considering only direct energy inputs) averaged about 4:1 throughout the period analyzed, with only a slight increasing trend.

Freise’s EROI estimates were derived by estimating energy use (investment) in the oil and gas extraction sector from financial data alone and using a constant energy intensity factor (24 MJ/$US, 2005) for the entire 60 year period of his study (see below for further discussion). We believe that the direct and indirect energy use data from Statistics Canada (in energy units) have allowed us to get a more accurate estimate of energy use and hence EROI. This allows us to test the accuracy of Freise’s EROI estimates for the period where our studies (and reported data) directly overlap (1993–2008).

There are five approaches used by Freise that we believe can be improved upon (1) he used financial data alone to estimate both direct and indirect energy use; he also (2) multiplied the annual monetary expenditure for the industry (with some correction for inflation) by a single money-to-energy conversion factor for the entire 60-year study period. This assumes that the energy use intensity (i.e., MJ per dollar of expenditure, or dollar of production) of the Canadian oil and gas industry stayed constant over more than half a century, regardless of any technology change. Furthermore, his study also (3) used a money-to-energy conversion factor (24MJ/$US 2005) from a different country than the one under study (from the US instead of Canada); (4) used a single correction factor for currency fluctuations between the US and Canada for the entire 60-year study period; and (5) used a general consumer price index for inflation correction of the monetary expenditure, instead of a sector-specific producer price index (prices of commodities in specific industry sectors vary more from year to year than the average national inflation rate, especially in the oil and gas industry).

Our EROI estimates for tar sands fall within the range of previously published studies. Brandt et al. provide the most detailed analysis of tar sands yet. They find EROI values for tar sands (from both surface mining and in situ extraction, with direct energy only) fluctuating between 2.5:1 and 4:1 during the period from 1990 to 2003, very similar to our results.

After 2003, the EROI of tar sands from surface mining increases to around 6:1, showing a gain in extraction efficiency. Our results for surface mining show less fluctuation than Brandt’s. We also detect a similar (but very small) upward trend in EROI during this same period. The data used by Brandt is much more detailed (disaggregated) than ours, and we believe their more precise EROI values are more accurate and rich for interpretation. For example Brandt et al. are able to distinguish energy investment coming from the resource itself (coke and process gas) from external purchased energy (natural gas), and with this calculate a general EROI (low, around 6:1) and an external EROI (larger, around 15:1) [17].

Thus while we find low EROI values for tar sands, Brandt et al. show that for surface mining, much of the energy invested is from the resource being exploited, not after being processed through society. And therefore, in this regard, the extraction may be expensive, but possible. The fact that we both have similar results gives confidence to our analysis, and the general conclusions we derive from it.

For oil and gas extraction, Grandell et al. [14] found a temporal pattern quite similar to ours, in the case of Norway: an increase in EROI from 1991 to 1996, and then a decline until 2008. On the other hand the absolute values, ranged between 40:1 and 60:1, are much higher than our range of between 16:1 and 10:1. Gagnon et al. [10] estimated an EROI time series for global oil and gas between 1992 and 2006, and also found an increase in EROI until 1999, flowed by a decline (with a range in values between 18:1 and 35:1). Guilford et al. [13] examined the EROI of US oil and gas over a longer period: at five year intervals since 1972, and with more sparse estimates going back to 1919. Again, they found an increase in the EROI for oil and gas from 7:1 in 1982 to 16:1 in 1992, followed by a decline to approximately 11:1 in 2007. However, the problem in comparing and interpreting these studies directly is that the quality of the data and assumptions employed (to fill data gaps) differ, with large but generally unknown uncertainties in the EROI estimates.

Interpretation and Implications

The authors of the above studies for Norway, the US, Canada and at a global scale, tend to conclude that recent declines in EROI observed globally are likely due to the depletion of the highest quality conventional oil reserves internationally, and in some cases to an increase in drilling effort not associated with an increase in output [10–16]. As easily accessible oil and gas becomes more scarce, and the international price of oil rises, investments flow to resources which are more costly to exploit, both energetically and financially. Our preliminary analysis of underlying factors in Canada seems to support this interpretation, although more in depth time-series statistical modeling is required to test the accuracy of these ideas further.

The general concern in this field is that if the EROI of our major fuels continue to decline, and if the replacement “green” energy sources (with their backups) have as low an EROI as appears to be the case at this time, there is likely to continue to be a decline in the economic surplus and economic growth that previous generations had taken for granted and that seems to be increasingly characteristic of OECD countries. Will declining EROI further stress governments increasingly unable to meet legal financial commitments such as schools and pensions?

Posted in Charles A. S. Hall, EROEI Energy Returned on Energy Invested, Tar Sands (Oil Sands) | Tagged , , , | 1 Comment

Book review of Door to Door and the amazing world of transportation

Edward Humes.  2016. Door to Door: The Magnificent, Maddening, Mysterious World of Transportation. HarperCollins.

A book review by Alice Friedemann at www.energyskeptic.com  author of “When Trucks Stop Running: Energy and the Future of Transportation, 2015, Springer]

I was in the transportation business for 22 years at American President Lines, where I designed computer systems to seamlessly transfer cargo between ships, rail, and trucks for just-in-time delivery.  Every few weeks I was on call 24 x 7, because if computer systems are down, cargo isn’t going anywhere.

Humes writes about the amazing complexity of transportation in delightful ways that will change how you look at the world around you.

He begins simply, with how a morning cup of coffee has a transportation footprint of at least 100,000 miles.  His 6.3 mile drive to get the coffee is just a small fraction of that journey.  The car itself embodies at least 500,000 miles when you add up how many miles the raw materials for it traveled. And when you add in other miles part of a morning routine — the orange juice, dish soap, socks — you’re talking over 3 million miles of goods moved.

After reading this book, you will appreciate how pizza arrives at your door a great deal more.  At a chain-pizza central distribution center in Ontario, California, 14 big rigs arrive at 4 am every day, 2 of them with Mozzarella in 2,736 15-pound bags traveling 233 miles.  Other ingredients/miles: 936 cases tomato sauce/278, Pepperoni and other meat/1,400,  chicken toppings/1,600, Salt/1,900 and so on.  Empty pizza boxes arrive many times a day from 33 miles away (though the pizza box store got them from 2,200 miles distant).   And that’s just the start of how that pizza eventually arrives at your door.

But pizza is nothing compared to what United Parcel Service does.  I especially liked what UPS manager Noel Massie had to say about how trucks are vital to the economy and our way of life but treated like interlopers on America’s roads. He’d like to see dedicated highway freight lanes—high-speed lanes just for trucks, isolated from passenger traffic—and greater public transportation investment to take cars off the road, making room for those freight lanes and more trucks.   “It’s simple, really. Trucks are like the bloodstream in the human body. They carry all the nutrients a body needs in order to be healthy. If your blood stops flowing, you would die. If trucks stop moving, the economy would die. People have become truck haters. They want them off the road.  People don’t know what they’re asking for.”

Massie is right — if trucks stopped running, tens of millions of Americans would die (i.e.  (1) Holcomb 2006. When Trucks Stop, America Stops. American Trucking Assoc, 2) McKinnon 2004 Life without Lorries, or 3) A Week without Truck Transport. Four Regions in Sweden).

Trucks run on diesel fuel, which is finite. I am flabbergasted that people assume the economy will keep growing and that we can continue to drive cars forever, when conventional oil production peaked in 2005 (90% of oil is conventional).  Conventional oil practically flows out of the ground unaided, unconventional oil is nasty, gunky, distant, difficult to get, and uses so much energy that far less is available to society at large.

On top of that, the transportation that matters — ships, rail, and trucks, use diesel engines, nearly as essential as the fuel they burn due to their energy efficiency (twice as good as gasoline engines) and ability to do work.  Diesel engines can last 40 years and go a million miles.  Indeed, Smil makes the case that civilization as we know it depends on diesel engines ([Prime Movers of Globalization: The History and Impact of Diesel Engines and Gas Turbines (MIT Press)].  Replacing billions of vehicles and equipment with diesel engines before oil starts declining in earnest will be difficult.  We don’t want to throw out the trillions of dollars invested in current vehicles and the distribution system.  Ideally we need a “drop-in” fuel that diesel engines can burn.  Diesel engines can’t burn gasoline or ethanol, and can be harmed by biodiesel, so most engine warranties restrict biodiesel from nothing up to 20% of diesel fuel. Nor can diesel engines run on natural gas (CNG or LNG). Trucks are too heavy to run on batteries, and too expensive to build with dual modes of propulsion (so they can get off the electric line to go to their destination). If overhead electric catenary wires were used, how many more power plants would need to be built?   And not all “trucks” can use them, we can’t string overhead wires over millions of acres of farmland to run tractors and harvesters on, and all the other off-road trucks that mine, log, maintain the electric grid transmission wires, etc.  If the intersection of transportation and energy interests you, I recommend [ When Trucks Stop Running: Energy and the Future of Transportation (SpringerBriefs in Energy)]

Most books, including this one, assume endless growth will continue and discuss ways of reducing congestion. But not to worry — oil and other vital resources such as phosphorus will decline soon enough, because energy and natural resources are finite.  We’ve all been brainwashed to ignore that by the neoclassical economic system which denies such obvious truths as limits to growth.  A book that explains this, and which ought to be the standard economics textbook is  [Energy and the Wealth of Nations: Understanding the Biophysical Economy].  After you read it, you will understand why the economists of today will be considered as crazy as Scientologists and other religious cults in the future [Inside Scientology: The Story of America’s Most Secretive Religion].


Excerpts from the book

More than smartphones, more than television, more than food, culture, or commerce, more even than Twitter or Facebook, transportation permeates our daily existence. In ways both glaringly obvious and deeply hidden, thousands, even millions of miles are embedded in everything we do and touch—not just every trip we take, but every click we make, every purchase, every meal, every sip of water and drop of gasoline. We are the door-to-door nation.

The capacity to transport a supercomputer, a desperately needed medicine, or a tube of toothpaste from a factory in Shanghai to a store in Southern California or New Jersey or Duluth—and to do so 20 billion times a day reliably, affordably, quickly, and trackably—may well be humanity’s most towering achievement.

Every time you visit the Web site for UPS or Amazon or Apple and instantly learn where in the world your product or package can be found and when it will thump on your doorstep, you have achieved something that all but the still-living generations of humanity would have declared impossible or demonic.

Costco French Roast consists of a blend of beans from South America, Africa, and Asia, each component shipped by container vessel up to 11,000 miles in 132-pound loosely woven sacks of raw, green coffee beans, some across the Pacific Ocean to ports up and down the West Coast, the rest via the Panama Canal, perhaps the Suez Canal, then on to one of several East Coast ports. The complexities are so great on this routing—based on ship space, season, and the vagaries of rates and departures—that it’s difficult to trace bulk products more precisely than this. The raw beans then travel by freight train or truck (2,226 miles for the Port of Los Angeles portion) to one of the world’s largest blending and roasting plants, located at 3000 Espresso Way in York, Pennsylvania, one of six such plants in the Starbucks empire and the one identified by the company as principally serving Costco. After roasting, blending, and testing to make sure every batch smells and tastes exactly the same no matter how many times a customer buys Costco French Roast, the beans are sealed in plastic and foil composite bags with their own coast-to-coast mileage footprint. Then the packages are stacked on wooden pallets (sourced from all over the nation) and shipped another 2,773 miles back across the country to the Costco depot in Tracy, California, from which my coffee was trucked to my local Costco store. By the time I got those beans, they had traveled more than 30,000 miles from field to exporter to port to factory to distribution center to store to my house—more than enough to circumnavigate the globe.

But that’s not where the coffee mileage stops. There are the components of my German-built, globally sourced coffeemaker, which collectively traveled another 15,700 miles to reach my kitchen. My little bean grinder had a similar triptych. The drinking water I use to brew my coffee comes to my home from a blend of three sources: from groundwater pumped in from local wells about 50 miles distant; via the 242-mile Colorado River Aqueduct; and through the 444-mile California State Water Project, which moves water south from Northern California, forces it 2,000 feet straight up and over the Tehachapi Mountains, then down into Southern California. The fuel and energy required for this third leg exceeds the electricity demand of the entire city of Las Vegas and all its glittering casinos. The electricity that powers my coffee machine runs through a grid festooned with millions of transformers and capacitors, most of which are now imported across 12,000 miles from China through the ports of Los Angeles and Long Beach, a complex that is a veritable city unto itself. The natural gas that fuels the power plants that provide most of the electricity to my coffeemaker is obtained from gas fields in Canada and Texas and sometimes farther through a 44,000-mile network of underground pipelines—North America’s hidden energy transport plumbing.

At this point the collective transportation footprint on my cup of coffee is hovering at 100,000 miles minimum. And that’s not counting the seemingly smallest segment of that journey, my 6.3-mile drive to Costco in my 2009 Toyota Scion xB, which has the most massive transportation footprint of anything I own—and not because I drive it very far. I chose to buy a used vehicle on the theory that a secondhand but fuel-efficient conventional car is greener and less wasteful overall than a newly made hybrid or electric (not to mention a whole lot cheaper), and because we needed something big enough to hold our three greyhounds (which it does, barely, with two humans on board, too). The Scion was built in Japan out of about thirty thousand globally sourced components from throughout Asia and Europe, with one U.S. manufacturer contributing: the tires are from Ohio-based Goodyear, which has factories in Asia as well as the U.S. The assembled car was shipped from Japan to the Port of Long Beach in California, then trucked to a dealership in Southern California (other cars arriving by ship move by train to more distant dealers). The cumulative travels of the raw materials and parts of my car totaled at least 500,000 miles before its first test drive. The gas in its tank is a petroleum cocktail that adds another 100,000 miles to the calculation, as the California fuel mix consists of crude oil from fourteen foreign countries and four states.5 Most of this oil arrives by tanker ships at West Coast ports, then moves thousands of miles around the state and country to tank farms, refineries, fuel depots, and distribution centers via pipelines, railroads, canals, and semitrucks before finally appearing at my neighborhood gas station. Thousands of man-hours and billions of dollars in technology and infrastructure—along with the efforts of countless unsung heroes who pack, lift, load, drive, and track it all—combined to bring that cup of coffee to my lips (and my wife’s nightstand; I’m the morning person in our household). That cup of coffee is a modern miracle, magical and mundane at the same time, though we hardly if ever notice the immense door-to-door machine ticking away, making it happen with product after product, millions of them, each requiring the same level of effort and movement, day after day.

Our true daily commutes, beginning first thing in the morning with the travels of my cup of coffee—and followed by my socks and orange juice and dog food and dish soap—are more on the order of 3 million miles.

We live like no other civilization in history, embedding ever greater amounts of miles within our goods and lives as a means of making everyday products and services seemingly more efficient and affordable. In the past, distance meant the opposite: added cost, added risk, added uncertainty. It’s as if we are defying gravity.

The logistics involved in just one day of global goods movement dwarfs the Normandy invasion and the Apollo moon missions combined. The grand ballet in which we move ourselves and our stuff from door to door is equivalent to building the Great Pyramid, the Hoover Dam, and the Empire State Building all in a day. Every day. It is almost a misnomer to call this a transportation “system.” Moving door to door requires a complex system built of many systems, separate and co-dependent, yet in competition with one another for resources and customers—an orchestra of sometimes harmonizing, sometimes clashing wheels, rails, roads, wings, pipelines, and sea lanes.

We are the proud owners of roads we can no longer afford to maintain, saddling the country with an impossible $3.6 trillion backlog in repairs and improvements to aging roads and bridges—a deficit that grows every year,

How can a country that deploys insanely capable robot rovers to Mars and puts unerring GPS chips in our pockets leave us with two-ton rolling metal boxes to transport one person to work each day—boxes that kill ninety-seven of us every day and injure another eight every minute? Cars are the American family’s largest expense after dwellings, our least efficient use of energy, the number one cause of death for Americans under thirty-nine, and our least productive investment by far. The typical car sits idle twenty-two hours a day, for which privilege Americans, on average, pay $1,049 a month in fuel, ownership, and operating expenses.

These two faces of transit are often viewed and treated as two separate, even competing worlds—the frequently frustrating, in-your-face reality of how we move ourselves, and the largely hidden world of goods movement with its gated marine terminals, secure distribution centers, and mile-long trains with unfamiliar foreign names on the container cars: Maersk and COSCO and YTL. The same Los Angeles–area communities that embraced a billion-dollar bill to add a lane to Interstate 405 have successfully fought off for fifty years the completion of another north-south freeway that would connect the port to inland California with its vast web of warehouses, distribution centers, and shipping terminals. Residents oppose the building of the last five miles of this freeway, Interstate 710, because it is seen as benefiting freight, not people, as if the local Walmart stocked itself. The stream of big rigs flowing from the port instead have to take roundabout and inefficient routes on other freeways, wasting fuel and time—and adding to commuter traffic jams as well, where drivers curse the ponderous big trucks they have inflicted on themselves.

The hidden side of our commute, the flow of goods, has become so huge that our ports, rails, and roads can no longer handle the load. They desperately need investments of public capital that the nation does not seem to have. Yet it’s an investment that must be made, as logistics—the transport of goods—is now a vital pillar of the U.S. economy. Goods movement now provides a greater source of job growth than making the stuff being shipped.

New manufacturing technologies—the science fiction turned fact that is 3-D printing—are pushing in the opposition direction. This “unicorn” technology gives businesses in Brooklyn, Boston, and Burbank the power to manufacture a fantastic range of products—from surgical implants to car parts to guns—and to do it cheaper than a Chinese factory can 12,000 miles away.

The movement of these components does not include the mining, processing, and shipping of the rare earth elements that are so vital to so much of our twenty-first-century technology, or the movement of the vast quantities of energy and water needed to obtain them.

In the end, the iPhone has a transportation footprint at least as great as a 240,000-mile trip to the moon, and most or all of the way back.

The real breakthrough that makes the iPhone possible—along with most of today’s consumer goods, right down to the cheapest pair of boxers in your drawer or the salt-and-pepper shakers (and their contents) on your table—is a breakthrough of transportation.

The fleets of giant container ships that burn fuel not by the gallon but by the ton pose a growing environmental threat, with cargo vessels contributing about 3 percent of global carbon emissions now and on track to generate up to 14 percent of worldwide greenhouse gases by 2050. 15

But beyond their smokestacks, the mega-ships that now dominate cargo movement are threatening the transportation system itself, overloading ports and the networks of rail, road, and trucking that connect them to the rest of the world. The U.S. is running out of capacity at these choke points, with neither the money nor the will to increase it.

The rise of online shopping is exacerbating the goods-movement overload, because shipping one product at a time to homes requires many more trips than delivering the same amount of goods en masse to stores. In yet another door-to-door paradox, the phenomenon of next-day and same-day delivery, while personally efficient and seductively convenient for consumers, is grossly inefficient for the transportation system at large.

And yet the impact of embedding ever larger amounts of transportation in products is often minimized in public discussion, even by businesses that have embraced the business case for sustainability. Certainly they are concerned about fuel efficiency in distribution and shipping—that’s just good business—but the transportation footprint of a manufactured product is often a secondary concern at best. That’s because the most common analysis of a consumer product’s life-cycle—an estimate of its greenhouse gas footprint, which is a proxy for its energy costs—will usually find that the distribution of a product is a much smaller factor than its production. In its public disclosures on the footprint of its products, Apple states that transport accounts for only 4 percent of my iPhone 6 Plus’s lifetime greenhouse gas emissions. Production of the device, meanwhile, accounts for 81 percent of its carbon footprint—twenty times the transportation footprint. Even my use of the phone—mostly by recharging it—overshadows shipping in Apple’s life-cycle reckoning, producing 14 percent of its footprint.16 For a glass of milk, shipping produces only 3 percent of the footprint. For a bottle of California wine, it’s about 13 percent.18 Transportation accounts for only 1 percent of the carbon footprint of a jacket from eco-conscious Patagonia, Inc., even though it’s made of fabric from China and sewn in Vietnam. Production of its petroleum-based synthetic polyester is said to be the main culprit, accounting for 71 percent of the garment’s carbon emissions.

These product-by-product analyses are accurate but often incomplete—and in the end, they can distort the reality of the gargantuan impact of the door-to-door system as a whole. Viewed as a sector, the transportation of people and product is second only to generating electricity in terms of energy use and greenhouse-gas emissions (consuming 26 percent of the country’s total energy and fuel supplies,20 while creating 31 percent of total greenhouse gases).21 Transportation has a larger energy and carbon footprint than all the other economic sectors: residential, commercial, and agricultural, as well as the industrial/product manufacturing sector that figures so prominently in those life-cycle analyses.

Transportation leads all sectors in one unfortunate metric: when it comes to wasting energy, the movement from door to door tops every other human endeavor, squandering 79 percent of the energy and fuel it consumes. Finding ways to reduce that waste presents one of the great economic and environmental opportunities of the age.

Wondering if this problem is about the movement of people in cars rather than products on trucks and trains? The simple answer: it’s both. Proportionately, goods movement has the more intense carbon footprint in the transportation space, with transport by rail, truck, ship, and pipeline together generating about a third of the total transportation footprint. Freight trucks alone spew 22.8 percent of all transportation carbon emissions. Passenger cars account for 42.7 percent, while pickup trucks, vans, and SUVs contribute 17 percent. Given that there are fewer than 3 million big-rig freight-hauling trucks in America out of 265 million vehicles total,23 the fossil-fuel-powered movement of goods has a disproportionately immense carbon, energy, and environmental footprint. Miles matter.

other big recyclables—paper and plastic—degrade during the recycling process, or lose value, or end up costing more than new material, so market forces for repurposing these waste products are mixed at best. Recycled aluminum, however, is a different story: not only is it chemically and physically indistinguishable from the new stuff, but it is beyond cost competitive. Aluminum recycling uses 92 percent less energy than mining and refining aluminum from bauxite,6 and is often done near the end consumer rather than in far-off pit mines, lowering transportation costs and distance.

Much of the aluminum extracted from the earth since the 1880s is still in play, some of it recycled dozens or even hundreds of times.

Because of its light weight and the fact that it does not rust like iron and steel, aluminum is now being touted as the next big thing for reinventing ground transportation. Aluminum is so light (atom by atom it weighs less than many gases) that swapping it with steel in cars and trucks could cut the average vehicle’s weight in half, with corresponding decreases in fuel consumption and carbon emissions.

But it takes nearly twelve years on average for passenger vehicles to enter the big recycling bin known as the scrapyard (and two or three times that for planes, trains, and cargo ships), with about 11.5 million vehicles scrapped annually in the U.S. Therein lies one of the great contradictions in the aluminum story and McKnight’s sweet-spot pitch. Demand for aluminum in the transportation space has exploded—the record 504 million pounds of the metal delivered to automakers in 2014 is projected to rise to 2.68 billion pounds by 201810—but recycling alone cannot yield the required supplies quickly enough. So ever more primary aluminum has to be mined and refined to meet the demand for more efficient cars. This is how aluminum can be at once green and dirty, both a shining example of the “cradle-to-cradle” reuse economy and a coal-soaked, industrial-age relic of primitive extraction, spewing waste and toxins in its wake.

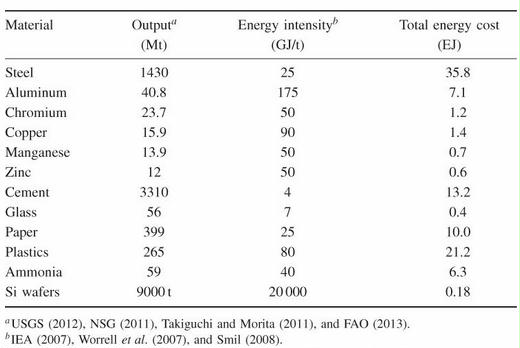
In 2014, worldwide production of primary aluminum topped 53 million metric tons. Smelting that metal required nearly 690.170 gigawatts of electricity16—more than twice the power consumption of America’s largest and most power-hungry state, California. Aluminum smelting uses more electricity than almost any other industrial process; engineers joke that the metal ought to be defined as “congealed electricity.” Alcoa has located most of its smelting operations near sources of hydropower to lower the cost and environmental impact, but globally—particularly in China, with more than half the world’s production—more aluminum is made with dirty coal-powered electricity than anything else. Domestic aluminum smelting in the U.S. alone consumes 5 percent of the electricity generated nationwide.

What this means is that aluminum’s weight advantage over iron comes at a price: iron can be produced from iron oxide in a simple, relatively compact blast furnace; the complex Hall-Héroult process requires literally acres of electrolysis cells and city-scale power plants to produce equivalent amounts of aluminum. The bottom line: a car part made from steel costs 37 percent less than the same part made of aluminum,17 although a life-cycle analysis by the Oak Ridge National Laboratory found that the overall energy and carbon footprint of a mostly aluminum car is less than a standard steel vehicle because of lower operating and fuel costs.18 The calculation changes radically in aluminum’s favor when recycled metal is used.

Because of California’s robust container deposit law, we receive a dime refund for every can we turn in, one reason why the state is the national recycling leader. Only ten states impose container deposits on beverages, however, and this explains why, nationwide, America’s recycling rate compares unfavorably with Europe’s and Japan’s. It’s also why, despite the value of scrap aluminum, 43 percent of aluminum cans used by consumers still end up thrown away instead of recycled.

As a consequence, the only way can makers can achieve the 70 percent recycled content in U.S. soda cans is by importing old cans from elsewhere in the world, mostly Europe. And so the metal in my can of lime seltzer—and every other canned beverage in America—is far better traveled than most of the consumers who buy it, as the industry is forced to outsource the metal from old cans from around the globe to satisfy our thirst. The cost of hauling scrap aluminum cans around the planet might knock some of the shine off the industry’s green credentials, but it still pencils out: even old cans transported from abroad are cheaper and have a lower energy and carbon footprint than pulling that same metal out of the mines.

Instead of questioning the very nature of the can—or the ship or the car or any other staple of the door-to-door world that has become part of daily American culture—the focus is almost always on refining the magic. Make cargo ships twice as big in the space of ten years so they can carry even more stuff door to door—but give no thought to the impact on roads, traffic, and infrastructure when all this extra cargo slams into land. Or make cars lighter with aluminum so they burn less gas and emit less carbon. But don’t question the transportation fundamentals these lighter cars will perpetuate—a country where 57 percent of households own two or more cars,23 all of them spending an average of twenty-two hours a day parked and disused.

Jay Isais is nodding and smiling as the readout comes within a percentage point of the target. He is an unabashed coffee nerd who also happens to run sourcing and manufacturing for the biggest coffee house chain in the U.S. not named Starbucks. He’s the Coffee Bean & Tea Leaf’s senior director of coffee, roasting, and manufacturing—or, in lay terms, the company coffee guy. He literally lives, breathes, and slurps coffee for a living: the company has nearly a thousand stores in thirty countries, and every one of the 8 million pounds a year the company buys is personally chosen by Isais.

What most consumers don’t realize, Isais says, is that when they buy coffee in a big can at the supermarket, it’s already stale before the first cup is brewed—even before the can is opened with its impressive hiss of a vacuum seal released. This is simple chemistry at work: along with its delicious aromas, coffee gives off copious amounts of carbon dioxide for a day or two after leaving the roaster. Stick the java right in a can, and that can will begin to bulge or even rupture from the pent-up gas pressure. Wait until the outgassing slows before sealing the can, and the problem goes away—but so does freshness. This had been the problem with American coffee since early in the twentieth century, when mass production and canning techniques were first applied to what had previously been a commodity sold fresh or even raw to the public.

Before the mass production techniques Henry Ford brought to the automobile were applied to coffee, the product was most often sold in its raw green bean state in the U.S.—the beans having been cleansed of the fruit skin, pulp, and an inner husk called the parchment, but not roasted. Coffee can stay good for up to a year in this state if kept dry and indoors. Consumers would take it home, roast it in a pan or oven, and grind it with a hand-cranked coffee grinder. The drink became somewhat popular in America during the American Revolution. Patriots wanted to supplant their previous favorite, tea, after the Boston Tea Party. Serving coffee represented a statement against British custom and rule. But coffee really took off as an American staple nearly a century later, during the Civil War. It was one of the few luxuries—as well as a welcome stimulant—offered troops on both sides, although only the Union Army had reliable supplies after the first year at war. Hundreds of thousands of men came home from the war hooked on java. Green coffee beans were part of the daily rations given to Union soldiers, who had little roasting kits in their packs or just used cast-iron skillets on the campfires. Some of the government-issue carbines had little grinders cleverly built into the rifle butts, but others just used their regular, solid rifle butts to hammer the beans until they broke up enough to brew.

Before each bag is sealed, oxygen is flushed out with pure nitrogen so the coffee cannot oxidize and spoil inside the bag. In this way, roasted coffee can be kept and retain most of its flavor for months. This is a compromise, as coffee is at its flavorful best twenty-four hours after roasting, Isais says. And yes, he admits, he can tell the difference. But it’s still a vast improvement over the old industrial canning process. The logistics for the Coffee Bean & Tea Leaf are complex: shipments take six to eight weeks to arrive via container from Africa, Indonesia, Central and South America, and Mexico. Two-thirds of the coffee shipments enter the country through the Port of Oakland, which has a preferred rate for certain commodities, coffee among them, and one-third arrives through the Port of Los Angeles.

Cars—all 1.2 billion of them worldwide—may not be the most vital component of our sprawling transportation landscape, or the most economically potent; the goods movement fleets and flotillas hold those crowns.

The price for this convenience is acceptance of vehicles that are nothing less than rolling disasters in terms of economics, environment, energy, efficiency, climate, health, and safety. Our failure to acknowledge the social and real-dollar costs of these automotive shortcomings amounts to a massive hidden subsidy. The modern car could not dominate, or exist at all, without this shadow funding. So what are the failings of our cars? First and foremost, they are profligate wasters of money and fuel: more than 80 cents of every dollar spent on gasoline is squandered by the inherent inefficiencies of the modern internal combustion engine. No part of our infrastructure and daily lives wastes more energy and, by extension, more money than the modern automobile.

There are also the indirect environmental, health, and economic costs of extracting, transporting, and refining oil for vehicle fuels, and the immense national security costs and risks of being dependent on foreign-oil imports for significant amounts of that fuel.

One out of every 112 Americans is likely to die in a traffic crash. Just under 1 percent of us.

The videos are horrifying, one crash after another in which death or major injury was avoided by luck rather than skill

PIZZA

The journey of my son’s pizza starts at 4:00 a.m. in Ontario when the first of fourteen big rigs arrives with the day’s supplies, starting with two truckloads of mozzarella. That’s 2,736 fifteen-pound bags from cheese giant Leprino Foods’ branch in Lemoore, California, 233 miles north and made from milk sourced from California dairies. Another truck arrives with 936 cases of sauce from TomaTek in Firebaugh, California, in the heart of tomato-growing country 278 miles north of Ontario. The Tyson Foods delivery brings pepperoni, sausage, ham, and salami in from the Dallas area, 1,400 miles, and chicken toppings out of Arkansas, 1,600 miles. Presliced onions and bell peppers come in from Boskovich Farms, just 100 miles away in Oxnard, California, while one of the top five toppings, mushrooms, arrives from Monterey Mushrooms in Watsonville, California, 361 miles distant. Flour originates in the wheat belt 1,500 miles away, but the mill that delivers it by tank trunk daily, Ardent Mills, a joint venture of food giants Cargill and ConAgra, is just twenty miles away in Colton. Salt is shipped in from Cargill in Wayzata, Minnesota, 1,900 miles distant, while sugar arrives from Cargill’s Brawley, California, plant, just 163 miles away.

Assorted deliveries of less frequently used toppings—garlic, anchovies, banana peppers, beef strips, and jalapeños—round out the offerings,

Multiple deliveries of empty pizza boxes arrive throughout the day from Santa Fe Springs, 33 miles away, although they’re made by a Georgia company 2,200 miles away, making them the most distant piece of the pizza puzzle other than pineapple. The various ingredients are parceled out to sections of the warehouse that are refrigerated, frozen, or kept at room temperature, where they await loading on outgoing trucks later that day.

The only freshly prepared pizza component is the dough. Everything in the Domino’s supply chain center revolves around the dough-making operation cycle, which begins when the ovens start preheating at 5:00 a.m. Domino’s pizza dough has six primary ingredients that go into one of three giant mixing bowls at the plant. Each mixing bowl holds more than six hundred pounds of dough, consisting of flour, yeast, salt, sugar, water, and oil. A secret “goody bag” with a small quantity of Domino’s proprietary flavors and dough conditioners is dumped in the mix, too, and giant stainless steel beaters go to work kneading the mixture

When the mixing is done, the giant bowl is loaded on a clanking stainless steel lift that raises the dough about eight feet in the air and then overturns it into a cutting machine that extrudes dough cylinders like Play-Doh, dumping them on a conveyor belt. The belt whisks the pasty-looking cylinders to a rolling machine that turns them into balls of dough ranging from baseball to softball size, depending on whether they are for small, medium, large, or extra-large pizzas. The dough balls shoot through a metal detector to make sure no twist-ties or bits of machinery contaminated the dough, then three line workers inspect, flatten, and pack the dough balls into one of the thousands of blue plastic trays that fill the facility in tall stacks.

By 1:30 p.m., the production phase of the day ends with the last dough run, whole wheat pizza dough for school lunches. The daily output: enough dough for 100,000 pizzas. At 2:00 p.m. the loading of the outgoing trucks begins. These are Domino-branded refrigerated big-rig trucks owned and maintained by Ryder and made by Volvo,

The trucks have been plugged in to the supply center’s electrical system and cooling down to 36 degrees all day. Even the loading dock is refrigerated to protect the raw dough. The bulk of each trailer’s interior space is taken up by the towers of stacked blue trays with their 100,000 dough balls, layered and mapped into sections based on the size of the pizza (medium and large are by far the most popular). The other ingredients—cheese, sauce, toppings, golden cornmeal to dust the pizza pans, napkins, and red peppers, in addition to cardboard pizza boxes—have to be crammed in around the all-important dough trays.

At 8:00 p.m., the first of the trucks departs for deliveries to the franchises, continuing in waves through midnight. Each truck has its own geographic area that might have twelve to fifteen stops, ranging from close-in deliveries in the LA metropolitan area, to franchises as far as the Arizona border, the Mexican border, and the ski resort at Mammoth Mountain, the most distant stop at three hundred miles and the only overnight run. The goal is to deliver the goods while the pizzerias are closed. The drivers have keys and put everything away, so the store is stocked and ready to start cooking the moment it opens for business.

We couldn’t be more contradictory about this: More than nine out of ten American voters believe it’s important to improve the country’s transportation infrastructure, and eight out of ten say it’s vital in order for America to stay competitive with other nations. Yet seven out of ten voters adamantly oppose raising the federal gas tax from its 1993 levels.11 Which is why Congress is basically cooking the books with accounting gimmicks to keep the system afloat year to year, deferring critical repairs and modernization projects year after year.

the Empire State Building weighs 365,000 tons. America moves goods equivalent to 46,575 Empire State Buildings door to door every year. If all that was loaded on just standard 53-foot semitrailers, it would require 425 million big rigs to move it, with every truck filled to the legal 80,000-pound limit. That would take about eighty times more trucks than the entire U.S. fleet of registered semitrailers.

Who rules the seas?

Cargo ships. Their purpose is not intimidating enemy targets but actually stocking Target stores, along with every other retailer, business, and home in America. Along with all their thousands of other customers, those cargo ships just happen to deliver 80 percent of the components the U.S. Navy and the rest of the American military relies upon. The Pentagon outsources as much as everyone else. When it comes to the superpowers of global shipping, the U.S. barely ranks as a bit player. In a concentration of power unlike any other sector of the transportation system, six steamship companies, none of them American, control more than half the goods in the world.2 Twenty global companies—most of which have joined forces in four immense ship-sharing alliances—control almost every product traded on earth. This has been the quietest conquest and surrender in world history, one in which the entire United States happily and somewhat obliviously participated because consumers love above all else low prices at the cash register, and there is no question that globalization has delivered that part brilliantly. The miracle of modern logistics and ultra-efficient global transportation technology has made achieving those low prices possible, although beneath the gleaming tech lies the crudest of foundations. All it took was two things: divesting America of its once-mighty cargo fleets and shipyards; and outsourcing a major chunk of consumer goods manufacturing to countries with pay, benefits, environmental practices, standards of living, and working conditions that would never in a million years be tolerated on American soil. The thrill of the checkout-line bargain masks the reality that Americans pay elsewhere for those low prices in the form of shuttered U.S. factories, lower wages, a shrinking middle class, a growing inability to pay for roads and bridges, massive public subsidies of the health and environmental costs of transportation pollution, and a nation—including its armed forces—that can no longer function without massive amounts of Chinese imports shipped aboard Korean-built vessels owned and operated by foreign conglomerates.

Of the six cargo powers that control a majority of global goods movement, Denmark-based Maersk Lines is the leader, at the top in numbers of ships, in cargo capacity, in revenues, in profits, and in constructing the biggest and most advanced cargo ships in the world. Maersk (with subsidiaries in oil platforms, oil drilling, trucking, and port terminal operations) handles nearly 16 percent of the world’s cargo all on its own.  Maersk has partnered in a mega ship-sharing alliance with the Geneva-based Mediterranean Shipping Company—the world’s second biggest container ship line. Together the two companies’ “2M Alliance” control a combined fleet of 1,119 vessels capable of hauling 29 percent of the world’s goods.3 Not a single missile, cannon, or gun bristles from this container ship fleet.

Bunker fuel, it’s called: the cheapest, dirtiest form in common use is up to 1,800 times more polluting than the diesel fuel used in buses and big rigs,15 and little more than a waste product left over after everything else useful is extracted from crude oil. It has the consistency of asphalt; a person can walk on it when it’s cool. The big cargo ships burn so much bunker fuel that they don’t measure consumption in gallons but in metric tons per hour, with the really big ships consuming two hundred to four hundred tons a day. One large container ship burning this type of fuel spews out more sulfur and nitrogen oxides—the precursors of smog and particulate pollution, as well as a major contributor to the ocean acidification that threatens fisheries and coral reefs—than 500,000 big-rig trucks or roughly 7.5 million passenger cars.16 That means just 160 of the 6,000 such mega-ships in service today pump out the same amount of these pollutants as all the cars in the world.

The cargo fleet is also a prodigious source of carbon emissions—about 2 to 3 percent of the global total.17 Although that’s only between a third and a fifth of the global-warming gases emitted by the world’s cars,18 it’s still a big greenhouse gas footprint for such a relatively small number of vessels. If the shipping industry were a country, it would be in the top ten drivers of climate change, and its billion tons of carbon dioxide and equivalents put it ahead of Germany, the world’s fourth largest economy. At current rates of growth, the shipping industry that hauls 90 percent of the world’s goods will be two and a half times its current size by 2050; absent a serious effort to become more energy efficient, it could be generating a staggering 18 percent of global greenhouse gases by then.

Through a very deceptive accounting loophole, none of these big ship emissions “belong” to any one country. They happen in international waters for the most part, and so for the purpose of calculating the greenhouse gas emissions of nations, they simply don’t exist—on paper.  They very much exist in terms of their impact on climate, oceans, and health.

Port of LAX

Each day in predawn darkness, Chavez and her crew of marine information specialists arrive at Angels Gate to chart the approaching parade of cargo vessels, gathering cryptic information received via phone, e-mail, and old-school fax from the world’s far-flung maritime shipping lines. The product of these labors is a master daily schedule for a hundred or more impending ship departures, arrivals, crossings of the two-hundred-mile international limit, and shifts to the marine terminal docks from remote harbor anchoring spots (the waterfront equivalent of the doctor’s waiting room). Once dockside, the mammoth ships need two to five days to unload and reload before leaving for their next port of call and making room for the next vessel, which means every berth has a waiting line behind it.

First, Debbie Chavez sends out the list to inform the work of the traffic controllers and Coast Guard officers at the Marine Exchange “Watch” peering at their radar and computer displays. They direct and police the approaching vessels. Then the Master Queuing List is used to schedule the port pilots who race out to meet the ships and guide the laden behemoths in and out of their berths. The list is next used to staff the day shift with the right number of crane operators, those princes of the docks who lift twenty-ton containers from impossibly tight quarters with the finesse (and pay scale) of brain surgeons. Then comes the assembly of longshore gangs to unload the goods, and the stevedores in the marine terminals who move and prepare the cargo for shipment out of the port. Finally, the Master Queuing List is used to dispatch the 40,000 or more big-rig truck trips that swarm into, out of, and around the twin ports every twenty-four hours, carrying the cargo out into the concentric circles of warehouse distribution centers, freight depots, and rail yards that make up America’s goods-movement ecology.

A third of U.S.-bound consumer goods, and far higher percentages of some, pass by the Marine Exchange. That makes Angels Gate and Debbie Chavez the one essential stop for everyone’s commute—long before you even leave the house.

The complex ballet required to move a product, any product, from door to door—and the overload that affects and infects that dance—begins most often at a port.

Once a container ship makes it out of the waiting room anchorages and reaches a container terminal, the unloading becomes another exercise in multi-ton surgery. Mammoth cranes capable of spanning the 170-foot-wide ships are positioned up and down the length of a vessel to begin the extraction of the containers. There are 140 electrically powered ship-to-shore cranes at the twin ports, a distinctive sight on the skyline, particularly when they’re idle and the boom arms are pointed skyward, like soldiers firing a twenty-one-gun salute. The bright red and blue crane towers run three hundred feet high and will soon be taller. The ports are painstakingly raising them sixty feet by giving them longer legs to accommodate larger, taller container ships, at a cost of a million dollars apiece (versus $10 million for each new crane). Almost all are imported from China; America makes neither the ships nor the equipment for unloading them, and they have to be transported already assembled on specialized cargo ships.

Crane operators at the California ports can average between twenty-five and twenty-eight containers an hour—just over two a minute. The highest paid and most sought-after operators routinely handle more than thirty cans an hour and can earn $250,000 a year with a thirty-hour workweek. They move more cargo in two minutes than the old bulk cargo stevedores could unload in an hour. And yet, even with four cranes working the bigger ships at once, and all operating at peak speeds, a 6,000-container delivery takes 54 hours to unload entirely, not counting time to reload (even when many of the outgoing containers from American ports tend to be empties).

When the crane operator’s work is done, the terminal gangs of longshoremen take over, moving the cans into temporary holding areas, where towers and pyramids of the different-colored containers amass until the proper truck or train is ready to be loaded. Marine clerks sort through the mazes of containers, some of which are difficult to find because of malfunctioning RFID devices or containers placed or logged incorrectly. The containers are moved in and out of the mountainous stacks by rubber-tired gantry cranes—smaller versions of the ship-to-shore cranes—which are mounted on inverted U-shaped frames riding on giant tractor tires instead of towers.

The terminals, many of which are subsidiaries of the shipping lines, are charged with moving those containers out of the ports as quickly as possible, but once again overload has complicated the job. Just under a third of the containers depart via dockside rail (or near dockside, after a short truck ride). The Alameda Corridor could handle twice the number of containers currently moving through it, but lack of rail capacity inside the ports represents a bottleneck limiting the number of trains moving cargo through the corridor. Plans to expand the capacity with construction of a new rail yard near the port have been stymied for years. This project, dubbed the Southern California International Gateway, faces neighborhood opposition, environmental complaints, and a lawsuit filed by the City of Long Beach against the City of Los Angeles,

Given the limits on rail movement from the twin ports, the next stage in moving our stuff door to door is all about trucks. About 70 percent of the cargo moves out via drayage trucks, the short-haul semitrailers that jam the ports and surrounding roads, each one carrying a single container. These trucks are a major source of air pollution and traffic congestion in the region. There are about 10,000 full-time and 4,000 part-time drayage drivers working out of the Long Beach and Los Angeles ports, and each day they swarm the marine terminals. It’s difficult and not always rewarding work, as picking up containers at the ports is a daily exercise in patience and dockside traffic jams even on the best of days. Drayage drivers for the most part are paid by the load, not by the hour, so idle time is a loss for them. The drayage truckers are an important link in the national goods movement system, never straying far but performing the essential service of bringing the still-containerized goods to nearby rail yards and transmodal train terminals,1 product distribution centers, warehouses, and long-haul trucking operations. Except for a few large companies with their own trucking fleets—Walmart, the big food and beverage companies—the next move after drayage for most of the goods that come to America through ports—and from American manufacturers as well—is handled by for-hire trucking fleets and logistics companies.

The next stop for most goods out of the Southern California ports are close-in distribution facilities.

In years past, businesses would make their own arrangements, hire truckers, or haggle with railroads. Some still do. But the trend now is to farm that work out. Companies such as Frontline Freight in the nearby City of Industry work for Watson’s tenants and other businesses across the nation; they are one of a new and growing breed of truckless, trackless transportation companies known as third-party logistics providers or freight forwarders.

What Frontline does—like hundreds of other companies in this growing “3PL” line of business—is arrange to receive the goods for an importer or other freight recipient (the goods can be domestic or imported, anything from anywhere is fine) and arrange to have the freight shipped to its final destination. That could be across town, the state, the country, or the world.

Next it’s on to more distant destinations in the California desert, where hundreds of square miles have been transformed into a landscape of sprawling distribution centers (think everything from Amazon to Zappos and every company in between). Next rail, air, and long-haul truckers move the goods to the rest of the nation—on to our stores, our businesses, our hospitals and schools, and through the last mile to us. To our doors.

UNITED PARCEL SERVICE

2,000 similar United Parcel Service delivery hubs around the country and the world. In the next eight hours this cycle will land 15.3 million packages on America’s doorsteps

“I am in the business of minutes,” Massie says. “It’s all about the minutes. If the plane leaves at seven, you either get there or somebody doesn’t get what they need in time.

Before packages, before sorting and bagging and loading, before driving and delivering, there is the clock,

On an average day, Massie’s Southern California employees will make 1.2 to 1.3 million deliveries in Southern California, more than 8 percent of the UPS worldwide total,

He does this with about 5 percent of the UPS workforce (which is 435,000 worldwide, moving 6 percent of the nation’s GDP).

A secret weapon makes this feat possible: a staff of 150 industrial engineers. This is the title UPS gives to the men and women whose job is to design the optimum route and order of stops that will get delivery drivers where they need to be when they need to be there while using as few minutes and miles as possible.

With more than 10,000 drivers in Southern California averaging 120 stops a day, in the most traffic-ridden, constantly changing urban sprawl in the U.S., Massie’s troops face one of the toughest choreographing challenges in the door-to-door universe. The first tool in the UPS engineers’ arsenal is the built-in “telematics” data devices every truck and driver carries. This hardware relays each truck’s performance information in real time to the engineers, who compare it to previous days on the same routes. With this data they can identify streets, turns, and intersections that are causing delays because of shifting traffic patterns, detours, or construction—even small delays drivers may not notice. The data lets them build more efficient routes for the next day.

Then there is the company’s famous no-left-turn policy, put in place in 2004, when the engineers realized that drivers waiting to turn left with engines idling were burning significant amounts of minutes and fuel. By assigning routes that avoid lefts for 90 percent of a delivery van’s turns, the company found it shaved 98 million minutes a year of idling time from its routes, which not only sped deliveries but also saved the company about 1.3 million gallons of fuel a year. Avoiding the left is also a proven safety measure, as traffic data shows that left turns are involved in ten times as many crashes and three times as many pedestrian deaths as right turns.

The industrial engineers’ newest and most sophisticated tool is a computer program called ORION (a catchy acronym for a decidedly uncatchy 1,000 pages of computer algorithm known as On-Road Integrated Optimization and Navigation). No human can consider all the possible routes with brainpower alone—the variations for one truck with 120 stops in different locations with varying drop-off and pickup times yield a number too high to have a name (trillions just won’t cut it). Rounded off, it is best expressed in scientific notation: 6.7 x 10143; if you wrote this value down in normal notation, the number of possible routes would look like this: 6,689,502,913,449,135,000,000,000,000,000,000,000,000,000,000,000,000,000,000,000,000,000,000,000,000,000,000,000,000,000,000,000,000,000,000,000,000,000,000,000,000,000,000,000,000,000,000,000,000,000,000,000,000,000,000,000,000,000,000,000,000,000,000,000,000,000.3

ORION can crunch that big number down to a short list of optimal routes that saves both minutes and miles, mapping out turns and tweaks that are too numerous for any human driver or engineer to compare unaided.

Humans take that list, modify the routes that are supremely efficient on paper but make no sense in the real world.

Shaving just one mile off every truck’s route can save the company $50 million in annual fuel costs; UPS expects up to $400 million in savings when ORION

The company may be delivering 18 million parcels a day, but only 2.7 million are overnight air shipments. This means that, at any one time, the company is juggling 100 million or so packages (more during holidays) while they are in transit. Routing all that requires a twenty-four-hour operation. In Massie’s district—as in any UPS district—the cycle begins around 1:00 a.m., when the fifty-three-foot big rigs—“feeder trucks,” in UPS-speak—move between cities and regions laden with ground shipments. Because UPS uses a hub and spokes system for both air and ground deliveries, few trucks haul parcels beyond a five-hundred-mile radius. A feeder truck bound for Salt Lake City from Los Angeles might stop at Las Vegas and meet a truck coming in from Utah. The two drivers will unhook and swap their trailers, then turn around and go home. Longer-distance shipments out of Southern California—about 80 percent of packages and documents—arrive and leave by rail, with the faster (and pricier) air shipments headed to the company’s regional air hub at Ontario, California, the unlikely desert location that UPS has made into one of the dozen busiest cargo airports in the country. The feeder trucks, trains, and planes meet up, crisscross the country, and bring the packages toward their destinations, ultimately landing at sorting centers and delivery facilities like Massie’s Olympic Building. They are, literally, feeding the beast.

At 4:00 a.m., the night loading of the delivery trucks begins, preparation for the final stage in the package shipping process. Parcels that arrived earlier by air or feeder truck or were picked up by the delivery vans themselves are sorted, scanned, and incorporated into ORION’s route-planning calculations, which are continually updated as new pickups arrive. While the sorted packages are being put on delivery trucks, the routes are finalized and downloaded into the drivers’ tablets (UPS had deployed this tech years before the iPad came along). Then the iconic brown box trucks depart to complete their deliveries—the endpoint the customer at the doorstep actually sees. Finally the same drivers complete their pickups—three quarters of a million package pickups in Massie’s Southern California district—and return to the network of operating centers, usually between 6:00 and 7:00 p.m. There, incoming packages are sorted by destination and shipping method and sent out by feeder truck, rail, and air to the proper UPS hub, and the process begins anew, sometimes with bare minutes to spare before a plane, train, or truck departure.

He ticks off the problems that keep him up at night: failing bridges, potholed streets, congested ports, endless traffic jams. Truckers on overnight hauls can’t even find safe parking half the time. As vital as trucks are to the economy and our way of life, Massie says, they are treated like interlopers on America’s roads. He’d like to see dedicated highway freight lanes—high-speed lanes just for trucks, isolated from passenger traffic—and greater public transportation investment to take cars off the road, making room for those freight lanes and more trucks.

 “It’s simple, really. Trucks are like the bloodstream in the human body. They carry all the nutrients a body needs in order to be healthy. If your blood stops flowing, you would die. If trucks stop moving, the economy would die. That’s not hyperbole. That’s not embellishment. That’s just math. And yet—and this is what really gets me—the general public hates trucks. People have become truck haters. They want them off the road. They oppose improvements that would keep the economy moving and growing. It’s already hurting our business. People don’t know what they’re asking for. They would paralyze America if they had their way.

“I don’t know if it’s a cultural thing in America that people feel entitled to the cement and the roads without having to pay for them, without having to understand how the system works, or that our economy depends on it continuing to work,” says Noel Massie.

One additional proposal put forward by the ports and local groups tired of choking on pollution would add electric power lines overhead so that zero-emission electric trucks could traverse the 710 corridor, then switch to battery power when leaving the freeway. And all of the plans will require much cleaner trucks than the current generation of diesel big rigs, as state and federal law demands sharp improvements in Southern California’s notoriously poor air quality.

Twenty-two companies are working together on one such promising superlight experimental big rig called the WAVE—for Walmart Advanced Vehicle Experience—that uses a hybrid system consisting of a powerful battery electric motor coupled with a micro-turbine engine that together can cut emissions and fuel use by up to 241 percent. But a commercially viable version of the WAVE (that is, one that’s cheap enough) may be a decade or more off, if it’s even achievable at all.

Absent such a paradigm-shifting technological advance actually hitting the road soon and in large numbers, community opposition to any proposal that would allow more trucks or increase the freeway’s footprint has already formed.

Monorails. Flying cars. Nuclear-powered cars. A helicopter in every garage. Subway bullet trains traversing the country. Moving sidewalks. Magnetic highways to guide vehicles so drivers can relax and play board games with the kids. Rocket planes that go suborbital to cover long distances quicker. We were supposed to have all these by now, or so the predictions of the future went a couple generations ago. Traffic was supposed to have been solved. Energy and pollution, too.

It’s tempting to judge those earlier decisions harshly, to condemn the shuttering of a valuable transportation asset and the refusal to build a new one when it would have been so much easier and less expensive to lay those tracks when the freeways first went in, rather than trying to shoehorn them into a built-out urban landscape today. But were those decisions wrong? Mass transit ridership was dying in the region even before World War II. And for all the money being spent on new light rail and trolley systems now, ridership is only a fraction of what it was a century ago. Cars won. And the decisions made to reject those multimodal freeways were rational at the time. People wanted cars. They didn’t want to see America from the train. They wanted to see the U.S.A. in their Chevrolets. They wanted to drive to work in air-conditioned comfort, not walk to the streetcar or train station, then wait around on crowded platforms. All the billions spent on mass rail transit in LA in recent years, the most ambitious build-out of multiple routes anywhere in the country, has not reduced car traffic jams as hoped. It helps somewhat, but the reductions make it hard to justify the expense. This mirrors the experience nationwide, even as about 25 percent of surface transportation spending goes to fund mass transit.

Mass transit use has picked up a bit in recent years but still is lower than it was a quarter century ago and far below its absolute peak in the 1920s, when it was the best and most desirable way to get around the nation’s cities and suburbs. Indeed, suburban development followed the extension of mass transit lines back then in the era of streetcar suburbs, because the trolleys were considered a prerequisite for suburban development. Most streetcar suburbs have been absorbed into cities proper since then, and suburban development after World War II eschewed following mass transit and instead relied on car accessibility. The new mass transit spending is not enticing waves of new riders to abandon their cars and ease road traffic. The convenience of the car parked in front of the house trumps the inconvenience of getting to a train or trolley or bus. In the 1920s, Americans were not deterred by this last-mile problem.

People walked to the stop—no big deal.

The replacement of truck, bus, and cab drivers with automation will be wrenching, particularly since taxis have become an entry point into the workforce for immigrants, and truck and bus driving have provided one of the few enduring and plentiful blue-collar jobs that still provide reliable paths to middle-class prosperity. The American Trucking Associations reports that there are about 3 million truck drivers working in the U.S.—it’s the single most common job in a majority of states—and about 1.7 million of that number are long-haul truckers, who would be most vulnerable to displacement by autonomous technology.

Rail, trucking, and ships dedicated to goods movement could start reducing their carbon footprint by transitioning from bunker and diesel fuel to natural gas, then electricity and carbon-neutral biofuels as those sources ramp up. These moves would be powered by a revamped grid dominated by renewable power sources that are already price competitive with fossil fuels. Embedding more miles and energy in our products can no longer be the winning strategy.

In the business world there would be big losers in this shift—the powerful fossil fuel industry. But there would be equally big winners in renewables, in producers of electric cars, autonomous vehicles, and electrical infrastructure. Tens of millions of jobs would be created to convert homes, ports, logistics centers, military bases, and factories to solar, wind, and bio-power with built-in energy storage for round-the-clock use and charging of our vehicles.


Posted in Energy Books, Transportation, Travel | Tagged , , | 3 Comments

Peter Turchin: violence and social unrest in the U.S. and Europe likely by 2020

Preface. Peter Turchin, an expert on the cycles of history and the rise and fall of civilizations, has used mathematical models of complex systems to predict political instability. Debora MacKenzie at NewScientist interviewed him about his upcoming book “Ultrasociety” in the October 12, 2013 article “Pattern behind the shutdown“, and I’ve also drawn on another  article “Calculated violence: Numbers that predict revolutions” by Bob Holmes in 2012. I’ve taken excerpts and paraphrased both of these below.  Turchin is a mathematical ecologist at the University of Connecticut in Storrs.

Alice Friedemann  www.energyskeptic.com  Author of Life After Fossil Fuels: A Reality Check on Alternative Energy; When Trucks Stop Running: Energy and the Future of Transportation”, Barriers to Making Algal Biofuels, & “Crunch! Whole Grain Artisan Chips and Crackers”.  Women in ecology  Podcasts: WGBH, Jore, Planet: Critical, Crazy Town, Collapse Chronicles, Derrick Jensen, Practical Prepping, Kunstler 253 &278, Peak Prosperity,  Index of best energyskeptic posts

***

Turchin didn’t find the Republican minority in the U.S. House refusing to approve the budget even though it could bring on a global financial crisis at all surprising. It was a predictable outcome.

Turchin has found what he believes to be historical cycles, two to three centuries long, of political instability and breakdown affecting states and empires from Rome to Russia. In a book he is finishing, he argues that similar cycles are evident in US history, and that they are playing out to this day. He admits that his theory, built on a model that combines social and economic data, must be tested against real events – but unlike most historical theories, it can be. Meanwhile, he says, it “predicts the long-term conditions that led to this shutdown”.

Turchin has several books out on the 200-300 year cycles of history to make predictions about future political changes. If he’s right, there will bey civil unrest and political violence by 2020 in the United States. Turchin replies to those who disagree that his predictions are testable within the near future, and that if he’s right, measures could be taken to prevent instability from happening.

“Turchin put his reputation on the line by predicting publicly that political instability in the US and western Europe will shoot up in the coming decade (Nature, vol 463, p 608). In his new paper he provides more evidence for an impending crisis in the US, where both cycles look to be approaching a peak in 2020. Allowing for some imprecision in his calculations, Turchin says that if we make it to 2030 without major turmoil he will conclude that his prediction – and hence the underlying theory – is wrong. He doesn’t think that will happen, though, and estimates that he has an 80% chance of being right. The scale of the potential unrest, although more uncertain, also concerns him. “It is easier to predict timing than the height of the peak. My feeling is that it’s going to be worse than we expect. Hopefully I’m wrong – I have to live through this.”

Prevention remedies include increasing tax rates on high earners, reducing the rates of immigration, and fewer people getting a university education, since this is what increases the number of the elite. He notes that collective violence in Europe in the early 17th century and in pre-revolutionary Russia was closely correlated with an oversupply of graduates.

Turchin has used a mathematical approach to understand how religions spread, why empires arise on steppes near farmland, and why civilizations collapse.  He says that the reason there are over 200 reasons historians give for the fall of the Roman empire is due to constant new ideas yet no culling of old hypotheses.

But Turchin looks beyond individuals and the details of a particular empire to the big picture view that applies to any nation: social cohesion, collective violence, riots and civil wars, population biology, and so on. His model shows that “in a prosperous culture, population growth or advancing technology eventually leads to an oversupply of labor. That is good news for an expanding upper class who can more easily exploit an increasingly desperate labor force. Eventually, though, the society becomes so top-heavy that even some members of the elite can no longer afford the good life. Factionalism sets in as the upper classes fight among themselves, social cohesion declines, and the state begins to lose control of its citizens. Then, and only then, does widespread violence break out. Anarchy reigns until enough people fall out of the elite classes, at which point growth and prosperity can return.”

This is a testable theory, in that it predicts violence and collapse don’t happen at the first signs of harder times when workers’ first become unhappy.  Rather, it comes a generation or two later due to the time it takes to accumulate excessive numbers of wealthy educated elites.

And it is how events did unfold the Roman Republic, medieval Europe and Tsarist Russia, when he compared the timing of collective violence with  wages, social inequality and population growth – a measure of labour supply. In addition, the dates of coins in hoards unearthed by archaeologists are “an excellent proxy for political unrest, since their owners must have buried them in fear during dangerous times and then experienced some misfortune that prevented them from digging them up later. Again, he found that civil war lagged behind economic hardship by a generation or two. Moreover, the same pattern holds true for the US over the past 200 years, he reports in the Journal of Peace Research, vol 4, p 577)”.

Workers or employees make up the bulk of any society, with a minority of employers constituting the top few per cent of earners. By mathematically modelling historical data, Turchin finds that as population grows, workers start to outnumber available jobs, driving down wages. The wealthy elite then end up with an even greater share of the economic pie, and inequality soars. This is borne out in the US, for example, where average wages have stagnated since the 1970s although gross domestic product has steadily climbed.

This process also creates new avenues – such as increased access to higher education – that allow a few workers to join the elite, swelling their ranks. Eventually this results in what Turchin calls “elite overproduction” – there being more people in the elite than there are top jobs. “Then competition starts to get ugly,” he says.

The richest continue to become richer: as in many complex systems, whether in nature or in society, existing advantage feeds back positively to create yet more. The rest of the elite fight it out, with rival patronage networks battling ever more fiercely. “There are always ideological differences, but elite overproduction explains why competition becomes so bitter, with no one willing to compromise,” Turchin says. This means the squabbling in Congress that precipitated the current shutdown is a symptom of societal forces at work, rather than the primary problem.

In Turchin’s theory, such political acrimony is paralleled by rising discontent among workers left with less and less, and increasing state bankruptcy as spending by the elite who control the government coffers spirals. Ultimately, the situation gets so bad that order cannot be maintained and the state collapses. A new cycle begins.

Reality backs his theory up. Over the last century, labor supply, public health indicators, income inequality, and the numbers and behavior of the elite rose and fell in sync and as predicted by the theory. And with each glut of workers and peak in inequality came a surge in political violence.

Turchin finds that a simple mathematical model, combining economic output per person, the balance of labor demand and supply, and changes in attitudes towards redistributing wealth – the minimum wage level is one proxy for this – generates a curve that exactly matches the change in real wages since 1930, including complex rises and falls since 1980. Such close agreement between model and reality is exceptional in social sciences, says Turchin, and shows that all three factors control the rise of inequality, as predicted.

A set of 1590 instances of political violence in the US reveals peaceful periods around 1820 and 1950, with instability rising in between. Social data reflecting labor supply, inequality and elite overproduction match that basic fluctuation. Turchin thinks these changes explain the American civil war in the 1860s. The statistics also show that we are now in another phase of rising instability that began in the 1970s, just when, as his theory predicts, labor supply started outstripping demand.

In Turchin’s theory, this phase in the cycle should also be marked by political polarization and rising government debt – both current crises in Washington. Real wages, the minimum wage, trade union suppression, the share of wealth owned by the richest one per cent, even filibusters and fights over judicial appointments – all have changed at the same time in ways reflecting reduced social consensus. Meanwhile, the elite class has grown sharply. Between the 1970s and 2010, college fees rose, yet the numbers of doctors and lawyers qualifying per head of population nearly trebled. Workers have steadily lost out. The “real shocker”, says Turchin, is that the average height of Americans peaked in 1975. It has actually declined in black women since then – a fact that could be down to falling nutrition standards linked to lower incomes. None of the trends shows any sign of reversing.

Yaneer Bar-Yam of the New England Complex Systems Institute in Cambridge, Massachusetts, agrees with Turchin’s finding of repeated cycles in history. However, he believes our current experience also reflects something new: technology has brought about the emergence of a complex, networked society, one that, he argues, existing democratic institutions are too simplistic to govern. “The fall of the Soviet Union wasn’t the end of the story,” says Bar-Yam. He says that the US government could also fall apart unless its citizens choose to adapt by evolving decentralized, networked institutions more suited to managing complexity.

Posted in Peter Turchin | Tagged , , , | Comments Off on Peter Turchin: violence and social unrest in the U.S. and Europe likely by 2020

Climate change impacts on transportation 2008 U.S. Senate hearing

Senate  110-1199. June 24, 2008. Climate change impacts on the transportation sector. U.S. Senate Hearing.

Excerpts from this 135 page document follow.

DANIEL K. INOUYE, U.S. SENATOR FROM HAWAII

The transportation sector is a major indicator of the overall economic health of our Nation. Given that fact, it is important to recognize that climate affects the design, construction, safety and operations, and maintenance of transportation infrastructure and systems. For example, as we will hear today, predicted increases in precipitation and frequency of storms will impact our transportation systems; recent flooding in the Midwest resulted in submerged highways and railroad bridges, and significant diversion of freight traffic. In addition, severe storms have caused major airport delays around the country. While there is a need for the transportation sector to adapt to the environmental changes brought on by global climate change, it is also widely recognized that the transportation sector has contributed to the causes of climate change. (1) Transportation sources account for approximately one-third of U.S. greenhouse gas emissions.

Dr Thomas C. Peterson, Climate Services Division, National Climatic Data Center, National Environmental Satellite, Data & Information Service, National Oceanic & Atmospheric Administration, U.S. Department of Commerce

I am an author of a National Research Council (NRC) commissioned paper released this past March on Climate Variability and Change with Implications for Transportation, along with other colleagues from NOAA and the Department of Energy’s Lawrence Berkeley National Laboratory. My testimony will draw from the NRC paper as well as from 3 other timely reports of which I am an author of the report on climate extremes: The Potential Impacts of Climate Change on U.S. Transportation by the NRC Transportation Research Board (TRB) which was released March 11, 2008. Impacts of Climate Variability and Change on Transportation Systems and Infrastructure—Gulf Coast Study, U.S. Climate Change Science Program (CCSP) Synthesis and Assessment Report 4.7, released March 12, 2008. Weather and Climate Extremes in a Changing Climate, U.S. Climate Change Science Program Synthesis and Assessment Report 3.3, released June 2008. Climate Change and Its Impacts on Transportation Operation and Infrastructure.

According to the NRC report, 5 aspects of climate change impact transportation operations and infrastructure: (1) increases in very hot days and heat waves, (2) increases in Arctic temperatures, (3) rising sea levels, (4) increases in intense precipitation events, and (5) increases in hurricane intensity.

Increases in Very Hot Days and Heat Waves

Impacts on infrastructure include rail-track deformities, thermal expansion on bridge joints and paved surfaces, and concerns regarding the integrity of pavement. Very hot days can have an impact on operations by limiting periods of outdoor railroad track maintenance activity due to health and safety concerns.

It is highly likely (greater than 90% probability of occurrence) that heat extremes and heat waves will continue to become more intense, last longer, and be more frequent in most regions during the twenty-first century. In 2007, the probability of having 5 summer days at or above 43.3 °C (110 °F) in Dallas was about 2%. In 25 years the models indicate that this probability increases to 5%; in 50 years, to 25%; and by 2099, to 90%.  High temperatures can have a big impact on aircraft by influencing the limits on payload and/or canceling flights. This is due to the fact that, because warmer air is thinner (less dense), for any given take-off speed the wings of airplanes create less lift when temperatures are high. This causes lower lift-off load limits at high-altitude or hot-weather airports with insufficient runway lengths.

Increases in Arctic TemperaturesImpacts on infrastructure include a short season for ice on roads and thawing of permafrost, which causes subsidence of roads, rail beds, bridge supports, pipelines, and runway foundations.    A longer ocean transport season and more ice-free ports in northern regions, as well as the possible availability of a northern sea route, or a northwest passage.

The Gulf Coast Study estimates that a relative sea level rise of 0.5 to 4 feet is quite possible for parts of the Gulf Coast within 50 years, due primarily to land subsidence. With an increase of 4 feet in relative sea level, as much as 2,400 miles of major Gulf Coast roadways could be permanently flooded without adaptation measures. Other impacts of sea level rise include more frequent interruptions in coastal and low-lying roadway travel and rail service due to storm surge. Sea level rise will cause storm water levels to be higher and flow further inland, exposing more infrastructure to destructive wave forces. Higher storm water levels will in turn require reassessment of evacuation routes, changes in infrastructure design, siting, and development patterns, and the potential for closure or restrictions at several of the top 50 airports, as well as key maritime ports that lie in coastal zones. With 50% of the population living in the coastal zone, these airports and ports provide service to the highest-density populations in the United States. Impacts on infrastructure include reduced clearance under bridges; erosion of road base and bridge supports; inundation of roads, rail lines, subways, and airport runways in coastal areas; more frequent or severe flooding of underground tunnels and low-lying infrastructure; and changes in harbor and port facilities to accommodate higher tides and storm surges.

Increases in Intense Precipitation Events.  It is very likely (greater than 90% probability of occurrence) that intense precipitation events will continue to become more frequent in widespread areas of the United States. Impacts include increased flooding of evacuation routes, increases in weather-related delays and traffic disruptions, and increases in airline delays due to convective weather. Impacts on infrastructure include increases in flooding of roadways, rail lines, subterranean tunnels, and runways; increases in scouring of pipeline roadbeds and damage to pipelines; and increases in road washout, damages to rail-bed support structures, and landslides and mudslides that damage roadways and tracks.

Increases in Hurricane Intensity.  It is likely (greater than 66% probability of occurrence) that tropical storm intensities, with larger peak wind speeds and more intense precipitation, will increase.  Impacts of increased storm intensity include more frequent and potentially more extensive emergency evacuations; and more debris on roads and rail lines, interrupting travel and shipping. Impacts on infrastructure include a greater probability of infrastructure failures, increased threat to stability of bridge decks, and harbor infrastructure damage due to waves and storm surges.

Transportation infrastructures have long lifetimes. For roadways it is typically 25 years, railroads 50 years, and bridges and underpasses 100 years.

There are methods of laying railroad track that raise the temperature at which it will buckle, some pavement options are more resistant to rutting during hot weather than others and larger culverts can be placed under railroads and highways to accommodate heavier precipitation.

Thomas J. Barrett, Vice Admiral, Deputy Secretary, Department of Transportation 

We have focused our approach on improving vehicle efficiency, increasing use of alternative fuels, reducing congestion, advancing the efficiency of the transportation system, and improving our understanding of the impacts of climate change on transportation networks.

Texas Transportation Institute estimated highway congestion in the United States wastes 2.9 billion gallons of fuel annually, translating to 2.6 million metric tons of unnecessary CO2.

In April, Secretary Peters announced a proposal that would establish the first new fuel economy standards for passenger cars in more than two decades, and would update and expand fuel economy standards for light trucks.

Through the Federal Highway Administration’s Congestion Mitigation and Air Quality Improvement Program (CMAQ), the Department is working with State and local governments on a range of programs to improve urban air quality within the transportation sector. For example, DOT has cooperated with the Environmental Protection Agency’s SmartWay Program initiative to retrofit trucks and truck stops with on-board and off-board auxiliary power to run vehicle lights and air conditioning and reduce truck idling. This program has reduced fuel consumption, criteria pollutant emissions, and greenhouse gas emissions, and has expanded to include idling emissions from marine, agricultural, rail, and off-road heavy-duty engines. The Federal Transit Administration funds the development and deployment of alternative fuel buses, including hydrogen fuel cell buses, and diesel-electric hybrid buses, as well as alternative fuels infrastructure for transit systems across the United States.

Early this year, DOT released The Impacts of Climate Change and Variability on Transportation Systems and Infrastructure: Gulf Coast Study, Phase I. This study provides an assessment of the vulnerabilities using 21 simulation models and a range of future scenarios.

The study found that potential changes in climate, through both sea level rise and subsidence over the next 50–100 years, could disrupt transportation services in several key ways.

  1. 27% of major roads
  2. 9% of rail lines
  3. 72% of area ports

All of these are at, or below 4 feet in elevation above sea level, and could be vulnerable to future sea-level rise combined with non-climate related sinking of the area’s land mass that is occurring in the area. The study is designed to help State and local officials as they develop their transportation plans and make investment decisions. Subsequent phases of the study are intended to focus on risks and adaptation strategies involved in planning, investment, and design decisions for infrastructure in the Gulf Coast region and nationwide.

The study was performed in partnership with the U.S. Geological Survey and State and local researchers, and is one of 21 ‘‘synthesis and assessment’’ reports produced as part of the U.S. Climate Change Science Program. A similar study that will soon be released is The Potential Impacts of Global Sea Level Rise on Transportation Infrastructure. This study was designed to produce rough estimates of how future climate change, specifically sea level rise and storm surge, could affect transportation infrastructure on the East Coast of the United States. Like the Gulf Coast Study, this study’s major purpose is to aid policymakers by providing estimates of these effects as they relate to roads, rails, airports, and ports.

Admiral BARRETT. Demand has gone up dramatically over the past several years globally.   We’re getting up to the limits of what the available supply is, and we need to think very seriously about expanding that supply, particularly domestically, as you mentioned, in areas such as offshore or areas such as ANWR. We need to think very seriously about that, and improve our supplies.

Certainly, freight rail is a hugely efficient way of moving freight. It’s near capacity across the country.  [As far as high-speed rail] the technology is enormously expensive.   Unlike some other places, we’re using existing infrastructure. It takes a lot of work, and would probably be feasible only in very heavily trafficked corridors.

Senator KERRY.  Let me ask you what is the guiding operative management target under which Department of Transportation, Department of Energy, and others are proceeding with respect to global climate change? This hearing is obviously on global climate change. This is the 20-year anniversary of Jim Hansen coming up here and telling us that it’s happening now, 20 years ago. Now we know it’s happening, even to a greater degree and faster than was predicted. I’d like to know what the operative estimate is of your Department as to where a potential, sort of, catastrophic tipping point may be, and how fast you have to respond to these infrastructure challenges. And I do that particularly in light of the fact that there are predictions, for instance, that—just last week, The Washington Post ran a story headlined, ‘‘Extreme Weather to Increase with Climate Change,’’ and, ‘‘Our scientists now agree that the droughts are going to get drier, the storms are going to get stormier, the floods are going to get deeper with climate change.’’ That’s a quote. They warn of more flooding, like we’re seeing in Iowa today, more heavy downpours, more droughts. ‘‘In March, the Department of Transportation found that the Gulf Coast would put a substantial portion of the region’s transportation infrastructure at risk. Storm surges in the Gulf Coast will flood more than half the area’s major highways, almost half of the rail miles, 29 airports, and virtually all of the ports.’’ So, given these predictions, which keep coming at us, under what time-frame do you believe you’re operating, in terms of the infrastructure expenditures necessary to respond to these threats?

Admiral BARRETT. The Gulf Coast study is regionally focused, where obviously, you’ve got the potential for sea level rise, temperature changes, storm intensity, and so on. With respect to transportation infrastructure, the first step is understanding the potential implications in local areas, because they vary. The next study will be the East Coast, where the impacts will be different.   So, I think the first thing we are trying to do is understand better, particularly regionally, what the actual implications might be so that people who repair and renew and expand transportation infrastructure, which, to a large extent, rests in the states, as well as the Federal Government, can adjust to that over time as they repair and renew and build out.

I think there is no timeline, but we clearly need to understand what needs to be done, and, as we plan new projects. I think you will see adjustments to how we design, build, and install bridges to withstand climate better, and the impacts of climate change, whether it’s increased storms or higher river levels.

Senator KERRY. I’ll just say there really is a specific time. Jim Hansen, who is hugely respected, first warned of this, 20 years ago, and we’ve been slow to respond to it. The science is only coming back stronger and more rapidly and greater. Jim Hansen has now revised—right now, today, in these days—is warning us that we have less cushion than the scientists thought when they revised the cushion from several years ago. So, it’s gone from 550 parts per million of greenhouse gases, to 450, and now, they believe, less than that. There is a time-frame here. They’ve said we’ve got 10 years to get this right. And if you’re saying to us there’s no time- frame, the attitude of where we are, I think this is going to be very difficult to get done. And I think it’s, frankly, inappropriate, that that is where a major department, the Department of Transportation, stands today. I think there ought to be vast commitments in incentives, tax incentives, grants, expenditures to put America on a course to deal with this.

Senator STEVENS. I was told that the application of cap-and-trade, the credits that would be required during the construction phase alone for a pipeline would be the largest project in the history of the United States financed by private capital—that, for all the trucks and everything else that are going to be used in this construction phase over a period of 5–6 years, that the costs would be increased by at least 20% if they had to go out and buy credits under that concept for the pollution that’s taking place, notwithstanding the fact that the completion of the line would bring about the delivery of an enormous amount of new additional natural gas, which is not as polluting as the coal that people are using in many of the areas that would be supplied. There doesn’t seem to be any leeway for those who want to move to try and get a more efficient type of energy available. I think that cap-and-trade legislation would kill that pipeline.

Admiral BARRETT.  I agree, in general. Cap-and-trade in transportation is very treacherous and needs to be looked at very closely.

Senator Ted Stevens, Alaska. The University of Alaska recently released a report on potential impacts of climate change on transportation and public infrastructure in Alaska. The report found that the effects of climate change stand to increase maintenance and replacement costs of public infrastructure in Alaska by up to 20%, or an additional $6 billion over the next two decades.

Conservation measures and alternative energies need to be part of our long-term strategy, but the idea that we can transition from fossil fuels anytime in the next 20 years is not realistic. Worldwide oil demand is expected to increase to 116 million barrels a day by 2030. We do need to explore ways to ease our dependence on fossil fuels in the transportation sector, but the investments required to make this transition are enormous. This is why I continue to argue that revenues from new domestic sources of oil, including ANWR, should be devoted to climate change adaptation and alternative energy development to reduce our dependence on foreign oil.

Senator Thomas R. Carper, Delaware.   When I was Governor of Delaware, if we wanted to build a road or a highway or a bridge, the Federal Government paid for 80% of it. If we wanted to do a transit investment, the Federal Government provided 50% of it. If we wanted to invest in intercity passenger rail, the Federal Government provided nothing. And I’m sure we made investment decisions, that were probably wrong decisions, because of the difference in those modes of—or measures of Federal support.

Senator Bill Nelson, Florida.  So you all are saying, with climate change, roads will buckle, bridges will wash out, railroads will be destroyed. If the seas rose 2 feet, in my state of Florida what kind of investment in transportation would be thrown out the window as a result of that?

Admiral BARRETT. I would guess substantial. But I would take the approach of quantifying specifically what rail would need to be rerouted, what roads would need to be readjusted. I think you need very specific analysis at a local and/or regional level.  Understanding the specific impacts is enormously important.

Senator Bill Nelson, Florida.   In a state like Florida, where 80% of the population is on the coast, it’s very difficult to go in and redo all of that infrastructure. And the cost is just going to be enormous. So, we’d better start figuring out something to do so that the seas don’t rise.

Senator John Thune, South Dakota. On account of aging and outdated infrastructure, we have economic challenges that are real, tangible, and identifiable today. Many of these infrastructure challenges are going unmet. Based on projections of population growth and government funding streams such as the Federal Highway trust, fund we know that these challenges will only grow in the future and resources will increasingly fall short of meeting these real short- and mid-term challenges.

Senator Frank R. Lautenberg, New Jersey.  One-third of America’s greenhouse gas emissions comes from cars, trucks, and buses. And Dr. James Hansen, NASA scientist, said, just last week, ‘‘If we don’t begin to reduce greenhouse gas emissions in the next several years, then we are in trouble.’’ And we’ve got to begin by getting cars off the road, more people onto passenger rail, buses, subways, and other types of mass transit. Already, more and more people are riding public transit, and it’s more efficient, more convenient.

We’ve also got to act to ensure more efficient movement of freight. Trains are at least 6 times more energy efficient than trucks, and barges are more than 8 times as efficient. I chaired a Subcommittee hearing a couple of weeks ago on freight transportation needs, and, based on what I learned, I plan to introduce tax relief legislation which will encourage greater use of ships and barges, or, as we call it, short sea shipping between U.S. ports. By investing in fuel efficiency, mass transit, and better freight strategies, we can both bring relief to the people at the pump and fight global warming for generations to come.

John Porcari, Secretary, Maryland Dept. of Transportation; Chair, Climate Change Technical Assistance program advisory board; Chair, Standing committee on Aviation, American Association of State Highway & Transportation officials

The effort to reduce greenhouse gas emissions will involve many separate initiatives. There is no silver bullet. We should not get so caught up in debates about competing approaches that we lose sight of this bigger picture. In the transportation sector, this means we need improvements in fuel economy; we need greater usage of low-carbon fuels; we need better management of our transportation system to reduce congestion and smooth traffic flows; and we need to take steps that reduce the growth in vehicle miles traveled (VMT).

We need major technological breakthroughs in order to have any chance of dramatically cutting global emissions of greenhouse gases. For transportation, this means not only improvement in fuel economy, but ultimately a transition to entirely new fuels and new propulsion systems—for example, plug-in hybrid vehicles, zero-emission fuel-cells.

Between now and 2030, the U.S. Government forecasts that fuel efficiency will continue to improve and renewable fuels will gain market share, but also vehicle miles traveled (VMT) will continue to grow at 1.6 to 1.9 percent annually, outpacing the gains in fuel efficiency.

While technological change is essential to reducing greenhouse gas emissions, there is also a role for strategies that help to limit the growth in travel demand. As discussed above, the total VMT has grown much faster than population growth for the past several decades, but appears to have slowed considerably in the past few years. The average annual increase in VMT between 1990 and 2005 was approximately 2.2 percent. By contrast, population increased only about 0.8 percent per year during this period. Between 2005 and 2007, VMT growth occurred at a much slower rate—approximately 0.5 percent annually. Recent reports indicate that over the 12 month period between March 2007 and March 2008, VMT declined by 4.3 percent

There are many factors that can affect the future growth rate of VMT. Among the most important factors are economic trends

Against the backdrop of these larger trends, government policies also can play a role—albeit a limited one—in influencing VMT growth. Strategies that can be used include: (1) increasing investments in transit and intercity passenger rail, (2) expanding other alternatives to single-occupant vehicle travel, and (3) encouraging land uses that minimize the number and length of auto trips. Expanding Transit Service and Intercity Passenger Rail Transit service provides an alternative to automobile travel. The challenge is how to make the most of transit’s potential, given that it serves a relatively small share of travel in the United States (1% of passenger miles traveled) and major transit system expansions require significant public sector funding.

Passenger travel also occurs by walking, biking, carpooling, vanpooling, and telecommuting [so we should try to shift single-occupant autos toward these methods].   Telecommuting is likely to be a highly cost-effective strategy.

Patterns Land use decisions play an important role in determining the demand for automobile travel. Existing land use patterns in many areas make automobile travel a necessity for most trips. Higher-density land use patterns, combined with increased availability of transit service, could help to reduce the demand for automobile travel without reducing mobility.

Traffic congestion contributes to greenhouse gas emissions because vehicle engines operate less efficiently—and therefore produce higher emissions per mile— when they are driven at low speeds in stop-and-go traffic. The optimal speed for motor vehicles with internal combustion engines is about 45 mph. [FOR CO2, as usual, fuel efficiency is left out]. At lower speeds, CO2 emissions per mile are several times higher than at 45 mph. At higher speeds, CO2 emissions per mile increase as well, but somewhat less sharply. If we can reduce the amount of fuel burned by vehicles stalled in traffic that is a gain. If we can improve the flow of traffic so fuel is burned at more optimal efficiency rates then that will also produce a gain.

The way motorists operate their vehicles affects greenhouse gas emissions. The March 2007 TRB report notes that: Recent EAP data suggests that a significant component of greenhouse gas emissions—as much as 22 percent—results from inefficient operation of motor vehicles. These inefficiencies could result from factors beyond the driver’s control, such as traffic congestion, and also could reflect a driver’s own behavior, such as high-speed driving, vehicle maintenance, and tire pressures. Driver education and other policies could help to promote more efficient vehicle operations

Operational and maintenance impacts of excessive heat. ‘‘Periods of excessive summer heat are likely to increase wildfires, threatening communities and infrastructure directly and bringing about road and rail closures in affected areas. Longer periods of extreme heat may compromise pavement integrity (e.g., softening asphalt and increasing rutting from traffic); cause deformation of rail lines and derailments or, at a minimum, speed restrictions; and cause thermal expansion of bridge joints, adversely affecting bridge operation and increasing maintenance costs.’’

Increased flooding of coastal roads and rail lines. ‘‘The most immediate impact of more intense precipitation will be increased flooding of coastal roads and rail lines. Expected sea level rise will aggravate the flooding because storm surges will build on a higher base, reaching farther inland. . . . [The IPCC] identifies coastal flooding from expected sea level rise and storm surge, especially along the Gulf and Atlantic coasts, as one of the most serious effects of climate change. Indeed, several studies of sea-level rise project that transportation infrastructure in some coastal areas along the Gulf of Mexico and the Atlantic will be permanently inundated sometime in the next century.’’

  • Disruption of coastal waterway systems. ‘‘[A] combination of sea level rise and storm surge could eliminate waterway systems entirely. For example, the Gulf Coast portion of the intercoastal waterway will likely disappear with continued land subsidence and disappearance of barrier islands. This will bring an end to coastal barge traffic, which helps offset rail and highway congestion; all ships will have to navigate the open seas.’’
  • Impacts on Alaskan infrastructure. ‘‘The effects of temperature warming are already being experienced in Alaska in the form of continued retreat of permafrost, creating land subsidence issues for some sections of the road and rail systems and for some of the elevated supports for above-ground sections of the Trans-Alaska pipeline. Warming winter temperatures have also shortened the season for ice roads that provide vital access to communities and industrial activities in remote areas.’’

Several other studies have also concluded that climate change is likely to have widespread and severe impacts on transportation infrastructure.

U.S. DOT Gulf Coast Study.  The study recognized ‘‘4 key climate drivers’’ in the Gulf Coast region: rising temperatures, changing precipitation patterns, rising sea levels, and increasing storm intensity. It suggested a range of possible responses, including raising transportation facilities in low-lying areas; hardening them to withstand storm events; relocating them to areas that are less vulnerable; and expanding redundant systems where needed.

ICF Studies of Sea-Level Rise. This two-part study focused specifically on the potential impacts of sea-level rise (not climate change in general) on transportation infrastructure. Phase 1 assessed impacts of sea-level rise on the District of Columbia, Maryland, Virginia, and North Carolina. Phase 2, which is still under way, will evaluate impacts of sea-level rise on seven additional States on the East Coast: New York, New Jersey, Pennsylvania, Delaware, South Carolina, Georgia, and the Atlantic Coast of Florida.

Edward Dickey, Ph.D. Affiliate professor of economics, Loyola College in Maryland; member, committee on climate change & U.S. transportation, transportation research board, division on earth and life studies, National Research Council, The National Academies

The past several decades of historical regional climate patterns commonly used by transportation planners to guide their operations and investments may no longer be a reliable guide for future plans. Future climate will include new classes (in terms of magnitude and frequency) of weather and climate extremes, such as record rainfall and record heat waves, not experienced in modern times as human-induced changes are superimposed on the natural variability of the climate. Decisions transportation professionals take today, particularly those related to the redesign and retrofitting of existing transportation infrastructure or the location and design of new infrastructure, will affect how well the system adapts to climate change far into the future.

Potentially, the greatest impact of climate change on North America’s transportation system will be flooding of coastal roads, railways, transit systems, and runways because of a global rise in sea level coupled with storm surge and exacerbated in some locations by land subsidence. The vulnerability of transportation infrastructure to climate change, however, will extend well beyond coastal areas. Therefore, Federal, state, and local governments, in collaboration with owners and operators of infrastructure such as ports and airports, and private railroad and pipeline companies should inventory critical transportation infrastructure to identify whether, when, and where projected climate changes in particular regions might be consequential.

Public authorities and officials at various governmental levels and executives of private companies are making short- and long-term investment decisions every day and should incorporate climate change into their long-term capital improvement plans, facility designs, maintenance practices, operations, and emergency response plans.

The significant costs of redesigning and retrofitting transportation infrastructure to adapt to the potential impacts of climate change suggest the need for more strategic, risk-based approaches to investment decisions. Transportation planners and engineers should incorporate more probabilistic investment analyses and design approaches that apply techniques for trading off the costs of making the infrastructure more robust against the economic costs of failure and should communicate these trade-offs to policymakers who make investment decisions and authorize funding.

David Friedman, Research Director & Senior Engineer, the Union of Concerned Scientists

Most of the planes, trains, ships, and automobiles we rely on were designed during the days of cheap oil when fuel efficiency was not a priority. Manufacturers have been slow to respond to recent consumer demands for fuel economy and consumers have also been slow to change.  Both personal travel and goods movement have evolved around our extensive and dispersed national highway system. Compact, walk-able or bike-able communities and easy access to transit are the exception rather than the rule. Consumers and corporations lack choices to substitute for reliance on our cars and trucks. The transportation sector is almost exclusively reliant on fossil fuels, …alternative fuels meet only about 0.2 percent of U.S. transportation fuel

To reduce America’s oil addiction, and save consumers tens of billions of dollars, we must give consumers and corporations new options to use fuel more efficiently when they travel or ship goods. This can be achieved either through vehicle global warming pollution standards or by setting fuel economy standards. Through the Ten in Ten Fuel Economy Act, this Committee led the Nation forward on fuel economy for cars and light trucks for the first time in more than three decades. And for the first time ever, the door was opened to fuel economy standards for medium and heavy duty trucks thanks to this Committee.  [off limits even more than autos??]

The projected benefits of just the light-duty portion of the Ten in Ten Fuel Economy Act highlight the importance of keeping efficiency a top priority. Meeting the minimum fuel economy requirement of 35 miles per gallon would cut global warming pollution for new cars and trucks nearly 30% by 2020. The minimum will also reduce oil consumption by nearly 9 billion barrels through 2030, rising to about 30 billion barrels saved through 2050. And finally, boosting fuel economy from today’s 25 mpg average to 35 mpg will save consumers the equivalent of reducing the price of today’s $4 per gallon gasoline by more than one dollar.

Delivery trucks and 18-wheelers could increase fuel economy from today’s level of less than 7 mpg for new vehicles to 10–11.5 mpg by 2030. This represents a boost of 50–70% while maintaining or expanding today’s hauling capacity. However, because of language in Ten in Ten, it may be at least 8 years before this committee’s medium and heavy duty standards are put to work.

NHTSA appears unwilling or unable to move the country on this path and this Committee should exercise its oversight authority to ask NHTSA to fix a variety of flaws used in setting their proposed standards [see document for links to recommendations].  Changes along these lines would redirect NHTSA’s efforts to the intent, not just the letter, of the law passed as part of Ten in Ten. NHTSA’s own analysis confirms that simply switching to total benefits, even with their poor gas price assumptions, would have led them to propose a fleet-wide average of at least 35 mpg by 2015— 5 years earlier than the required minimum. More realistic gas prices, even only setting the standard based on the marginal benefits, would also have led NHTSA to propose a fleet-wide average over about 35 mpg by 2015.  Making matters worse, not only will NHTSA’s poor analysis shortchange consumers and lead to lower global warming pollution reductions, we can expect a similar approach to shortchange trucking companies and the environment when NHTSA address fuel economy standards for medium and heavy duty vehicles. This Committee’s oversight role is essential to avoiding this outcome.

While great strides can be made to improve vehicle efficiency, it is unlikely that technology alone will be able to keep pace with growing demand for personal and freight travel if we continue on our current path. As a result, despite the potential for parts of the transportation sector to increase efficiency by 50 percent or 100 percent, global warming pollution from transportation will continue to increase beyond current levels.

As with efficiency, the first step is to ensure that consumers and corporations have alternatives other than business as usual. Both urban and suburban areas need greater access to public transportation. As of 2001, less than one-third of the U.S. population lived within about a block of a bus line, while only about 40 percent lived within a half mile. The situation is even worse for rail, where only about 10% of U.S. population lived within a mile of a rail stop, while only about a quarter lived within 5 miles.  In addition to transit, consumers need improved access to high occupancy vehicle (HOV) lanes, bike lanes, and more affordable housing near where they work. Corporations need many of the same things. While 18-wheelers provide a lot of flexibility in the freight world, it takes 5–7 times more energy to ship a ton of goods on a truck than on rail. Trucks and buses might also benefit from their own dedicated lanes where they are not caught up in as much stop and go traffic, making highways safer as well.

For these various new options to work, two key resources are needed: the money to fund them and the willingness to use them. Thankfully, in many cases, a system that makes sure people and products carry the full cost of their travel can help with both. Whether it is insurance, wear and tear on highways and bridges, or the costs of the pollution produced from tailpipes, charging per mile rather than per year or per gallon can create both a revenue stream for the needed investments and a more direct incentive to try out the newly available approaches. Some examples of these approaches include:

  1. Pay as you drive insurance: If you drive less, you are less likely to get into an accident. Paying for insurance by the mile rather than just by the car would both provide a more equitable distribution of insurance payments and encourage people to drive less.
  2. Per mile road user fees: Current highway construction and maintenance costs, and some transit costs, are covered by per gallon fuel taxes. Because fuel efficiency must go up, projected tax receipts will go down compared to a business as usual scenario. Per mile road user fees, adjusted to vehicle weight, could maintain a steadily growing revenue stream to keep our roads and bridges from falling apart while encouraging consumers and corporations to seek less expensive alternatives.
  3. Per mile pollution or congestion fees: Accidents and wear and tear are not the only costs associated with every mile we drive. Per mile pollution and congestion fees can become steady funding sources to hold people responsible for the damage they create while creating a funding stream for alternatives, plus they would provide another incentive to drive less. Per mile pollution and congestion fees tied to air travel and freight could be great ways to finance high-speed rail or simply much needed reinvestment into the country’s conventional rail infrastructure.
  4. Location efficient mortgages: Current tax codes give consumers the same break on their mortgage interest no matter where they live. While these tax breaks have helped many live out the American dream of owning a house, they have also helped lower the cost of owning homes that are farther from where people work, increasing daily travel. Revamping that tax code to provide greater tax breaks for those who live closer to work or transit will still help people realize a part of the American dream while ensuring it does not become a nightmare of pollution and congestion. This is not intended to be an exhaustive list, but instead points the way to policies and practices that could help cut projected personal travel by 25 to 35% percent by 2050 (15 to 20% by 2030) and could contribute to reducing the amount of freight that is trucked by 20% or more by 2050.
  5. Even more innovative approaches, such as reserving downtown areas for walking, biking, and public transit, or directly integrating our personal and freight vehicles with a mass transit system, could be part of a smart growth revolution that allows us to rethink how we move people and goods.

If we combine all of the approaches above for our light-duty cars and trucks, then by 2050 we will still need to supply the equivalent of 80 to 110 billion gallons of gasoline with 70–80% less global warming pollution than today’s fuel. For medium and heavy duty trucks, we will need the equivalent of another 30 to 40 billion gallons of gasoline with 75–80% less global warming pollution. And for the remainder of the transportation sectors, we will need yet another 40 to 50 billion gallons of low carbon fuel. That means, by 2050, we will need the equivalent of 150 to 200 billion gallons of gasoline with as much as an 80% reduction in global warming pollution compared to today’s gasoline.

Biofuels will play an important part in a low carbon future, it is unlikely, at best, that we can sustainably produce sufficient low-carbon biofuel in the U.S. A more realistic estimate of sustainable biofuel potential, one that minimizes tradeoffs between food and fuel and does not encourage deforestation in other countries, would be closer to 40 to 50 billion gallons, unless breakthroughs are achieved in novel biomass resources. To supply the rest of transportation’s needed energy, we must to tap into renewable electricity and clean hydrogen. But these resources will not appear overnight, nor will the vehicles that must be sold to use these low-carbon fuels. We will need multiple policies to bring about the needed fuel revolution.

The U.S. needs to move away from a piecemeal approach to transportation energy and environmental policy and instead adopt a comprehensive set of policies that will tap into both the near term and long term solutions that are available or on the drawing boards. This will require a longer term perspective and a combination of consistent, significant, and sustained policies. Yes, we do need to rethink our transportation system, but in doing so, we will not only dramatically lower global warming pollution, we will save consumers billions, create new jobs in America and ultimately cut our addiction to oil.

Edward R. Hamberger, President & CEO, Association of American Railroads

Moving more freight by rail would also help reduce highway congestion, which costs $78 billion just in wasted travel time (4.2 billion hours) and wasted fuel (2.9 billion gallons) each year, according to the Texas Transportation Institute’s 2007 Urban Mobility Report. (The total costs of congestion are far higher if lost productivity, costs associated with cargo delays, and other items are included.) A typical train, though, takes the freight equivalent of several hundred trucks off our congested highways, thus enhancing mobility and reducing the amount of greenhouse gases emitted by motor vehicles stuck or slowed in traffic. Railroads also reduce the costs of maintaining existing roads and reduce the pressure to build costly new roads, freeing up limited funds for other purposes.

Train handling. In part, railroad fuel efficiency depends on how well an engineer handles a train. That’s why railroads use the skills of their engineers to save fuel. For example, many railroads offer training programs through which engineers and simulators provide fuel-saving tips. On some major railroads, the fuel consumption performance of participating engineers is compared, with awards given to the top ‘‘fuel masters.’’ In addition, railroads are using sophisticated on-board monitoring systems to gather and evaluate information on location, topography, track curvature, train length and weight, and more to provide engineers with real-time ‘‘coaching’’ on the best speed for that train from a fuel-savings standpoint.

Information technology. Many railroads use advanced computer software to improve their fuel efficiency. For example, sophisticated modeling tools identify the best way to sequence cars in a large classification yard. Railroads also use innovative ‘‘trip planning’’ systems that automatically analyze crew and locomotive availability, track congestion, the priority of different freight cars, track conditions, and other variables to optimize how and when freight cars are assembled to form trains and when those trains depart. The result is smoother traffic flow, better asset utilization, and reduced fuel use.

Idle reduction technology. Locomotives often have to idle when not in use to pre vent freezing, provide for crew comfort, or for other reasons. However, many railroads have installed idle-reduction technology that allows main engines to shut down under certain conditions. One advantage of genset locomotives is that their smaller engines use antifreeze, allowing them to shut down in cold weather. Railroads also use ‘‘auxiliary power units’’ to warm engines so that locomotives can be shut down in cold weather.

Components, maintenance, and design. Railroads use innovative freight car and locomotive components, maintenance programs, and designs to save fuel. For example, advanced lubrication techniques save fuel by reducing friction; the use of low torque bearings on freight cars and improving the aerodynamic profile of trains save fuel by reducing drag; and the use of ‘‘distributed power’’ (locomotives placed in the middle of trains) can, in certain applications, save fuel by improving operational efficiency.

Amtrak’s locomotive fleet is antiquated: its diesel switcher locomotive fleet is 40 years old; the average age of the AEM–7 electric fleet is 25 years, and its overhead electric catenary system in the Northeast Corridor is 1930s technology that does not allow Amtrak to take advantage of the improved efficiency of modern converter, transformer, and transmission designs. Passenger cars could be made lighter and more aerodynamic. These are all areas worthy of government investment that will pay huge dividends over the long term. Moreover, the implementation of high-speed rail corridors, if done in ways that minimize the substantial operational, engineering, legal, and other impediments that often hinder the ability of freight railroads to accommodate passenger trains, would go a long way in providing a realistic alternative to short-distance air travel and driving for millions of trips per year while significantly reducing the carbon footprint associated with that travel.

Senator LAUTENBERG.   Even with fuel efficiency improvements, airplanes will not be as efficient as trains, particularly for journeys of 400 miles or less, and particularly in highly populated areas. Doesn’t it make sense, environmentally as well as economically, to invest more in rail? Shouldn’t we be encouraging  the most efficient travel possible? And as it appears now, it’s rail.

Senator Barbara Boxer, California. Six of the Nation’s top ten freight gateways, which are centers for economic activity, will be at risk if sea levels rise. 60,000 miles of coastal highways already experience coastal storm flooding and wave action. This number is certain to increase with rising the sea levels, leaving communities vulnerable to ocean waves and cutting off evacuation routes.

ASSOCIATION OF AMERICAN RAILROADS

AAR subscribes to the following 11 Federal funding principles, which fall into three categories. The first 9 principles assure that Federal funding will create sustainable partnerships with public entities while maximizing the public benefits found in rail projects. The tenth promotes freight rail as a solution to looming transportation challenges. The eleventh clarifies that grade separations do little to benefit rail capacity or rail productivity.

  1. Federal funding and policies must not reduce and should encourage private investment in the Nation’s rail system.
  2. In all public-private partnerships, public benefits should be funded by public funds, and railroad benefits should be funded by railroad funds.
  3. The same funding principles should apply to projects involving other modes of freight transportation.
  4. If the Federal Government establishes a freight fund to fund public benefits of freight rail projects, funding should not be extracted from freight transportation providers or their customers or disadvantage the economics of rail transportation. Further, freight railroads should not be required to assess or collect any fees. The rail logistics system should not be saddled with increased costs to fund public benefits, either directly or through a freight fund.
  5. Federal fees associated with a freight fund should preempt state and local fees, unless there is mutual agreement among the parties.
  6. Any involvement by a rail carrier in public-private projects must be strictly voluntary.
  7. Federal funding of public benefits must not be in lieu of the enactment of Federal investment tax incentives for increased private investment.
  8. Federal funding must not be conditioned upon a change in the present economic regulation of the rail industry or other industry concessions.
  9. Federal funding must be executed in a manner that preserves the rail industry’s current ownership rights.
  10. Federal freight investment should focus on key transportation projects with significant public benefits, such as eliminating rail chokepoints, improving service to shippers, facilitating international trade, reducing greenhouse gas emissions, cutting vehicle miles traveled, and improving safety. Such projects should be selected based upon standardized, agreed-upon methodology.
  11. Grade separations must continue to be regarded as primarily beneficial to the highway/road user. They do little to increase freight rail capacity or improve rail productivity.

Comprehensive, reliable, and cost-effective rail service is critical to our nation, and that, in turn requires having adequate rail capacity. Railroads must be able to both maintain their extensive existing infrastructure and equipment and build the substantial new capacity that will be needed to meet much higher future freight and passenger transport demand. Our privately-owned freight railroads are working hard every day to help make sure America has the rail capacity it needs. They’re re-investing record amounts in their systems ($420 billion from 1980 to 2007, or more than 40 cents out of every revenue dollar), adopting innovative new technologies and operating plans, and forging partnerships with each other, other transportation providers, and customers. Policymakers can help ensure that more freight and passengers move by rail by addressing a number of serious impediments to meeting the rail capacity challenge.

Local Opposition to Rail Projects. Under existing law, state and local regulations (other than local health and safety regulations) that unreasonably interfere with rail operations are preempted by Federal regulations. These Federal regulations protect the public interest while recognizing that our railroads form an integrated, national network that requires a uniform basic set of rules to operate effectively. Nevertheless, rail expansion projects often face vocal, sophisticated opposition by members of affected local communities. In many cases, railroads thus face a classic ‘‘not-in-my-backyard’’ problem—even for projects for which the benefits to a locality or region far outweigh the drawbacks. In the face of local opposition, railroads try to work with the local community to find a mutually-satisfactory arrangement, and these efforts are usually successful. When agreement is not reached, however, projects can face seemingly interminable delays and sharply higher costs. Often, local communities allege violations of environmental requirements to challenge a proposed project, even though detailed environmental reviews, when required, already identify the impacts of rail projects and determine necessary mitigation measures. Railroads understand the goals of environmental laws and appreciate the need to be responsive to community concerns, but community opposition to rail operations can be a significant obstacle to railroad infrastructure investments, even when the opposition has no legal basis. Policymakers can help by taking steps to shorten the time it takes for reviews of rail expansion projects in ways that do not adversely affect the quality of those reviews.

If rail capacity needs are not properly addressed, by 2035 some 16,000 miles of primary rail mileage—nearly one-third of the 52,000 miles covered in the study—will be so congested that a widespread service breakdown environment would exist. (Today, less than 1% of rail miles are that congested.) Because our rail system is interconnected, this outcome would mean that America’s entire rail system would, in effect, be disabled.

One way to help bridge the funding gap is through tax incentives for rail infrastructure investments.

The 2007 1125/H.R. 2116 (the ‘‘Freight Rail Infrastructure Capacity Expansion Act of 2007) calls for a 25% tax credit for investments in new track, intermodal facilities, yards, and other freight rail infrastructure projects that expand rail capacity. All businesses that make capacity-enhancing rail investments, not just railroads, would be eligible for the credit. A rail ITC would addresses the central challenge of how to move more freight without causing more highway gridlock or environmental degradation. For a railroad considering whether to fund an expansion project, an ITC would reduce the cost of the project, raising the likelihood that the project will be economically viable. It would help worthwhile projects get built sooner, but would not be enough to cause economically-unjustified projects to go forward. An ITC would also stimulate the economy. U.S. Department of Commerce data indicate that every dollar of freight rail infrastructure investment that would be stimulated by a rail infrastructure ITC would generate more than three dollars in total economic output. Each $1 billion of new rail investment induced by the ITC would create an estimated 20,000 jobs nationwide. The benefits to our economy would be broad and long lasting. Policymakers should also support a short line tax credit. Since 1980, more than 380 new short lines have been created, preserving thousands of miles of track (much of it in rural areas) that may otherwise have been abandoned. In 2004, Congress enacted a 50% tax credit (‘‘Section 45G’’) for investments in short line track rehabilitation. The focus was on assisting short lines in handling the larger and heavier freight cars that are needed to provide their customers with the best possible rates and service. Since Section 45G was enacted, hundreds of short lines have rapidly increased the volume and rate of their track rehabilitation and improvement programs. Unfortunately, Section 45G expired in 2007. Pending legislation in Congress (S. 881/H.R. 1584, the ‘‘Short Line Railroad Investment Act of 2007’’) would extend this tax credit and thus preserve the huge benefits it delivers. Finally, a more pronounced use of public-private partnerships would help get more freight on our rails. Public-private partnerships reflect the fact that cooperation is more likely to result in timely, meaningful solutions to transportation problems than a go-it-alone approach. Without a partnership, projects that promise substantial public benefits (including reduced highway gridlock and highway construction and maintenance costs, reduced pollution and greenhouse gas emissions, and enhanced mobility) in addition to private benefits are likely to be delayed or never started at all because it would be too difficult for either side to justify the full investment needed to complete them. In contrast, if a public entity shows it is willing to devote public dollars to a project based upon the public benefits that will accrue, the private entity is much more likely to provide the private dollars (commensurate with private gains) necessary for the project to proceed. Partnerships are not ‘‘subsidies’’ to railroads. Rather, they acknowledge that private entities should pay for private benefits and public entities should pay for public benefits. In many cases, these partnerships only involve the public contributing a portion of the initial investment required to make an expansion project feasible, with the railroad responsible for keeping the infrastructure productive and in good repair.

JAMES M. TURNER, DEPUTY DIRECTOR, NATIONAL INSTITUTE OF STANDARDS AND TECHNOLOGY, U.S. DEPARTMENT OF COMMERCE

Supporting Innovation in Advanced Materials—Lightweight Materials and Nanocomposites

Automobiles and light trucks consume 79% of all U.S. distilled fuel. Lightweight materials are a big part of the solution to reduce our consumption. The Department of Energy, Office of Vehicle Technologies states that lightweight materials are needed to ‘‘offset the increased weight and cost per unit of power of alternative powertrains (hybrids, fuel cells) with respect to conventional powertrains.’’

The cement and concrete industry is a large generator of greenhouse gas, mainly carbon dioxide (CO2), during the manufacturing production process. One U.S. ton of cement produces about one ton of CO2 and the annual world production of cement—2.5 billion tons—is equal to a 3–9% estimated share of world man-made CO2. In 2006, the U.S. produced 96 million tons of cement and 37 million tons were imported for use in the U.S. It is estimated that 1.5% of U.S. man-made CO2 generation comes from concrete production. And while this is a large number, cement production is forecast to greatly increase over the next 20–40 years because of burgeoning demand for new and replacement infrastructure.

In the U.S., the energy efficiency of cement production is already high, and is probably only capable of fairly small improvements. One is limited to reducing the CO2 that is given off from the raw materials by partially substituting another material for the cement in concrete, such as the substitution of non-CO2 containing materials for a portion of the limestone in the raw materials. Around the world, the two most common minerals used to substitute for cement are fly ash and granulated ground blast furnace slag. The use of fly ash and slag in concrete can actually improve the properties of concrete, especially the durability. Let me highlight some of NIST’s work to address the needs of the concrete industry itself. All of our work will improve our understanding of how cement and concrete actually work, and ultimately should make possible improvements in the formulation and use of cement that could save hundreds of millions of dollars in annual maintenance and repair costs for concrete structures and the country’s infrastructure. This work should also lead to improving the properties and performance of concrete while decreasing energy costs and reducing the CO2 emissions from its production.

Cement may be the world’s most widely used manufactured material—more than two billion metric tons are consumed each year—but it also is one of the more complex. And while it was known to the Romans, who used it to good effect in the Coliseum and Pantheon, questions still remain as to just how it works, in particular how it is structured at the nano- and microscale, and how this structure affects its performance.

NIST researchers are investigating adaptive concrete technologies including internal curing and the incorporation of phase change materials into concrete to increase its service life. Field concrete is exposed to a wide variety of environmental conditions and distress. These environmental factors often result in premature degradation and/or failure. Examples include early-age cracking due to shrinkage and degradation as a result of repeated cycles of freezing and thawing, and deterioration due to damaging reactions of chemicals (chloride, sulfate, and alkali ions, etc.).

NIST is working to have a dramatic effect on the concrete industry through doubling the service life of new concrete by altering the composition of concrete. One of the main goals of high performance concrete is to increase service life. Under most chemical erosion scenarios, the service life of concrete depends on its reaction to external chemicals entering it. There are a number of ways to significantly increase the service life of concrete including reducing the porosity and adding mixtures to provide increased resistance to the infiltration of chemicals. Unfortunately, one of the side effects of these modifications is a large increase in the propensity for early-age cracking, and the desired barrier performance of a dense concrete is easily compromised by the formation of just a few cracks.

The time until the steel reinforcement in the concrete rusts is related to the depth of concrete cover, so that if you increase the thickness of concrete over the steel by 50%, you get approximately double the expected service life. More concrete covering the rebar may not be feasible because of design constraints, and both additional concrete and changing the composition to resist chemicals can add considerable cost to construction.

James M. Turner, deputy director, National Institute of Standards & Technology, U.S. Department of Commerce on Hydrogen

Getting an Accurate Fill-Up. Working very closely with State weights and measures organizations, NIST has long maintained the standard for ensuring that consumers actually receive a gallon of gas every time they pay for one. Now NIST researchers are incorporating the properties of hydrogen in standards that will support the development of hydrogen as a fuel in vehicles. One of the challenges in the use of hydrogen as a vehicle fuel is the seemingly trivial matter of measuring fuel consumption. Consumers and industry are accustomed to high accuracy when purchasing gasoline. Refueling with hydrogen is a problem because there are currently no mechanisms to ensure accuracy at the pump. Hydrogen is dispensed at a very high pressure, at varying degrees of temperature and with mixtures of other gases. NIST’s research and new technological innovations will enable accuracy in hydrogen fill-ups.

Technical challenges need to be overcome to make hydrogen-powered vehicles more practical and economical. Fuel cells need to operate as reliably as today’s gasoline engine. We need systems that can store enough hydrogen fuel to give consumers a comfortable driving range. We need science-based standards that will guide local officials in establishing codes for building and fire safety as they relate to something like a hydrogen fueling station. And we need a technical infrastructure to ensure the equitable sale of hydrogen in the marketplace, as exists today for gasoline.

Transporting and Distributing Hydrogen. One barrier to hydrogen is pipelines. There are currently 700 miles of hydrogen pipelines in operation—that is in comparison to 1 million miles of natural gas pipelines. To move to a nationwide use of hydrogen, safe and effective pipelines have to be developed.

Tests have to be developed to test for the degradation that is likely to occur to the metals that can be caused by hydrogen weakening the pipeline. By establishing the unique test facilities and standard test

Hydrogen Storage. Hydrogen is promoted as a petroleum replacement that presents an attractive alternative for fueling automobiles and trucks. A major roadblock associated with the use of hydrogen is the inability to store it efficiently. Hydrogen’s properties have been shown to embrittle metals and current storage technologies limit the potential range of hydrogen powered vehicles.

To develop fuel cells for practical use, NIST researchers are developing measurement methods to characterize the nanoscale structure and dynamics of polymer membranes inside the fuel cell to enable stronger fuel cells.

THOMAS J. BARRETT, VICE ADMIRAL, DEPUTY SECRETARY, DEPARTMENT OF TRANSPORTATION

DOT has, and is, undertaking research required for development of safety standards for future hydrogen vehicles and infrastructure. Over the last 5 years, the Administration has invested about $1.2 billion in hydrogen research and development to help bring hydrogen fuel cell vehicles to market.

Aviation is a somewhat unheralded but real success story in these areas. Compared to the year 2000, U.S. commercial aviation in 2006 moved 12% more passengers and 22% more freight, while actually burning less fuel and reducing our carbon input by a million tons. This is a result of airframe, power, and air traffic system improvements. U.S. airlines, in a very competitive market, have committed to another 30% improvement by 2025, a goal the industry adopted before the recent spike in fuel prices. I would urge caution in not hamstringing this flagship U.S. industry that has such global reach by imposed new emission regimes.

Clearly, anyone who has flown lately, though, can attest to the fact that we are always mindful of the indispensable role that transportation plays in sustaining and improving our economy, and supporting our trade, and the importance of transportation infrastructure to the millions of Americans who depend on it for their mobility and the competitiveness of their businesses.

References

CCSP. 2008. Impacts of Climate Change and Variability on Transportation Systems and Infrastructure: Gulf Coast Study, Phase I. A Report by the U.S. Climate Change Science Program and the Subcommittee on Global Change Research [Savonis, M.J., V.R. Burkett, and J.R. Potter (eds.)]. Department of Transportation, Washington, D.C., USA, 445 pp.

CCSP. 2008. Weather and Climate Extremes in a Changing Climate. Regions of Focus: North America, Hawaii, Caribbean, and U.S. Pacific Islands. A Report by the U.S. Climate Change Science Program and the Subcommittee on Global Change Research. Department of Commerce, NOAA’s National Climatic Data Center, Washington, D.C., USA, 164 pp.

Peterson, Thomas C., et al. 2008. Climate Variability and Change with Implications for Transportation, National Research Council, Washington, D.C., http://onlinepubs.trb.org/onlinepubs/sr/sr290Many.pdf, 90 pp.

NRC. 2008. The Potential Impacts of Climate Change on U.S. Transportation. National Research Council of the National Academy of Sciences, Transportation Research Board Special Report #290, National Research Council, Washington, DC, 218 pages.


Posted in Climate Change, Transportation, Transportation Infrastructure, U.S. Congress Transportation | Tagged , , | Comments Off on Climate change impacts on transportation 2008 U.S. Senate hearing

How much net energy return required to prevent collapse?

Preface. Charles Hall, one of the founders of EROI methodology, initially thought an EROI of 3 was enough to run modern civilization, which is like investing $1 and getting $3 back. But after decades of research, Hall concluded an EROI of 12 to 14 might be needed as illustrated in the figure below (Lambert and Hall 2014).

This will give you a good idea of what Hall means by EROI (Hall 2011):

  • If you’ve got an EROI of 1.1:1, you can pump the oil out of the ground and look at it.
  • If you’ve got 1.2:1, you can refine it and look at it.
  • At 1.3:1, you can move it to where you want it and look at it.
  • We looked at the minimum EROI you need to drive a truck, and you need at least 3:1 at the wellhead.
  • Now, if you want to put anything in the truck, like grain, you need to have an EROI of 5:1. And that includes the depreciation for the truck.
  • But if you want to include the depreciation for the truck driver and the oil worker and the farmer, then you’ve got to support the families. And then you need an EROI of 7:1
  • And if you want education, you need 8:1 or 9:1
  • And if you want health care, you need 10:1 or 11:1

We begin to go over the net energy cliff as soon around 14 if you consider the arts to be an essential component of civilization. Twelve is needed for healthy care, 9 or 10 for education, and 7 or 8 to support a family, so somewhere between 7 and 14 according to how you define civilization (Fig. 12).

Murphy (2013) found that society needed at least an EROI of 11. So much net energy is provided by any energy resource with an EROI of 11 or higher, that the difference between an EROI of 11 and 100 makes little difference. But once you go below 11, there is such a large, exponential difference in the net energy provided to society by an EROI of 10 versus 5, that the net energy available to civilization appears to fall off a cliff when EROI dips below 10 (Mearns 2008).

Weissbach (2013) found that it is not economic to build an electricity generating power source with an EROI of less than 7.

The EROI of Oil (Ahmed 2017)

The debate over the precise point of peak production of an energy resource can be ultimately misleading. Production levels do not reflect the quality of the energy being produced as measured by EROI. An analysis focusing only on rates and levels of production can mask the accelerating production costs, which rise due to the decline in resource quality, so that rising production is unable to meet the energy requirements of society due to plummeting EROI values.

This is shown in a major Royal Society study focusing on the declining EROI for global oil and gas production, which calculated that the latter’s EROI is roughly 15:1 and declining, and the U.S. EROI of oil and gas production is about 11:1 and declining. Most unconventional oil and biofuels is less than 10:1. It concludes: “… as the EROI of the average barrel of oil declines, long-term economic growth will become harder to achieve and come at an increasingly higher financial, energetic and environmental cost” (Murphy 2014).

Since the 1960s, EROI has declined, even as production increased, though its rate of increase declined and appears to be approaching plateaus on a number of fronts. This highlights the often overlooked relationship between EROI and production that underscores the extent to which seemingly accelerating production in the short-term, can itself be symptomatic of a geophysically catabolic process in the long-term.

As EROI declines, increasing costs are required to maintain production. As demand rises due to economic growth, production must increase to meet demand, therefore requiring further financial, energetic and environmental inputs. But to increase production to a level sufficient to meet demand while EROI is declining, means that even more quantities of energy are required simply to maintain production, and even higher quantities required to increase it. Accelerating inputs drive up the cost which causes a further decrease in EROI even while driving increased production. The trajectory of increasing production conventionally hailed by the industry as prima facie evidence of its barometer of health is in fact the prime indicator of the catabolic depletion of the resource in question (Murphy and Hall 2011).

This is why it is perhaps more useful to speak of the peak and decline of EROI as a measure of the health of the global energy system, and indication of its future trajectory. According to this measure, EROI for global oil and gas production peaked in 1999 and has since entered terminal decline (Gagnon et al. 2009). In this same period, although oil and gas production increased, the rate of increase dramatically slowed compared to previous decades. At the same time capital expenditures (capex) by the world’s oil majors increased over 10% every year, directly illustrating the self-catabolic process at play, consisting of heightening efforts to exploit the resource base resulting in declining EROI and flattening production (Brandt et al. 2015).

According to Jancovici, since the 1960s—which is when the EROI of the global fossil fuel system as a whole was at its highest according to most studies: “…the growth rate of the GDP per capita (world average) has been slowly—and constantly—decreasing…” (Jancovici 2013 ). In the decade after 1960, he calculates, GDP was increasing at +3.5% per year. For the decade after 1970, this rate of increase dropped to +2% per year. Over the last three decades, the rate of GDP growth dropped to +1.5% per year. And in the period following the 2007–8 financial crash up to 2012, it has dropped even further to 0.4% per year on average.

The steady decline in the rate of GDP growth thus correlates directly with the steady decline in EROI of production from the global fossil fuel resource base, even as energy production has continued to increase. However, as energy production has slowed down over the last decade since 2005—accompanying the shift to lower quality unconventional liquids—now approaching an undulating plateau, so too has GDP growth.

Keep in mind that it takes a HUGE amount of energy to make the exponentially increasing amounts of the following materials from increasingly lower grades of ores that are so essential for civilization as we know it today:

intensity-metals-cement-glass-plastic-paper-silicon-wafersGlobal energy cost of major materials in 2010. Source: Vaclav Smil. 2013. Making the Modern World: Materials and Dematerialization. Wiley.

Excerpts from the Lambert and Hall (2014) paper follow.

Alice Friedemann  www.energyskeptic.com Women in ecology  author of 2021 Life After Fossil Fuels: A Reality Check on Alternative Energy best price here; 2015 When Trucks Stop Running: Energy and the Future of Transportation”, Barriers to Making Algal Biofuels, & “Crunch! Whole Grain Artisan Chips and Crackers”.  Podcasts: Crazy Town, Collapse Chronicles, Derrick Jensen, Practical Prepping, KunstlerCast 253, KunstlerCast278, Peak Prosperity

***

Lambert, Jessica G., Hall Charles A. S. et al. 2014. Energy, EROI and quality of life. Energy Policy 64:153–167

societys hierarchy of energetic needs eroi 12-14


Fig. 12. “Pyramid of Energetic Needs” representing the minimum EROI required for conventional oil, at the well-head, to be able to perform various tasks required for civilization. The blue values are published values, the yellow values increasingly speculative. Each increment in EROI allows more and more work to be done. EROI chart from “EROI of Global Energy Resources Preliminary Status and Trends” Jessica Lambert, Charles Hall, Steve Balogh, Alex Poisson, and Ajay Gupta State University of New York, College of Environmental Science and Forestry

Abstract.  The near- and long-term societal effects of declining EROI are uncertain, but probably adverse.  To evaluate the possible linkages between societal well-being and net energy availability, we compare these preliminary estimates of energy availability: (1) EROI at a societal level, (2) energy use per capita, (3) multiple regression analyses and (4) a new composite energy index (Lambert Energy Index), to select indicators of quality of life (HDI, percent children under weight, health expenditures, Gender Inequality Index, literacy rate and access to improved water). Our results suggest that energy indices are highly correlated with a higher standard of living.

1. Introduction

Humans, as well as our complex societies, require food energy and now massive amounts of external energy to survive and reproduce. For all organisms it is the net energy, or the energy available to an organism or a society after investments to obtain that energy, that is important, indeed that may be the most important factor in determining the long-term survival and wellbeing of humans and society. The history of human cultural advancement can be examined from the perspective of the development of energy resources and the evolution of energy conversion technologies. Energy provided by the burning of fossil fuels has fostered the expansion of economic, social and environmental development. The availability of energy and the increased efficacy with which it is used has enabled humans to enhance their comfort, live longer and increase their numbers.

Because energy is used directly and indirectly in the production of all goods and services, energy prices have a significant impact on nearly every facet of economic performance. Economic analyses indicate that decline in the rate of increase in energy availability is likely to have serious effects. There is a strong correlation between per capita energy use and social indicators such as the UN’s Human Development Index.

1. 1. Quality of energy. The quality of a unit of energy is the usefulness of that energy unit to society. The amount of work that can be performed by an available unit of energy (not used directly or indirectly in the acquisition of the next unit of energy) influences the perception of quality but is not the only factor in ascertaining that unit of energy’s usefulness. For example, hydropower creates electricity that has greater economic utility than a similar amount of heat energy. However, electricity is less useful for smelting ore as it would need to be translated into thermal energy for this task and would lose a good deal of its special properties in this process. Energy return on investment (EROI) is one measure for establishing the quality,

We use EROI as a gauge of the effectiveness of human activity intended to satisfy fundamental physical needs, assist in achieving a sense of mental and psychological well-being, and accomplish the higher aspirations associated with the best of what the human species has to offer. Studies of early human culture suggest that hunter gatherers have a relatively large energy surplus (i.e. an EROI of 10:1), which allowed them to spend a great deal of time in leisure activities. Just as with the !Kung, the larger the surplus, i.e. the higher the EROI, the greater the societal welfare that can be generated. Hence the higher the EROI of a society, the greater the contributions possible to quality of life.

Anthropologist White (1959) was among the first to recognize the importance of surplus energy for art, culture, progress and indeed all the trappings of modern civilization.

Modern humans invest their own energy plus an enormously larger quantity of fossil fuel to produce food, to generate leisure and to do the plethora of activities and attributes we associate with modern society. Whether increased GDP is required is implicit but not proven: one can imagine a causative chain: higher EROI –> higher GDP –> higher social well-being.

An economy without sufficient domestic fuels of a type that it needs, such as oil for transport, must import these fuels and pay for them using an externally-accepted currency via some kind of surplus economic activity. This is especially the case if and as the nation develops industrially. Oil is usually the fuel of choice. The ability to purchase the oil used to maintain or grow an economy depends upon what an economy can generate to sell to the world, the oil required to grow or produce those products and their relative prices. Assume an economy that depends 100% on imported oil (e.g. for agriculture and transportation).

Costa Rica is an example. It has no domestic fossil fuels (although considerable hydroelectric power) but has a fairly energy-intensive economy, and to a large degree pays for its imported oil with exported agricultural products e.g. bananas and coffee. These are commodities highly valued in the world and hence readily sold. They are also quite energy-intensive to produce, especially when produced of the quality that sells in rich countries. Costa Rica’s bananas require an amount of money equivalent to about half of their dockside purchase price to pay for the oil and petrochemicals required for their production and cosmetic quality. These production expenses consume a large portion of the economic “surplus” necessary to generate hard currency to pay for imported petroleum.

1.4. EROI and the net energy cliff

Fig. 1 below illustrates the possible distribution of energy employed to produce energy (light grey) and the outcome of this process, the energy available to society (dark grey) for various fuel sources ranked according to their EROI values. As EROI approaches 1:1 the ratio of the energy gained (dark gray) to the energy used (light gray) from various energy sources decreases exponentially. High EROI fuels allow a greater proportion of that fuel’s energy to be delivered to society, e.g. a fuel with an EROI of 100:1 (horizontal axis) will deliver 99% of the useful energy (vertical axis) from that fuel to society. Conversely, lower EROI fuels delivers substantially less useful energy to society (e.g. a fuel with an EROI of 2:1 will deliver only 50% of the energy from that fuel to society). Therefore, large shifts in high EROI values (e.g. from 100 to 50:1) may have little or no impact on society while small variations in low EROI values (e.g. from 5 to 2.5:1) may have a far greater and potentially more “negative” impact on society.

Fig. 1. The “Net Energy Cliff”


The oil, gas and coal that dominate energy use today probably had EROI values greater than 30:1 to 100:1 in the past. Therefore, we did not need to be concerned with their EROIs or the potential political, economic and social ramifications of decreasing EROI values. Recently, we have become aware that the EROI and hence the amount of net energy available to society are in a general decline as the highest grade fossil fuel deposits are depleted .

“New” energy sources must be sufficiently abundant and have a large enough EROI value to power society, or much more time, effort, and attention must be paid to securing the next year’s supply of energy, leaving less money, energy, and labor available for discretionary purposes. The general decline in EROI for our most important fuels implies that depletion is a more powerful force than technological innovation

Carbon capture and sequestration (CCS) and the use of hydrogen fuel cells are topics of interest to the energy community but are not considered within this discussion as neither are methods of source energy production.

If the EROI values of traditional fossil fuel energy sources (e.g. oil) continue to decline and non-conventional energy resources fail to provide sufficient quantities of high EROI alternatives, we may be moving toward the “net energy cliff.” If EROI continues to decline over time, the surplus wealth that is used to perform valuable but perhaps less essential activities in a society (e.g. higher education, the arts, technologically advanced health care, etc.) will probably decline. Given this, we believe that declining EROI will play an increasingly important role in our future economy and quality of life.

1. 5. Quality of life indices. We hypothesize that access to cheap and abundant fuel is related to an individual’s and a society’s ability to attain a “higher quality of life, using some commonly used indicators of a society’s performance—the Human Development Index (HDI), percent of children under weight, average health expenditures per capita, percent of female literacy, Gender Inequality Index (GII), and improved access to clean water for rural communities. These values impart an array of environmental and social features that assist in defining the “quality of life” of the citizens of a nation.

The human development index (HDI) is a commonly used composite index of well-being and is calculated using four measures of societal well-being: life expectancy at birth, adult literacy, combined educational enrollment, and per capita GDP. It has a possible range of 0 to 1. The world’s most affluent countries in 2009 had HDI values above 0.7; these include Norway (.876), with the highest value, followed by Australia (.864), Sweden (.824), the Netherlands (.818), and Germany (.814). The lowest HDI values, below.35, tend to belong to the world’s least affluent countries (e.g. Ethiopia (.216), Malawi (.261), Mozambique (.155)).

Some scientists believe that energy scarcity is associated with constrained food production, poverty, limited production and conveyance of essential goods and services, and also generates strain on other limited environmental resources.

Results: Energy availability and quality of life

We find that many indices of human social well-being are well correlated with indices of energy availability and, as expected, GDP per capita. We also find that these quality of life indices are as well correlated with a composite index of energy use and distribution. Hence it appears that the quantity, quality and distribution of energy are key issues that influence quality of life.

3. 4. EROI for imported oil for developing countries. Developing nations, defined in this paper as those with an EROISOC of 20:1 or less, are also countries characterized as having high, and sometimes very high, population growth rates. As these populations grow and as the bulk of these people become increasingly located within cities, the task of feeding these urban dwellers becomes impossible without industrialized agriculture. Agricultural products, grown with high yield, tend to be especially energy-intensive whether grown for internal consumption or for export.

In addition, most of these emergent countries are developing their industries; exportation of agricultural and industrial products is often how they obtain foreign exchange to obtain needed industrial inputs. In general, as the GDP of a developing nation increases so does its energy use (or perhaps the converse). Consequently, for these and many other reasons fuel use in developing nations tends to increase rapidly. Most developing countries, however, do not have their own energy supplies, especially oil, which is needed to run their economic machine.

The implications for all nations

Traditionally, economists have viewed quality of life indices as a consequence of economic input and well-being. However we find that EROISOC and per capita energy use are as strong a statistical predictor as traditional economic indices. Both energy per capita and EROISOC are independent measures of the influence of energy availability on the ability of an economy to do work, which includes the generation of economic well-being and “quality of life.

The process of developing fuel-intensive domestic industries to generate exports has worked reasonably well for many developing nations in the past when the price of oil was low compared to the prices of exports. However, the trends suggested by our data imply that the increasing oil prices observed over the past decade, if they continue, will impact developing nations and their ability to produce goods substantially. When oil prices increase, these oil importing nations are “stuck” with the industrial investments that the people of that nation have become dependent upon. For a nation without domestic sources of fossil fuels, an environment of rising imported energy prices relative to price of exports obligates that nation to dedicate more and more of its production (and therefore energy use) to obtain the next unit of energy needed to run the economy. Large and increasing populations, mechanized agriculture and industrialization all are making developing nations increasingly dependent on foreign fuels. When the ratio of the price of oil to exports is low, times are good. When, inevitably, the relative price of oil increases things become much tougher. Once a developing nation steps on to this “fossil fuel treadmill,” it becomes difficult to step off. If the price of oil continues to increase and hence the EROIIO declines, this is likely to correspond to lower quality of life indices for the citizens of these nations. Specifically, health expenditures per capita, HDI and GII are likely to decline.

Certainly history is littered with cities and entire civilizations that could not maintain a sufficient net energy flow, showing us that certain thresholds of surplus energy must be met in order for a society to exist and flourish. As a civilization flourishes and grows it tends to generate more and more infrastructure which requires additional flows of energy for its maintenance metabolism. The concept of a hierarchy of “energetic needs” required for the maintenance and perhaps growth of a typical “western” society is somewhat analogous to Maslow’s “pyramid of (human) needs”. Humans must first meet their physiological and reproductive needs and then progressively less immediate but still important psychological needs. Like Maslow’s vision of a system of human hierarchical needs, a society’s energy needs are hierarchically structured. In this theory, needs perceived as “lower” in the hierarchy, e.g. extraction and refining of fossil fuels, must be satisfied before needs “higher” in the hierarchy become important at a societal level. For example, the need to first extract and then refine fuels must be met in order to meet the need for transport of that energy to its point of use. In Western society, the energy required to e.g. grow and transport sufficient food cannot be met without first fulfilling these first 3 needs (i.e. extraction, refining and transport of those fuels to their point of use). Energy for the support required for the maintenance of a family, the provision of basic education for the next generation of citizens, and healthcare for all citizens follows the hierarchical structure; each progressive level of energy needs requires a higher EROI and must be fulfilled before the next can be met. Discretionary use of energy e.g. the performing arts and other social amenities can be perceived as a societal energetic necessity only once all levels beneath this are fulfilled. The rating of importance of “the arts” probably is related to the socio-economic position that individuals or societal groups hold and may be operative only for those at the top of that society. A society’s pyramidal hierarchy of energetic needs represents the relative importance of various components of a society, ranked by importance to human survival and well-being, and the quality of energy devoted to the production and maintenance of infrastructure required to support those components of society. The specific and concrete nature of the lower levels may appear increasingly obscure and ambiguous to those at “higher” levels but is absolutely essential for their support.

As we use up our best fossil fuels and the EROI of traditional fossil fuels continues to decline countries with currently high EROISOC and energy use per capita values may find themselves in a deteriorating position, one with lower EROI SOC and energy use per capita. Policy decisions that focus on improving energy infrastructure, energy efficiency and provide additional non-fossil fuel energy sources (e.g. nuclear) within these nations may stem the tide of declining energy quality.

Most alternatives to oil have a very low EROI and are not likely to generate as much net economic or social benefit. Improving the efficiency at which their economies convert energy (and materials) into marketable goods and services is one means of improving energy security.

There is evidence too that once payments for energy rise above a certain threshold at the national level (e.g. approximately 10 percent in the United States) that economic recessions follow.

References

Brandt, Adam R., Yuchi Sun, Sharad Bharadwaj, David Livingston, Eugene Tan, and Deborah Gordon. 2015. Energy Return on Investment (EROI) for Forty Global Oilfields Using a Detailed Engineering-Based Model of Oil Production. PLOS ONE 10(12): e0144141.

Gagnon, Nathan, Charles A.S. Hall, and Lysle Brinker. 2009. A Preliminary Investigation of Energy Return on Energy Investment for Global Oil and Gas Production. Energies 2(3): 490– 503.

Hall, C.A.S. 2011. Introduction to special issue: Sustainability: special issue on EROI. pp 1773-1777 (also see Hall’s new book: 2017. Energy Return on Investment: A Unifying Principle for Biology, Economics, and Sustainability. Springer.)

Jancovici, Jean-Marc. 2013. A Couple of Thoughts in the Energy Transition. Manicore. http:// www.manicore.com/anglais/documentation_a/transition_energy.html

Murphy, David J., and Charles A.S. Hall. 2011. Energy Return on Investment, Peak Oil, and the End of Economic Growth. Annals of the New York Academy of Sciences 1219(1): 52–72.

Murphy, David J. 2014. The Implications of the Declining Energy Return on Investment of Oil Production. Philosophical Transactions of the Royal Society of London A: Mathematical, Physical and Engineering Sciences 372(2006): 20130126.

Posted in Charles A. S. Hall, EROEI Energy Returned on Energy Invested | Tagged , , , | Comments Off on How much net energy return required to prevent collapse?

Will perovskite solar cells ever work out?

Van Noorden, R. September 24, 2014. Cheap solar cells tempt businesses. Nature #513 470-471.

[Excerpts. Of interest because rarely do obstacles get mentioned in the news. Most are optimistic hype making it sound like a solution to the energy crisis is just around the corner. And forget that electricity does not solve our main problem — heavy-duty trucks, locomotives, and ships run on diesel fuel — not electricity. Batteries for heavy-duty transport vehicles are so large the vehicle would barely move, and overhead lines are not practical over millions of acres of farmland, or other off-road logging-trucks, mining trucks, etc., nor could wires be strung over 4 million miles of roads, requiring trucks to have yet another power system after getting off the wires to get to their destination, which doubles the price of the truck].

Large, commercial silicon modules convert 17–25% of solar radiation into electricity, and much smaller perovskite cells have already reached a widely reproduced rate of 16–18% in the lab — occasionally spiking higher.

The cells, composed of perovskite film sandwiched between conducting layers, are still about the size of postage stamps. Seok says that he has achieved 12% efficiency with 10 small cells wired together.

Six reasons why perovskite cells might not be The Next  Big Thing:

  1. To be practical, they must be scaled up, which causes efficiency to drop.
  2. Doubts remain over whether the materials can survive for years when exposed to conditions outside the lab, such as humidity, temperature fluctuations and ultraviolet light.
  3. Researchers have also reported that ions inside some perovskite structures might shift positions in response to cycles of light and dark, potentially degrading performance.
  4. The need for complex engineering might create another setback, says Arthur Nozik, a chemist at the University of Colorado Boulder. After plummeting in past years, the price of crystalline silicon modules — which make up 90% of the solar-cell market — has leveled off but is expected to keep falling slowly. As a result, most of the cost of today’s photovoltaic systems is not in the material itself, but in the protective glass and wiring, racking, cabling and engineering work.
  5. When all these costs are factored in, perov­skites might save money only if they can overtake silicon in efficiency. In the short term, firms are focusing on depositing the films on silicon wafers, with the perovskites tuned to capture wavelengths of light that silicon does not. On 10 September, Oxford PV announced that it was working with companies to make prototypes of these ‘tandem’ cells by 2015, and that this could boost silicon solar cells’ efficiencies by one-fifth, so that they approach 30%. Malinkiewicz’s hope is to find a niche that silicon cannot fill: ultra-cheap, flexible solar cells that might not last for years, but could be rolled out on roof tiles, or used as a portable back-up power source.
  6. There is another potential snag: perovskites contain a small amount of toxic lead, in a form that would be soluble in any water leaching through the cells’ protection. Although Snaith and others have made films with tin instead, the efficiency of these cells is only just above 6%.


Posted in Photovoltaic Solar | Tagged , , | 1 Comment