 Preface. There have been two oil shockwave “oil crisis stimulations”, summaries of both from 2005 and 2007 are below. Oil Shockwaves confront a mock U.S. cabinet with highly plausible geopolitical crises that trigger sharp increases in oil prices. Participants must grapple with the economic and strategic consequences of this ‘oil shock’ and formulate a response plan for the nation.” In 2007 some of the participants were Robert Rubin, former secretary of the Treasury, Carol Browner (former head of the EPA), Richard Armitage former deputy secretary of state, Retired General Abizaid, John Lehman, former secretary of the Navy, Gene Sperling former national economic advisor, Philip D. Zelikow executive director of the 9/11 commission, and Daniel Yergin.
Here are a few good points before the longer versions of these exercises:
ADMIRAL DENNIS BLAIR, USN (RET.), Former Commander in Chief, U.S. PACIFIC COMMAND
I spent more than three decades in the U.S. Navy…[where] my driving imperative was to protect the blood and treasure of the American people. When I look at the dangers facing the country now, it is impossible to ignore the looming and worsening menace of oil dependence. Senior officers throughout the military share this concern. They know that increasing dependence on overseas oil is putting a strain on U.S. military forces and saddling them with costly missions for which they were not designed. The use of large scale military force in volatile regions of underdeveloped countries is difficult to do right, has major unintended consequences and rarely turns out to be quick, effective, controlled and short lived.
No amount of military force can alter the fundamentals of oil dependence. Oil is the life-blood of our economy. … In the event of an oil crisis, the economic consequences will be severe, and they will impact hundreds of millions of average Americans.
America’s oil dependence threatens the prosperity and safety of the nation. The President and Congress must immediately implement a long-term strategy for reducing America’s oil dependence. All Americans must become more aware of the dangers of oil dependence and more involved in efforts to address this vulnerability.
Despite the promise of alternatives, America cannot hope to grow enough biofuels to obviate the need for improved fuel economy. Nor can we expect to derive security from vague promises of leap-ahead technologies.
I have talked to the car companies, and they say that the American people do not want more efficient cars; they want more powerful cars with more cup holders, so therefore, we have to give it to them. I do not have a lot of sympathy for these car companies, because the price of that oil that we are using does not reflect the full price of the American troops who are doing all of this business around the world. If you factored in the real price of that oil, it would be huge, and frankly, I am sorry. It is not up to the car companies to make that judgment. It is up to the leaders of the American people to make that judgment.
EDWARD J. MARKEY, MASSACHUSETTS, CHAIRMAN. Forty-five percent of the world’s oil is located in Iraq, Iran, and Saudi Arabia; and almost two-thirds of known oil reserves are in the Middle East….each day carries with it the possibility of major oil supply disruptions, leading to economic recession and political or military unrest. [America spends $5 billion a week on oil, funds which] end up in the pockets of Arab princes and potentates who then funnel the money to al Qaeda, Hezbollah, Hamas and other terrorist groups. With that kind of money at stake, it is no coincidence that we have 165,000 young men and women in Iraq right now, and it is no surprise that much of our foreign policy capital also happens to be spent in the Middle East.
The single biggest step we can take to curb our oil dependence and remove OPEC’s leverage is to raise the fuel economy standards of our automotive fleet. ..and require the President to adopt a nationwide oil savings plan that will achieve a total savings of 10 million barrels of oil per day by 2031.
EMANUAL CLEAVER, MISSOURI. … if things go further awry, Pakistan could completely destabilize the Middle East in ways that Iraq never could. … it occurred to me that, even in the midst of all of these developments in the Middle East, that we are not, even after the Al Gore film and all of the discussions, we are not retreating from our appetite for oil…. You know, we talk about it, and then we just continue to splurge. This is chilling.
Carole BROWNER, former administrator at the EPA. The role that I was assigned [in the Oil SchockWave scenario] was Secretary of Energy. In this position I was supposed to suggest a series of short-term steps that could be taken by the American public to reduce oil use. [So] I said we could impose a 55-mile per hour speed limit, which would save 134,000 to 250,000 barrels of oil a day, year-round daylight savings time to save 3,000 barrels per day, and a Sunday driving ban to save 475,000 barrels of oil per day. The other Cabinet members rejected these ideas. They did not think they would be acceptable to the American people. [Another] debate unfolded when I said we should access the Strategic Petroleum Reserve (SPR). That got complicated in a hurry, because the Secretary of Defense said [the SPR] was the Navy’s. So suddenly we couldn’t find common ground on whether or not to take advantage of the SPR. The individuals representing the Department of State and Department of Defense also raised the issue of whether or not the military gets the first rights to the SPR, as opposed to the American people. And the concern they were focused on was, with growing unrest in the world in this scenario, would they have to deploy additional troops and therefore be in need of additional oil and should they get a first call on it?
JOHN J. HALL, NEW YORK. It seems to me like we are going down a road where citizens of the United States, have never understood what it is like to be in a position like Brazil was in in the 1970s, for instance, where the world financial markets dictated to them certain things they had to do or else they would not get their next round of debt floated. So I think we need to be aware of that, that oil and our consumption of oil, is putting us in that position.
Alice Friedemann www.energyskeptic.com Author of Life After Fossil Fuels: A Reality Check on Alternative Energy; When Trucks Stop Running: Energy and the Future of Transportation”, Barriers to Making Algal Biofuels, & “Crunch! Whole Grain Artisan Chips and Crackers”. Women in ecology Podcasts: WGBH, Planet: Critical, Crazy Town, Collapse Chronicles, Derrick Jensen, Practical Prepping, Kunstler 253 &278, Peak Prosperity, Index of best energyskeptic posts
***
NCEP (2005) Oil Shockwave. Oil Crisis executive simulation. National Commission on Energy Policy
Nine former White House cabinet and senior national security officials convened to advise an American president as the nation grapples with an oil crisis over a seven-month period, including Robert M. Gates, former director of CIA and R. James Woolsey, former director of CIA
Summary: High concentrations of oil in unstable and undemocratic regions, rapidly growing global demand, low spare production capacity, and a significant likelihood of future supply disruptions due to terrorism, political unrest, or other factors, all but guarantee continued price volatility and pose a growing threat to the U.S. and world economy and to our national security. Addressing this vulnerability constitutes one of the preeminent energy, economic, and national security challenges of our time. We must act now.
Key Findings
- A change in supply or demand of oil anywhere will affect prices everywhere.
- Given today’s precarious balance between oil supply and demand, taking even a small amount of oil off the market could cause prices to rise dramatically. In Oil ShockWave, a roughly 4 percent global shortfall in daily supply results in a 177 percent increase in the price of oil (from $58 to $161 per barrel).
- Oil price shocks of this magnitude could do significant damage to the U.S. economy. In Oil ShockWave, the economy goes into recession and there are millions of fewer jobs as a result of sustained higher oil prices.
- U.S. foreign and military policy is influenced and often constrained by our oil dependence. Military options offer little recourse in the event of a supply crisis. Oil ShockWave participants repeatedly found that military intervention was not only unfeasible given existing U.S. commitments, but unlikely to be effective in responding to the scenarios they confronted, even when requested by a host government.
- The U.S. is vulnerable to attacks on key energy infrastructure both at home and abroad. Because this energy infrastructure is simply too vast to protect, we must reduce demand, develop petroleum alternatives, and promote fuel diversity.
- Political unrest and the associated risky investment conditions in key oil producing countries may pose a greater threat to the long-term stability of world oil markets than terrorism.
- America’s Strategic Petroleum Reserve (SPR) offers some protection against a major supply disruption, but that protection is limited in both scope and duration. Emergency reserves cannot sustain the U.S. through a prolonged crisis. In addition, Oil ShockWave revealed that it is extremely difficult to reach consensus on when it is appropriate to use the SPR.
- Global oil markets are currently dependent on Saudi Arabia’s ability to serve as supplier of last resort to offset demand increases or supply shortfalls elsewhere. Given existing terrorist threats and political tensions in Saudi Arabia, this situation creates significant and potentially damaging global vulnerabilities
- Once oil supply disruptions occur, short-term options for protecting the U.S. economy—like tapping the SPR and implementing emergency demand measures—are limited. In addition, these options are generally not sustainable for more than a few months to a year.
- The challenge is to act now to develop long-term policies and to create more effective options for managing the medium-term impacts—years 2 through 10—of a major oil crisis.
Where we Stand Today
The transport sector alone relies on oil for 97% of its energy needs and accounts for 68% of overall U.S. oil demand. Because the transport sector remains nearly wholly dependent on oil, consumers cannot quickly reduce consumption in response to higher prices.
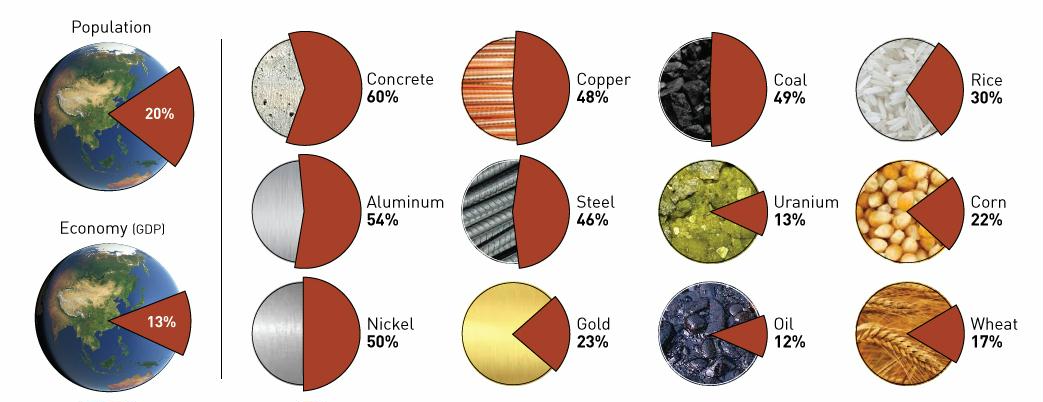
The U.S. is the world’s largest consumer of oil. It accounts for 25% of global daily consumption1, but holds less than 3% of the world’s proved oil reserves. The Middle East, by contrast, holds between 57 and 65 percent of the world’s proved oil reserves.
Oil production in the U.S. has been in gradual decline since 1970 and this decline is projected to continue. At the same time, oil imports have increased steadily and now account for 58 percent of total U.S. consumption. This trend is also expected to continue.
U.S. and world demand for oil are expected to increase substantially over the next 10 to 20 years. Demand in the U.S. is expected to grow by 40 percent—from 20 million barrels per day [mbd] to 28 mbd—between 2002 and 2025. World demand is projected to increase even more substantially, by more than 50 percent—from 78 mbd to 120 mbd—over the same period.
The world will increasingly rely on opec nations, particularly Saudi Arabia, to supply the oil needed to meet future demand. The federal Energy Information Administration (eia) projects Middle East opec production to increase from 21 mbd in 2003 to 38 mbd by 2025 (an 81 percent increase)
Demand growth is likely to be especially strong in developing countries, notably China and India. This growth is already having an effect on world oil markets, where the price per barrel has more than doubled between 2003 and 2005.
House 110-19. November 7, 2007. Oil Shock: Potential for Crisis. U.S. House of Representatives.
ADMIRAL DENNIS BLAIR, USN (RET.), FORMER COMMANDER IN CHIEF, U.S. PACIFIC COMMAND
On November 1, in partnership with the Bipartisan Policy Center, SAFE conducted Oil ShockWave, an executive crisis simulation developed over the last two years to illustrate the strategic dangers of oil dependence. Oil Shockwave confronts a mock U.S. cabinet with highly plausible geopolitical crises that trigger sharp increases in oil prices. Participants must grapple with the economic and strategic consequences of this ‘oil shock’ and formulate a response plan for the nation.
I want to stress that ShockWave is not a prediction of the future. It is a simulation that demonstrates how an oil crisis could develop. But the scenario is based on facts—and dangers—that are already exist today. Designed by finance, energy, industry, and national security experts, Oil ShockWave cannot be dismissed as sensationalism. The scenario that was played out last week involved violence and unrest in Azerbaijan and Nigeria along with worsening diplomatic relations with Iran. Though set in 2009, these events could have been ripped from today’s headlines.
Last week’s event featured former Treasury Secretary Robert E. Rubin, former Deputy Secretary of State Richard L. Armitage, former CENTCOM Commander General John P. Abizaid (U.S. Army, Ret.), former Secretary of the United States Navy and 9/11 Commission Member John F. Lehman, former White House Press Secretary Mike McCurry, former National Economic Advisor Gene Sperling, former EPA Administrator Carol Browner, 9/11 Commission Executive Director Dr. Philip D. Zelikow, and Pulitzer Prize-winning author Daniel Yergin.
Let me give you a brief synopsis of Oil ShockWave. In May of 2009, violence in the Baku, the capital of Azerbaijan, disrupts a major oil pipeline carrying about 1 million barrels per day to the Turkish Mediterranean port of Ceyhan. With spare capacity lacking, markets fear a supply crunch if the pipeline remains out of action. The news causes about a 12% spike in oil prices in a single day. Shortly thereafter, unrest in the Niger delta of Africa cuts off an additional increment of oil production. Iranian events compound these problems in subsequent weeks. Faced with the prospect of harsh economic sanctions from the U.S. and the European Union (EU), Iran announces that it will immediately reduce its oil exports by 350,000 barrels per day, and that further reductions are possible unless the U.S. and EU abandon the sanctions process. The move reduces spare capacity below half-a-million barrels per day. Oil prices spike to $145. When Venezuela announces it will join Iran by matching its production cut, oil prices climb to $160. The whole simulation covers four months. By the end of Oil ShockWave, events have disrupted 1% of world oil production—hardly an inconceivable shortfall given the threats directed at the world’s far-flung oil production and distribution network. As for the geopolitical and economic impacts, they, too, were vetted by experts for realism, but that doesn’t make them any less frightening: oil prices reach $160 per barrel. Gas prices soar to over $5.00 per gallon. Double-digit inflation ensues, and the U.S. and world economies teeter on the edge of recession.
I spent more than three decades in the U.S. Navy. My missions changed but my motivation never did; my driving imperative was to protect the blood and treasure of the American people. When I look at the dangers facing the country now, it is impossible to ignore the looming and worsening menace of oil dependence. Senior officers throughout the military share this concern. They know that increasing dependence on overseas oil is putting a strain on U.S. military forces and saddling them with costly missions for which they were not designed.
The use of large scale military force in volatile regions of underdeveloped countries is difficult to do right, has major unintended consequences and rarely turns out to be quick, effective, controlled and short lived.
The Persian Gulf is just about on the other side of the world from the United States. It takes more than 3 ships in the U.S. Navy to keep one ship on station: one there, one going, one coming. Pretty much the same ratio holds for airplanes and, as we are learning in Iraq, for soldiers and Marines. You just got back, you’re there or you’re getting ready to go again. A major military presence in the Gulf region raises local resentments and dangers that work against what the U.S. is trying to achieve. This is not just a post-9/11 phenomenon. It was true well before 9/11 in terms of the effect of major U.S. military forces staged or spending large amounts of time in the Gulf region. So after all this major military effort, what’s the bottom line? Gas is pushing $3 a gallon, we’re extending the tours of soldiers in the Gulf region to 15 months, and we’re more subject to events in the Persian Gulf than we ever were in the past.
Now, why has American security policy developed in this way? The fast pace of operations in the region has given little pause for reflecting on overall trends and effectiveness. American forces have been engaged in the Middle East since the tanker wars of 1987, and events have seemed to demand increasing our military force, not reducing it. But driving this engagement is America’s ever growing dependence on petroleum. This dependence has influenced successive administrations to strengthen military engagement rather than to search for other means—perhaps politically more difficult but in the long run more cost-effective means—for boosting energy security.
No amount of military force can alter the fundamentals of oil dependence. Oil is the life-blood of our economy. We consume more than 20 million barrels of oil per day, a quarter of the world total. More than 60% of the oil we use is imported. Nearly 70% of our oil consumption goes toward transportation, which relies on oil-based fuels for 97% of its delivered energy. In the event of an oil crisis, the economic consequences will be severe, and they will impact hundreds of millions of average Americans. It was this state of affairs that caused me to join the Energy Security Leadership Council, a group of business leaders and retired senior military commanders who are committed to reducing U.S. oil dependence in order to improve national security and strengthen the economy. The Council was organized by Securing America’s Future Energy, or SAFE, a non-partisan group that is educating the public about the nation’s current state of energy insecurity.
Lessons of Oil ShockWave
- There is really no such thing as ‘foreign oil.’ Oil is a fungible global commodity. Thus, a change in supply or demand anywhere will affect prices everywhere.
- Oil markets are currently precariously balanced. As a result, even small disruptions can have dramatic effects. This means that a supply shortfall of approximately 1% could cause prices to surge.
- The price of crude oil may rise quickly as a result of a supply shock, especially when spare capacity is tight. It will not necessarily take much time to go from $90 to $160.
- Once oil supply disruptions occur, little can be done in the short term to protect the U.S. economy from its impacts. There are few good short-term solutions. For instance, efforts to restrict America’s driving habits through speed limits or bans on driving raise difficult questions about enforcement and, even if successful, their impact would be limited. As Oil ShockWave makes clear, such measures would be at odds with political calculations that are seemingly ever-present in today’s highly partisan Washington atmosphere.
- There are a number of supply-side and demand-side policy options available that would significantly improve U.S. oil security. Stronger fuel-economy standards, increased domestic oil production, and responsible development of alternative fuels and infrastructure are the most effective steps we can take, but their impact will not be felt for at least a decade.
- Foreign policy and military responses are limited, because oil dependence is major constraint on strategic flexibility. This is true for the U.S. and even more so for many of our major allies.
- The Strategic Petroleum Reserve (SPR), the emergency supply of federally owned crude oil stored in underground salt caverns, offers only limited protection against a major supply disruption. The ShockWave cabinet had to be concerned that any announcement of a release of oil from the SPR could actually contribute to an increase in oil prices by sending the message that U.S. government was declaring the onset of a crisis. Also, the military leaders objected to using the SPR for domestic purposes, arguing that it should be kept in reserve for use by the armed forces.
- The stability of the entire oil-based global economy is currently dependent on Saudi Arabia’s ability to increase production dramatically and over a short timeframe. But Saudi spare capacity may be completely absorbed by surging oil demand from countries like China and India. If that happens (and many indicators point in this direction), the global oil market will be especially fragile.
At the conclusion of the simulation, former Treasury Secretary Robert E. Rubin credited Oil ShockWave with demonstrating “the critical importance of preventative action in mitigating the risks of oil dependence.” This is a vital lesson. If, or rather, when the U.S. is faced with the next oil crisis, there will be no easy answers. Short-term responses such as tapping the Strategic Petroleum Reserve or implementing emergency demand measures are likely to be insufficient. Long-term policy options such as improving fuel economy, boosting domestic oil production, and promoting alternative fuels will be years away unless we set them in motion today.
In conclusion, let me tie things back to the policy objectives of the Committee: improved security will require greater conservation as well as increased production of petroleum and alternatives here at home. If we put these measures in place before a crisis hits, we will be less susceptible to being whip-sawed by events. We will not have to be on a hair-trigger for major military involvements. And we will be in a much better position to break the cycle of increasing oil dependence followed by increased deployments of major U.S. forces into volatile and underdeveloped regions where they are often poorly matched to the mission of oil security.
Having witnessed the attacks of September 11, 2001, we know all too well the cost of failing to address national security threats on our own terms, rather than those of our enemies. America’s oil dependence threatens the prosperity and safety of the nation. Continued policy paralysis is unacceptable precisely because we can take action to improve our energy security.
The President and Congress must immediately implement a long-term strategy for reducing America’s oil dependence. This is a grave national and economic security issue that demands the attention of our leaders from both parties. And responsibility cannot stop there. All Americans must become more aware of the dangers of oil dependence and more involved in efforts to address this vulnerability.
Energy security cannot be purchased with easy answers. Despite the promise of alternatives, America cannot hope to grow enough biofuels to obviate the need for improved fuel economy. Nor can we expect to derive security from vague promises of leap-ahead technologies. A new consensus must be forged on the anvil of tough choices using proven policy solutions. To this end, both political parties must move beyond the half-measures that have long stalled the pursuit of real energy security.
To minimize oil dependence and its associated national security risks, both political parties must discard the dogmatic approaches that have long hampered the pursuit of energy security. Those who oppose further oil exploration in the United States must recognize that the failure to press forward with the environmentally responsible development of domestic energy resources exacerbates the dangers of oil dependence. Refusing to develop secure sources of domestic production leads to an unnecessary over-reliance on imported oil, much of which flows from less stable parts of the globe. Aside from amplifying the potential risk of a supply interruption, the preference for imported oil unnecessarily transfers billions of dollars of the nation’s wealth to foreign lands.
Those who oppose vehicle fuel-economy standards must accept that the free market has not—and will not—adequately motivate the investments necessary to protect the nation in the event of an oil crisis. As such, mandating improvements in the fuel economy of our cars and trucks is one critical and unavoidable step that Americans must take if we are to halt our national descent into unmitigated oil dependence.
Congress is now negotiating the contours of a national energy bill in conference. As that bill is finalized, it is important to stress a key point: reforming and strengthening the Corporate Average Fuel Economy (CAFE) system is the single most important step we can take to reduce oil dependence.
To its credit, the Senate has already approved a proposal dramatically improving fuel-economy regulations. Rather than maintaining the one-size-fits-all corporate average that hampers the existing CAFE system and burdens Detroit’s Big Three, the Senate voted in favor of flexible standards that will allow each automaker to maximize competitive advantages while ensuring steady increases in the fuel economy of the entire fleet of new vehicles. By raising the fleet-wide fuel economy of new cars and trucks to 35 mpg by 2020, these new standards could save the U.S. one million barrels of oil per day in just over a decade. That’s about the same as the oil shortfall that was involved in the Oil ShockWave simulation. Oil savings would continue to rise after 2020, perhaps reaching three million barrels per day by 2030. That would mean vastly increased energy security for our children and grandchildren. This Senate has put forth a sound legislative proposal that will boost energy security for decades to come. Furthermore, the President has already indicated support for reforming fuel-economy standards and increasing them by 4% per year, a rate that is actually faster than the one contained in the Senate’s proposal. It is time for Congress to approve a comprehensive and meaningful energy bill that the President can sign.
EDWARD J. MARKEY, MASSACHUSETTS, CHAIRMAN. Forty-five percent of the world’s oil is located in Iraq, Iran, and Saudi Arabia; and almost two-thirds of known oil reserves are in the Middle East.
Events in that part of the world have a dramatic impact on oil prices and on our national security. In the late 1970s, the oil embargo, Iranian revolution, and Iran/ Iraq war sent the price of oil skyrocketing.
Yesterday oil surged to a new record of $97 a barrel, amid government predictions of tightening domestic inventories, bombings in Afghanistan and an attack on a Yemeni pipeline that took 155,000 barrels of oil off the markets. And with al Qaeda threatening to attack Saudi Arabia’s oil, with our continuing struggles in Iraq, and with yesterday’s announcement that Iran now has 3,000 operating centrifuges for enriching uranium, each day carries with it the possibility of major oil supply disruptions, leading to economic recession and political or military unrest.
The United States currently imports more than 60% of its oil. Oil has gone up more than $70 a barrel in the last 6 years, from $26 a barrel in 2001. Each minute, the United States sends $500,000 abroad to pay for foreign oil imports. That is $30 million per hour, $5 billion per week. With the record prices of late, these figures will surely grow by year’s end. Much of these funds end up in the pockets of Arab princes and potentates who then funnel the money to al Qaeda, Hezbollah, Hamas and other terrorist groups.
With that kind of money at stake, it is no coincidence that we have 165,000 young men and women in Iraq right now, and it is no surprise that much of our foreign policy capital also happens to be spent in the Middle East.
Our energy policy has compromised our economic freedom, and the American people want action because they know that the price has become much too high.
Last week, a group of energy and military experts converged in Washington to conduct an energy security war game. But the truth is the scenario that unfolded didn’t really seem at all fictitious. Like today, the scenario began when oil prices had gone up to trade consistently in the $95 per barrel range. Like yesterday’s attack on the Yemeni pipeline, the first event leading to crisis involved an attack on the Baku pipeline. And also like today, Iran’s nuclear ambitions and U.S. efforts to contain them prove to be a complicated endeavor that requires us to maximize all of our diplomatic military and economic leverage.
The problem is, with oil, we have ALMOST NO leverage. The reality is that there are no good short-term options to help us deal with oil addiction. The United States is home to less than 3% of the world’s oil reserves. Sixty percent of the oil that we use each day comes from overseas.
Global oil production levels are at about 85 million barrels per day, with excess production capacity at only about 1.65 million barrels per day. Hurricane Katrina alone removed as much as 1.4 million barrels per day from supplies. The Strategic Petroleum Reserve has just over a month’s worth of oil in it.
The single biggest step we can take to curb our oil dependence and remove OPEC’s leverage is to raise the fuel economy standards of our automotive fleet. ..and require the President to adopt a nationwide oil savings plan that will achieve a total savings of 10 million barrels of oil per day by 2031.
We have, however, at the same time, a piece of legislation which is now pending between the House and the Senate which has the potential to raise the fuel economy standard to 35 miles per gallon, would have 15% of our electricity produced from renewable electricity sources, and it would also use cellulosic fuels to substitute for oil which we could import. That bill should be finished if we can work hard on it between the House and the Senate over the next 4 weeks. I look forward to learning more about Oil Shockwave from our witnesses as well as their views about what Congress can do to address our energy security challenges.
EMANUAL CLEAVER, MISSOURI. It is difficult to follow up a powerful sermon like the one that was just delivered by Mr. Blumenauer, which I would say ‘‘amen’’ to what he just said. As I read this morning a number of newspapers, including Financial Times, about what is going on in Pakistan, I became alarmed. Not because Pakistan is a supplier of oil but because, if things go further awry, Pakistan could completely destabilize the Middle East in ways that Iraq never could. And thinking about what is going on in Iran and hopefully dealing with this concern internally, I could not help to think that conflict in Pakistan, if it ends up in some kind of civil war and if the tribal areas get weapons, there is no telling—or get more weapons, U.S. weapons, there is no telling what could happen. But it occurred to me that, even in the midst of all of these developments in the Middle East, that we are not, even after the Al Gore film and all of the discussions, we are not retreating from our appetite for oil. In 1980, the United States imported 27% of the oil it uses each day; and today we are importing 60% of the oil we use each day. So it is not like all of the awareness is creating some reaction. It is what Mr. Blumenauer said. You know, we talk about it, and then we just continue to go ahead. We continue to splurge. This is chilling.
CAROL P. BROWNER, Former Administrator of the Environmental Protection Agency . I appear today as a participant in the recent Oil Shockwave—Executive Oil Crisis Simulation. It is the second time I have done this. The value of Oil ShockWave was really quite significant because, as the Admiral said, what you quickly figure out is, even with all of this power behind you– the Secretary of Energy had huge amounts of power in this simulation, your choices in terms of immediate action are very, very narrow and even those choices immediately bump up with somebody else’s view of the world. The event was sponsored by Securing America’s Future Energy, SAFE, and the Bipartisan Policy Center; and it was designed to show the possible consequences of U.S. oil dependency and the ability of government officials to respond in the event of a global oil crisis. It was bipartisan in every way. The participants were divided between Democrats and Republicans, and the whole point is just, to the best of our ability, to demonstrate to the American people how a problem unfolds and how members of the President’s Council and senior staff might respond to that problem.
The Oil Shock exercise provides a number of important lessons for Congress. In the scenario that we did last week, three different things happened over a 3-month period. The year is 2009. It is past the election. There is no assumption in the scenario whether a Democrat or a Republican has won the election for President. Over a 3-month period, from May to August of 2009, the first thing that happens is that a pipeline in Azerbaijan is temporarily put out of service. The result of that is a loss of one million barrels of oil to the world’s market per day, and very quickly there is an upturn in prices. While this crisis is resolved in the course of the scenario, over the next 3 months, Nigeria takes 400,000 barrels a day off the market; and, in August, Iran and Venezuela cut their combined oil production by 700,000 barrels per day. So by the end of the simulation, the 3-month period, 1.1 million barrels of oil have been taken off the world market; and the price per barrel has shot up to over $160. I don’t think any of this is farfetched. Maybe not these precise things but certainly things like this could happen virtually any day.
The role that I was assigned was Secretary of Energy, and in this position I was supposed to suggest a series of short-term steps that could be taken by the American public to reduce oil use. For example, I said that we could impose a 55-mile per hour speed limit, which would save 134,000 to approximately 250,000 barrels of oil a day. We could implement year-round daylight savings time, which would save approximately 3,000 barrels per day. We could institute a Sunday driving ban, which would save about 475,000 barrels of oil per day. My colleagues in this event, other Cabinet members, rejected these ideas. They did not think they would be acceptable to the American people. Short-term energy conservation is frequently difficult, painful, and I think that was why the other participants in the scenario did not want to recommend to the fictional President that we take some of these steps.
That turned the discussion to whether or not we should access the Strategic Petroleum Reserve, which is under the auspices of the Secretary of Energy; and very quickly a debate ensued over two issues with respect to the SPR. The first was, what is the appropriate use of the SPR? Can you use it to manage price spikes or can you only use it for security matters? And, as Mr. Sensenbrenner pointed out, there are significant barrels there, but the truth of the matter not so significant that if this crisis had played out over a longer term that you could really answer the problem.
The second debate unfolded when I said we should access the Strategic Petroleum Reserve (SPR). That got complicated in a hurry, because the Secretary of Defense said [the SPR] was the Navy’s. So suddenly we couldn’t find common ground on whether or not to take advantage of the SPR. The individuals representing the Department of State and Department of Defense also raised the issue of whether or not the military gets the first rights to the SPR, as opposed to the American people. And the concern they were focused on was, with growing unrest in the world in this scenario, would they have to deploy additional troops and therefore be in need of additional oil and should they get a first call on it?
I think the real lesson of oil shock and one that we seem, unfortunately, hard-pressed to learn is the need to think ahead, to make real and lasting commitments to a new approach, rather than wait to respond once we are in the thick of it.
As I look at the scenario and move into the issues that confront you as a committee today and the House and the Senate at large, I think the single most important thing would be to embrace CAFE. If there had been a CAFE standards such as being considered and passed by the Senate in effect during this scenario we would not have experienced the kind of problems, potentially could—would not have experienced the kind of problems that were unfolding in the scenario. The Senate CAFE proposal, if adopted this year, would result in an oil savings of 1.2 million barrels per day by 2020.
Let me again note this is the second time I have participated in this scenario. I think I was the only person that participated both times, and the lesson was the same. We need to get going. There are things we can be doing today to try and reduce our dependence. CAFE is certainly not the only thing, but I personally think it is an incredibly important thing.
The other thing I would add is that the scenario did not take global warming into account. As the Secretary of Energy, I tried to insert it into the discussion, but the focus, because it was such an immediate concern, always turned back to where do we get more oil quickly, what do we need to do to solve the problem? It is absolutely essential that we think about what some of the alternatives may mean in terms of greenhouse gas emissions, in terms of our carbon footprint, in terms of how much more difficult do we make the task of reducing greenhouse gas emissions and carbon emissions.
Mr. SENSENBRENNER. What is the role of Canadian oil resources and oil shale in the West? I know that you can’t turn that spigot on as quickly as we would like, but if we are looking at ways to prevent an oil shock from being extremely severe, that seems to be the most convenient and secure way to get increased oil or replacement oil.
Admiral BLAIR. We saw that as part of the solution, but our understanding was the technology was not quite there. So we couldn’t count on that and that—but that the R&D should be put in to see if it is a viable alternative as an alternative source. Similarly, R&D should be put into other synthetic fuels in order to make them part of the solution.
Mr. CLEAVER, Missouri. One of the problems we have is that we live in a time in our country where everything is politicized. I am frustrated over how we have politicized global warming, how we politicized even the oil crisis. And so it is difficult for us to coalesce and move towards a solution. Because what we say and think reverberates across the land, and if you listen to radio and television talk shows, you can see what has happened. It is ugly out there. And rather than turn down the volume, we continue to turn it up. So this issue has already become muddy because of the way it is politicized. Do you have any suggestions on how we might be able to depoliticize the oil dependence issue or independence? Is there something you—some way you can suggest, say, can we write a song? Could we get Mr. Hall to write a hit song? I mean, what do we need to do?
Admiral BLAIR. An Admiral giving advice on politics is like a politician giving advice on maneuvering ships. But those of us on the Council thought that what is required here is a compromise between those who have opposed fuel efficiency standards on the grounds that it is interfering with business and those who have opposed further exploration and development of alternatives on the grounds that it runs environmental risks and it is not pretty to have an oil rig out the back door. What we strongly recommended a year ago was that in order to provide the political cover for everybody to do what everybody recognizes is in the national interest, is both sides have to give, and it has got to be a comprehensive package so that it is recognized that all participants are doing the right thing for the country. And even though they can be accused of making a compromise with something that they pushed in the past, it is in the common good. And that is really—it is naive. It is kind of civics 101. I am not a politician, but I think it is time that we have to give a little to do the right thing for everybody. So my answer to your question would be to, you know, both sides of that center chair need to give a little bit and let us do more conservation, let us do more domestic production, let us do more alternatives. We have taken polling data within the country, and the people recognize it. But it is getting that popular support shredded through the filter of individual interests into a bill, which you all know better than I do, is a hard part of this.
Ms. BROWNER. I think the simulation actually would be a way in which you might find some common ground. In the simulation we did, there were—three of us were noted Democrats. Everyone knew we were Democrats. There were three that were well-known Republicans. You would recognize them immediately as Republicans. And then there were some former military brass, and we are never sure what they are. They are very good about that. But what happened is we were unanimous in our takeaway from the experience. So it didn’t matter what our political persuasion was when we came to the scenario. Our experience of the scenario was a shared one, and what we thought needed to be done was remarkably similar across the party lines when we stepped out at the end and resumed our regular identities. So I think it could go a long ways to perhaps bridging some of the gaps that inevitably exist as you all wrestle with important legislation. And if that doesn’t work, I agree, Mr. Hall should write a song.
Admiral BLAIR. I draw a contrast between the way we deal with countries that really don’t have our economic interests in their hand and those who do. When I was a commander in the Pacific, we could deal with countries in Southeast Asia, Indonesia, Malaysia, and other problem countries, and we weren’t completely dependent on them for oil supplies, so we could be a little sophisticated in our dealing with them. We didn’t have to turn to big, expensive, hair-trigger military options right off the bat.
By way of contrast, when we are dealing with countries who are controlling important parts of the world oil supply, we militarize our policy almost by default. What we feel, if we can drop the oil intensity of the United States economy, that is the amount of oil to produce every dollar of GDP and, as Mr. Sensenbrenner said, we dropped that between—after the first oil problems in the 1970s and the 1980s, but then it leveled out, and we are as dependent, as we all know, now. If we can do a combination of conservation and domestic alternatives, get that down again, then we are not as subject to being jacked around by these events and by these countries. So it really is a case of lowering our dependence on this as an economy to give these people who are in these shockwave events a little more flexibility so that they can have time to round up international support, so that they can use other maneuvers. It is just getting them on that hair trigger by the increased demand and the increased dependence that makes it so brutal when you come to one of these crisis situations like a pipeline that pops. So it is really that dependence that we need to work on.
I have talked to the car companies, and they are saying that American people do not want more efficient cars; they want more powerful cars with more cup holders. Therefore, we have to give it to them. I do not have a lot of sympathy for these car companies, because the price of that oil that we are using does not reflect the full price of the American troops who are doing all of this business around the world. If you factored in the real price of that oil, it would be huge, and frankly, I am sorry. It is not up to the car companies to make that judgment. It is up to the leaders of the American people to make that judgment.
MARSHA BLACKBURN, TENNESSEE. In my district in Tennessee we have a good bit of auto manufacturing. Admiral Blair, as you were saying, the market needs to tell—the American people need to say this is something that we are looking for and that we want. I remember the gas crisis of the 1970s and what we went through there. So let me ask each of you: How do you think the American public would respond to rationing if we were to go through an oil crisis?
Ms. BROWNER. I will be honest with you. I do not think, at this point in time, particularly well, and I think that is because, while individual families and Americans are always prepared to do their part to solve a problem, they want to know that the companies that make the products are also doing their part. I think there is a frustration that the American people have that they cannot get more fuel-efficient cars.
Admiral BLAIR. Yes. I think the American people have two reactions to that scenario that you have sketched out. Number 1, they would be angry, frustrated and looking for what got them into that fix. Number 2, they would roll up their sleeves, and they would do what had to be done to make it better, to work their way out of it. Since we know that now, why don’t we take the actions now to avoid that crisis because we know it would be so much harder on us if we brought it to that point.
Mrs. BLACKBURN. We do a lot of transport by truck across our Nation’s highways, and I was reading something the other day about the efficiencies of rail. I would love to hear what your thoughts are about moving more of our movement of goods and commodities to rail and taking it off the highways.
Admiral BLAIR. Part of our proposals were that fuel-efficiency standards should be applied to trucks as well as to cars, and we should make the trucks that we have more efficient also by applying the same sort of technology to them as we do to cars, and we should raise the fuel efficiency standard of our trucks as well as to our cars.
JOHN J. HALL, NEW YORK. Admiral, you talked about being ‘‘jacked around’’ by countries that we used to have a freer hand to deal with. You know, it seems to me that our options diplomatically or economically have been limited in terms of how we deal, for instance, with Saudi Arabia on one hand and China on the other hand. Is that what you would call a ‘‘loss of sovereignty’’?
Admiral BLAIR. Absolutely. The more you are constrained because of your dependence on another country, the more sovereignty you have lost.
JOHN J. HALL, NEW YORK. It seems to me like we are going down a road where citizens of the United States, have never understood what it is like to be in a position like Brazil was in in the 1970s, for instance, where the world financial markets dictated to them certain things they had to do or else they would not get their next round of debt floated. So I think we need to be aware of that, that oil and our consumption of oil, is putting us in that position.
Admiral BLAIR. I think that is absolutely right. Some of that came up in these simulations when the Secretary of State said in the simulation, ‘‘Well, I went to country X, and asked them if they would increase their amount of oil, and country X said, ‘Yes, I can do that, but there are a couple of things I want from you, United States. I want you to lay off hitting me on this policy that I am doing. I want you to make this concession.’ ’’ So it puts us in the position of having to spend some of our blue chips to get some of theirs, and we would just as soon not be there.
It seems to me that Detroit is advertising power and speed and style and is not advertising efficiency. Take notes, and just make it a project one night to sit in front of the TV, and every time a car ad comes on, make a note of what kind of car is being advertised and whether they are touting efficiency and reliability or whether they are touting sexiness and speed and 340 horsepower to leap out at the stop sign or at the merge ramp.
JOHN B. LARSON, CONNECTICUT. Admiral, you mentioned something very interesting in the scenarios as it was laid out and, as I understand it, with the consequences confronting you with the potential shutoff of supplies from Iran and Venezuela. Here is my question. In a situation such as that, you said that, by virtue of the fact that we are dealing with unfriendly States, that it almost becomes a de facto military situation. So the question is: In the scenario, where would the military deem to strike, if necessary, to recapture supplies—in this hemisphere or in the Middle East? Then bringing it to reality because, I think, that is what makes these useful, should Americans be concerned when we have, yet, another battle group doing maneuvers in the Persian Gulf?
Admiral BLAIR. I think the connection between the military force and oil supplies is a little more subtle than that. We do not go in and take over oil fields and sort of run them with soldiers and with contractors.
What I am saying is the fact that that region supplies a commodity, which is so fundamentally important to the United States, means that the United States [has to be] involved in the affairs of that region and will have to have a much deeper involvement in them so that, when one State threatens another or invades another as Iraq invaded Kuwait back in 1991, an issue in which military force clearly has an application, we will do it; we will use military force there. The military situations that clearly call for a military response in that part of the world are threatening to and closing the Strait of Hormuz, the scenario that we had in the tanker wars in the mid- 1980s when both Iraq and Iran were attacking oil tankers, and we ended up reflagging and escorting them.
So it is not so much that, militarily, we go in and take over oil fields, which is not a very useful alternative. It is that we are in the region, and when military force is used, the United States has got to consider what we do with our forces, and we kind of get sucked into it the way that we have over time. What I think is going on here is that, if the United States has a very great vulnerability of short-term interruptions in countries like Venezuela and Iran, who are no friends of this country, they can sort of throttle back for a while. It does not hurt them very badly. It hurts us. It gives them advantages across the board in dealing with their interests as opposed to ours, which result in change.
Ms. BROWNER. If I might just note, in this scenario, one of the things that did unfold from the Secretary of Defense was a question for the President. Should we change the Selective Service registration requirements to capture women? Secondly, should we begin thinking about some form of a draft? Because the concern in the scenario that he was bringing to the table is that the military is stretched very, very thin.
EDWARD J. MARKEY, MASSACHUSETTS, CHAIRMAN. Under your scenario, only 1% of the world’s oil supply is taken off the market. It leads to $160-a-barrel oil. It leads to the collapse of the economy. What is it that has led to having the oil markets become so tight that they can have such a profound impact in such a short period of time?
Ms. BROWNER. I think in that scenario, it is a combination of factors, but certainly, the failure of efficiency, the failure to drive down the amount of oil we use on a daily basis becomes pretty important because while the actual number—it ends up at about 1 billion barrels a day. That is not an amount that cannot be addressed through some prudent steps taken, you know, sooner rather than later.
Admiral BLAIR. That was sort of a surprising effect. You would think, on a percentage basis, it would not be that big. The game play for that result was done by a highly-respected, Canadian energy consulting company that we fed the information to and then asked them ‘‘Okay. What did that do to the price of barrels?’’ They ran their quantitative models, in their judgment. What I think was at play there was that, with the oil market so tight in the future primarily because of the increases in non-U.S. production, India and China are leading it. You find that non-U.S. oil demand goes up 38% over, maybe, the next 5 years; whereas, U.S. demand goes up about 24%. That is just making the oil market so tight that the power of expectations comes to play, and even relatively small tremors make people worry about the future. Therefore, they want to ensure their own supplies, and they bid up prices. So you are just in this trigger in which a relatively small rock in the pond has pretty big ripples.
EDWARD J. MARKEY, MASSACHUSETTS, CHAIRMAN. So you talk in your testimony, Admiral, about our ever-growing military presence in the Middle East. Could you give us some sense of how you feel, for example, as to how this growing dependence upon oil affects our relationship with Saudi Arabia?
Admiral BLAIR. I think it gives Saudi Arabia much greater leverage in its dealings with us, and it is no secret that there are a lot of aspects of Saudi Arabia in the future that we have real concerns about, and when you are that much—when a country with those sorts of challenges has that much of a thumb on you, it causes concern.
Ms. BROWNER. [A 35-mile-per-gallon standard by 2020] is absolutely essential. We have got to get on with doing this. As I said in my opening statement, this is the second time I have participated in one of these. The message from both of them was identical, that taking steps sooner rather than later is key to these problems. In the case of CAFE and the proposal that the Senate has passed, it would have solved the problem that we were confronting. It was not as if this scenario was designed to then conclude, well, you should have passed CAFE. It was just the fact of, when you go back and look at how it unfolded, that is one of the easiest ways, actually, to have solved the problem.
Admiral BLAIR. I am [sure we can improve efficiency without compromising vehicle safety]. I tell you the strongest technical support for that judgment was our updating of a study done by the National Academy of Sciences. The answer from these technical experts was, unambiguously, yes, it could. That was even without considering hybrids and some other, more recent technologies. We think the burden of proof ought to be put on people saying why they cannot do it. What you hear from the auto companies, you know, is American consumers do not want it, you know, blah, blah, blah. So we think we ought to shift the burden in the other direction.
Ms. BROWNER. You know, at the EPA, I, obviously, got the chance to regulate the automotive industry, and they always said no, no, no, no, no. Then they always turned around and did it….there is no doubt in my mind that they can do it. They will complain loudly, but they will end up being able to do it.
JAMES SENSENBRENNER, JR., WISCONSIN. Everyone who stops to fill up at the pump, and that is most people in this country, know firsthand how the United States’ dependence on foreign oil affects them. They feel it in their wallet, pennies at a time, as the price of gas creeps up. And most Americans understand that the price of oil is often influenced by events around the world. I doubt the results of the Oil Shockwave simulations would surprise many Americans. But I bet many Americans don’t realize just how vast the energy supplies are in the United States. Beneath this great Nation there are enough energy reserves to propel us towards energy security; and surely we have the intellectual and scientific capacity to give us the energy security that all of us, Democrats and Republicans, desire. According to the Interior Department, there are potentially 120 billion—that is with a ‘‘b’’—barrels of untapped oil in the United States, including offshore reserves in Alaska, the Pacific and Gulf of Mexico. Add to that the potential of 635 trillion—with a ‘‘t’’— cubic feet of natural gas remains untapped, and we have got what we need to start weaning ourselves off the oil supplies from foreign countries that are hostile to the United States. But that is just the start. It is estimated that there are 250 billion tons of recoverable coal reserves, which is nearly six times the combined U.S. oil and natural gas reserves. In fact, it is believed that our coal supplies are larger than any single energy source of any single nation, including Saudi Arabia oil. The U.S. coal supply is equivalent to nearly 800 billion barrels of oil, more than three times the energy equivalent of Saudi Arabia’s oil.
EARL BLUMENAUER, OREGON. I have been following the Oil Shock exercises for some time and have been intrigued by the power to be able to demonstrate how perilous we are balanced today on our petroleum dependence. In my community, we had, over a year ago, the city government forming a task force to explore these other entities, and 12 distinguished citizens came back with things that wouldn’t surprise our participants, but I think it was an important part in sort of driving where we are going. I appreciate the comments of the distinguished ranking member, but one of the downsides of what he is describing is that there are no technologies now available that don’t make the other part of our charge as a committee fighting against global warming and greenhouse gasses, it will that make it worse. The simple fact is that we are the largest consumer of petroleum. We are consuming it at a rate 10 times what our share of the world’s proven supplies are, and we are depleting our own reserves right now at a very rapid rate. And given our security concerns for the future, those ought to be the last areas that we try and pump as fast as we can, rather than the first or, in the case of the Arctic, the next.
One of the things that might be interesting would be for our committee to spend the better part of a day experiencing the simulation. Having dealt with the people who’ve designed it, having watched it from afar, I think that it might shake some of us out of our lethargy if we actually stopped pontificating and actually go through a simulation where we have to make some of these real-life decisions that we, as a Congress, have failed to mitigate. And if our committee might set the tone, Mr. Chairman, I think it might be—there might be other people on both sides of the aisle who would go through it. And if we could get even 10 percent of the Members of Congress to have to go through this, devoting only half a day, I think it would be a sort of a homework that might put some realism into what too often around here is, I think, rather hallow rhetoric. I think all of us ought to have the sense of urgency for the very reasons you said in our opening statement, and I would hope we might consider it because it is too good a model for us to at least not test.
==================
FYI, these are the people consulted to come up with a realistic Oil ShockWave simulation:
- Bruce Averill, Senior Coordinator, Critical Infrastructure Protection Policy, U.S. Department of State
- General Ronald Bath and Jaime Taylor, The RJ Bath Group
- Kara Baynton, Senior Energy Analyst, ARC Financial
- Rand Beers, former Special Assistant to the President and Senior Director for Combating Terrorism
- Paul Domjan, Director, John Howell and Company
- David Frowd, former Head of Strategy and Planning in Shell’s Upstream Headquarters
- Richard Haass, President, The Council on Foreign Relations
- Randall J. Larson, Director, The Institute for Homeland Security
- Dr. Kimberly Marten, Department Chair, Political Science, Barnard College, Columbia University
- Ronald E. Minsk, Counsel, Alston & Bird LLP
- Daniel Poneman, Principal, The Scowcroft Group
- David Sandalow, Senior Fellow, The Brookings Institute
- Peter Tertzakian, Senior Energy Economist, ARC Financial
- Jeff Werling, Executive Director, Inforum, University of Maryland Department of Economics
- Robert F. Wescott, President, Keybridge Research LLC