[ David Murphy doesn’t answer this question, but does give the history of EROI and more importantly, what this means for oil production and society.
If we are going to spend money on fossil alternatives, wouldn’t it make sense to use EROI as a way of allocating funds to the most promising technologies? I have yet to find a U.S. House or Senate hearing that mentions EROI, and seldom run across EROI in federal or state documents on energy, which are more concerned with the life cycle analysis of greenhouse emissions and coping with endless growth rather than energy efficiency. Perhaps they don’t want to find out that the EROI is negative
I extracted the section of this paper that discusses EROI history, and after that, some excerpts from this very important paper about the EROI of conventional and unconventional oil (I’ve left the more difficult technical parts out, as well as most of the charts and figures)
Alice Friedemann www.energyskeptic.com author of “When Trucks Stop Running: Energy and the Future of Transportation, 2015, Springer]
Murphy, David J. December 2, 2013. The implications of the declining energy return on investment of oil production. Trans. R. Soc. A 2014 372
A brief history of energy return on investment
In the late 1960s, Charles Hall studied the energy flows within New Hope Creek, in North Carolina, USA, to understand the migration patterns of the fish within the stream. His conclusions [16] revealed that, by migrating, the fish were able to exploit new sources of food, which, after accounting for the additional energy cost of migration, conferred a large net energy gain upon the fish. In other words, owing to the abundance of food in the new locations, the fish were able to gain enough energy not only to ‘pay’ for the energy expenditure of that migration but also to grow and reproduce. Comparing the energy gained from migration to the energy expended in the migration process was ostensibly the first calculation of EROI.
In the autumn of 1973 the price of oil skyrocketed following the Arab oil embargo (the so-called ‘first oil shock’), which sent most OECD economies tumbling into recession. The apparent vulnerability of OECD nations to spikes in the price of oil led many researchers to focus on the interaction between the economy and energy. Then, in 1974, the journal Energy Policy dedicated a series of articles to the energy costs of production processes. The editor of this series, Peter Chapman, began the series with a paper titled ‘Energy costs: a review of methods’, and observed that ‘this subject is so new and undeveloped that there is no universally agreed label as yet’ [17], and followed up two years later with a second paper [18]. Today this area of research is spread among a number of different disciplines, including, but not limited to, ecological economics, industrial ecology and net energy analysis, and the EROI statistic is just one of many indicators calculated.
Also during this period researchers started using Leontief input–output tables as a way to measure the use of energy within the economy [19–22]. For example, Bullard & Herendeen [23] used a Leontief-type input–output matrix to calculate the energy intensity (in units of joules per dollar) of every major industrial sector of the US economy. Even today this paper serves as a useful model for other net energy analyses [8,24]. In addition, a workshop in Sweden in 1974 and one at Stanford, CA, in 1975 formalized the methodologies and conventions of energy analysis [25,26].
In 1974, the US Congress enacted specific legislation mandating that net energy be accounted for in energy projects. The Nuclear Energy Research and Development Act of 1974 (NERDA) included a provision stating that ‘the potential for production of net energy by the proposed technology at the stage of commercial application shall be analyzed and considered in evaluating proposals’. Further influential papers by the Colorado Energy Research Institute, Bullard et al. and Herendeen followed this requirement [27–29]. Unfortunately, the net energy provision within the NERDA was never adopted and was eventually dropped.
In 1979, the Iranian revolution led to a cessation of their oil exports (the second oil shock), which precipitated another spike in the price of oil and squeezed an already strained US economy. Responding to this, and in an attempt to control deficits and expenditure, President Reagan of the USA enacted Executive Order 12291 in 1980. This order mandated that ‘regulatory action shall not be undertaken unless the potential benefits to society from the regulation outweigh the potential costs to society’. In other words, all US regulatory action had to show a net monetary benefit to US society, and the idea of measuring benefits in terms of net energy fell even further from the policy arena. Net energy analysis remained insignificant in US energy policy debates until the dispute over corn ethanol emerged 25 years later [30,31].
Although the political emphasis had now shifted towards economic analysis, the 1980s still provided useful papers on net energy analysis (e.g. [32]). In 1981, Hall published ‘Energy return on investment for United States petroleum, coal, and uranium’, which marked the first time that the acronym EROI was published in the academic literature [33]. Later that year, Hall & Cleveland [34] published ‘Petroleum drilling and production in the United States: yield per effort and net energy analysis’. This paper analysed the amount of energy being produced per foot drilled and found that the ratio had been declining steadily for 30 years. Further publications by Hall and colleagues then tested hypotheses relating economic growth to energy use, introduced explicitly the concept of energy return on investment and examined the EROI of most major sources of energy [35,36].
Following growing concern about environmental impacts, climate change and sustainability, documented in the Brundtland Report in 1987 [37], emphasis began to shift from energy analysis to greenhouse gas (GHG) emissions and life-cycle analysis. Life-cycle analysis (LCA) itself was born out of the process and input–output analyses codified in the aforementioned energy literature of the 1970s and 1980s, and can be used to calculate EROI and other net energy metrics. Beginning around the turn of the century, researchers began to recognize the complementarity between LCA and net energy and began publishing on the matter [38].
There was another surge in publications in net energy analysis in the 2000s, due mainly to a growing global interest in renewable energy, and therefore an interest in metrics that compare renewable energy technologies. The debate about whether or not corn ethanol has an EROI greater than one is a good example [30,31]. There has also been a number of studies using the input–output techniques developed in the 1970s to track emissions production and/or resource consumption across regions [39].
Today, research within the field of net energy analysis is expanding rapidly. The main renewable energy options, including, but not limited to, solar photovoltaics, concentrating solar, wind power and biofuels, have each been the focus of studies estimating their net energy yield [31,40,41]. Furthermore, with the expansion of oil production into ultra-deep water, tar sands and other unconventional sources, as well as developments with shale gas, there has been a renewed interest in whether or not these sources of energy have EROI ratios similar to conventional oil and gas, and publications are expected to be forthcoming.
Abstract. Declining production from conventional oil resources has initiated a global transition to unconventional oil, such as tar sands. Unconventional oil is generally harder to extract than conventional oil and is expected to have a (much) lower energy return on (energy) investment (EROI). Recently, there has been a surge in publications estimating the EROI of a number of different sources of oil, and others relating EROI to long-term economic growth, profitability and oil prices. The following points seem clear from a review of the literature: (i) the EROI of global oil production is roughly 17 and declining, while that for the USA is 11 and declining; (ii) the EROI of ultra-deep-water oil and oil sands is below 10; (iii) the relation between the EROI and the price of oil is inverse and exponential; (iv) as EROI declines below 10, a point is reached when the relation between EROI and price becomes highly nonlinear; and (v) the minimum oil price needed to increase the oil supply in the near term is at levels consistent with levels that have induced past economic recessions. From these points, I conclude that, as the EROI of the average barrel of oil declines, long-term economic growth will become harder to achieve and come at an increasingly higher financial, energetic and environmental cost.
Introduction
Today’s oil industry is going through a fundamental change: conventional oil fields are being rapidly depleted and new production is being derived increasingly from unconventional sources, such as tar or oil sands and shale (or tight) oil. Indeed, much of the so-called ‘peak oil debate’ rests on whether or not these sources can be produced at rates comparable to the conventional mega-oil fields of yesterday.
What is less discussed is that the production of unconventional oil most likely has a (much) lower net energy yield than the production of conventional crude oil. Net energy is commonly defined as the difference between the energy acquired from some source and the energy used to obtain and deliver that energy, measured over a full life cycle.
A related concept is the energy return on investment (EROI), defined as the ratio of the former to the latter (EROI=Eout/Ein). The ‘energy used to obtain energy’ (Ein) may be measured in a number of different ways. For example, it may include both the energy used directly during the operation of the relevant energy system (e.g. the energy used for water injection in oil wells) as well as the energy used indirectly in various stages of its life cycle (e.g. the energy required to manufacture the oil rig). Owing to these differences, it is necessary to ensure that the EROI estimates have been derived using similar boundaries, i.e. using the same level of specificity for Ein. Murphy et al. [1] suggested a framework for categorizing various EROI estimates, and, where applicable, I will follow this framework in this paper.
Estimates of EROI are important because they provide a measure of the relative ‘efficiency’ of different energy sources and of the energy system as a whole [2,3]. Since it is this net energy that is important for long-term economic growth [3–6], measuring and tracking the changes in EROI over time may allow us to assess the future growth potential of the global economy in ways that data on production and/or prices cannot.
Over the past few years, there has been a surge in research estimating the EROI of a number of different sources of oil, including global oil and gas [7], US oil and gas [8,9], Norwegian oil and gas [10], ultra-deep-water oil and gas [11] and oil shale [12]. In addition, there have been several publications relating EROI to long-term economic growth, firm profitability and oil prices [3,13–15]. The main objective of this paper is to use this literature to explain the implications that declining EROI may have for long-term economic growth. Specifically, this paper: (i) provides a brief history of the development of EROI and net energy concepts in the academic literature, (ii) summarizes the most recent estimates of the EROI of oil resources, (iii) assesses the importance of EROI and net energy for economic growth and (iv) discusses the implications of these estimates for the future growth of the global economy.
Energy return on (energy) investment, oil prices, and economic growth
The economic crash of 2008 occurred during the same month that oil prices peaked at an all-time high of $147 per barrel, leading to numerous studies that suggested a causal link between the two [47,48]. In addition, other researchers involved in net energy analysis began examining how EROI relates to both the price of oil and economic growth [3,13,15,49–51].
Murphy & Hall [3] examined the relation between EROI, oil price and economic growth over the past 40 years and found that economic growth occurred during periods that combined low oil prices with an increasing oil supply. They also found that high oil prices led to an increase in energy expenditures as a share of GDP, which has led historically to recessions. Lastly, they found that oil prices and EROI are inversely related (figure 2), which implies that increasing the oil supply by exploiting unconventional and hence lower EROI sources of oil would require high oil prices. This created what Murphy & Hall called the ‘economic growth paradox: increasing the oil supply to support economic growth will require high oil prices that will undermine that economic growth’.
Other researchers have come to similar conclusions to those of Murphy & Hall, most notably economist James Hamilton [47]. Recently, Kopits [50], and later Nelder & Macdonald [49], reiterated the importance of the relation between oil prices and economic growth in what they describe as a ‘narrow ledge’ of oil prices. This is the idea that the range, or ledge, of oil prices that are profitable for oil producers but not so high as to hinder economic growth is narrowing as newer oil resources require high oil prices for development, and as economies begin to contract due largely to the effects of prolonged periods of high oil prices. In other words, it is becoming increasingly difficult for the oil industry to increase supply at low prices, since most of the new oil being brought online has a low EROI. Therefore, if we can only increase oil supply through low EROI resources, then oil prices must apparently rise to meet the cost, thus restraining economic growth.
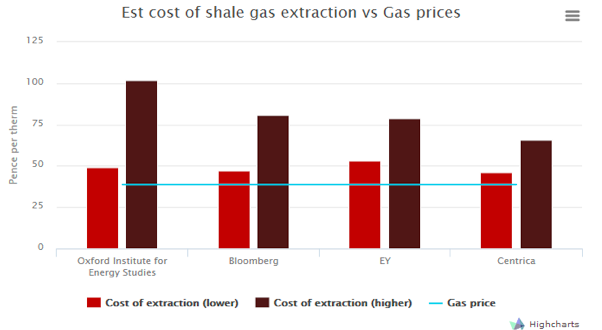
Skrebowski [51] provides another interpretation of the relation between oil prices and economic growth in what he calls the ‘effective incremental oil supply cost’.2 According to data provided by Skrebowski, developing new unconventional oil production in Canada (i.e. tar sands) requires an oil price between $70 and $90 per barrel. Skrebowski also indicates that new production from ultra-deep-water areas requires prices between $70 and $80 per barrel. In other words, to increase oil production over the next few years from such resources will require oil prices above at least $70 per barrel. These oil prices may seem normal today considering that the market price for reference crude West-Texas Intermediate ranged from $78 to $110 per barrel in 2012 alone, but we should remember that the average oil price during periods of economic growth over the past 40 years was under $40 per barrel, and the average price during economic recessions was under $60 per barrel (dollar values inflation adjusted to 2010) [3]. What these data indicate is that the floor price at which we could increase oil production in the short term would require, at a minimum, prices that are correlated historically with economic recessions.
Understanding the relationship between energy return on (energy) investment and net energy
The mathematical relation between EROI, net energy and gross energy can be used to explain why, at around an EROI of 10, the relation between EROI and most other variables, such as price, economic growth and profitability, becomes nonlinear. The following equation describes the relation between EROI, gross and net energy [3]:  3.2Using this equation, we can estimate the net energy provided to society from a particular energy source or (rearranging) the amount of gross energy required to provide a certain amount of net energy [52]. We can also interpret equation (3.2) as follows: an EROI of 5 will deliver to society 80% of the gross energy extracted as net energy, while an EROI of 2 will deliver only 50%. This exponential relation between gross and net energy means that there is little difference in the net energy provided to society by an energy source with an EROI above 10, whether it is 11 or 100, but a very large difference in the net energy provided to society by an energy source with an EROI of 10 and one with an EROI of 5. This exponential relation between gross and net energy flows has been called the ‘net energy cliff’ [53] and it is the main reason why there is a critical point in the relation between EROI and price at an EROI of about 10 (figure 4).

Figure 4.
The ‘net energy cliff’ graph, showing the relation between net energy and EROI. As EROI declines, the net energy as a percentage of total energy extracted declines exponentially. Note that the x-axis is in reverse order. (Adapted from Mearns [53].)
Calculating the minimum energy return on (energy) investment at the point of energy acquisition for a sustainable society
According to equation (3.2), as EROI declines, the net energy provided to society declines as well, and, at some point, the amount of net energy will be insufficient to meet existing demand. The point at which the EROI provides just enough net energy to society to sustain current activity represents the minimum EROI for a sustainable society. But estimating empirically the actual minimum EROI for society is challenging. Hall et al. [24] estimated that the minimum EROI required to sustain the vehicle transportation system of the USA was 3. Since their calculation included only the energy costs of maintaining the transportation system, it is reasonable to expect that the minimum EROI for society as a whole could be much higher. Exploring the minimum EROI for a sustainable society is beyond the scope of this paper. Instead, I will examine how, in theory, the minimum EROI could be calculated by using some simple models. I will first do this by examining how the idea of net energy grew from analysing the energy budgets of organisms.
The energy that an organism acquires from its food is its gross energy intake. Let us assume, for simplicity’s sake, that an organism consumed 10 units of gross energy, but to access this food it expended 5 units of energy. Given these parameters, the EROI is 2 (=10/5) and the net energy is 5. It is important to note that the expended energy created an energy deficit (5 units) that must be repaid from the gross energy intake (10 units) before any growth, for example, in the form of building fat reserves or reproduction, can take place.
An economy also must have an influx of net energy to grow. Let us assume that Economy A produces 10 000 units of energy at an EROI of 10, which means that the energy cost of acquisition is 1000 units and the net energy is 9000. Much like organisms, economies also have energy requirements that must be met before any investments in growth can be made. Indeed, researchers are now measuring the ‘metabolism of society’ by mapping energy consumption and flow patterns over time [54].4 For example, economies must invest energy simply to maintain transportation and building infrastructure, to provide food and security, as well as to provide energy for direct consumption in transportation vehicles, households and business, etc. The energy flow to society must first pay all of these metabolic energy costs before enabling growth, such as constructing new buildings, roads, etc.
As society transitions to lower EROI energy sources, a portion of net energy that was historically used for consumption and/or growth will be transferred to the energy extraction sector. This transfer decreases the growth and consumption potential of the economy. For example, let us assume that, as energy extraction becomes more difficult in Economy A, it requires an additional 1000 units of energy (2000 total) to maintain its current production of gross energy, decreasing the EROI from 10 to 5 and the net energy from 9000 to 8000. If the metabolism of the economy remains at 5000 units of energy, Economy A now has only 3000 units of energy to invest in growth and/or consumption (figure 5b).
If the EROI for society were to decline to 2, the amount of energy that could previously be invested in growth and consumption would be transferred completely to the energy extraction sector. Thus, given the assumed metabolic needs of Economy A in this example, an EROI of 2 would be the minimum EROI needed to provide enough energy to pay for the current infrastructure requirements of Economy A, or, to put it another way, an EROI of 2 would be the minimum EROI for a sustainable Economy A. If the EROI were to decline below 2, for example in some biofuel systems [31], then the net energy provided to society would not be enough to maintain the infrastructure of Economy A, resulting in physical degradation and economic contraction
Building off this idea of societal metabolism, we can gain additional insight into the relationship between EROI and economic growth by differentiating between three main uses of energy by society: metabolism, which could be described as the energy and material costs associated with the maintenance and replacement of populations and capital depreciation (examples include food consumption, bridge repair or doctor visits); consumption, which is the expenditure of energy that does not increase populations or capital accumulation and is not necessary for metabolism (examples include purchasing movie tickets or plane tickets for vacation; in general, this category represents items purchased with disposable income); and growth, which is the investment of energy and materials in new populations and capital over and above that necessary for metabolism (examples include building new houses, purchasing new cars, increasing populations).
Implications for the future of economic growth
The implication of these arguments is that, if we try to pursue growth by using sources of energy of lower EROI, perhaps by transitioning to unconventional fossil fuels, long-term economic growth will become harder to achieve and come at an increasingly higher financial, energetic and environmental cost.
Revolutionary technological advancement is really the only way in which unconventional oil can be produced with a high EROI, and thus enhance the prospects for long-term economic growth and reduce the associated financial, energetic and environmental costs. This technological advancement would have to increase the energy efficiency of unconventional oil extraction or allow for increased oil recovery from fields discovered already [56]. Alternatively, there could be massive substitution from oil to high EROI renewables such as wind or hydropower [57].
It is difficult to assess directly how much technological progress is being or will be made by an industry, but we can get a glimpse as to how the oil industry is faring by comparing how production is responding to effort. If new technological advancements, such as hydraulic fracturing and horizontal drilling, represent the types of revolutionary technological breakthroughs that are needed, then we should at least see production increasing relative to effort. The data, however, do not indicate that this is the case. From 1987 to 2000, when the US oil industry increased the number of rigs used to produce oil, there was, as expected, a corresponding increase in the amount of oil produced (figure 7). But from 2001 to 2012 the trend shows very little correlation between drilling effort and oil production.
[ My note: many energy analysts have postulated that secondary and tertiary methods of extracting oil NOW actually reduce the amount of oil produced later, resulting in production after peak oil being more like a cliff than a bell curve ]
Summary
The concept of energy return on investment (EROI) was born out of ecological research in the early 1970s, and has grown over the past 30 years into an area of study that bridges the disciplines of industrial ecology, economics, ecology, geography and geology, just to name a few. The most recent estimates indicate that the EROI of conventional oil is between 10 and 20 globally, with an average of 11 in the USA. The future of oil production resides in unconventional oil, which has, on average, higher production costs (in terms of both money and energy) than conventional oil, and should prove in time to have a (much) lower EROI than conventional oil. Similar comments apply to other substitutes such as biofuels. The lack of peer-reviewed estimates of the EROI of such resources indicates a clear need for further investigation.
Transitioning to lower EROI energy sources has a number of implications for global society. First, it will reallocate energy that was previously destined for society towards the energy industry alone. This will, over the long run, lower the net energy available to society, creating significant headwinds for economic growth. Secondly, transitioning to lower EROI oil means that the price of oil will remain high compared to the past, which will also place contractionary pressure on the economy. Third, as we try to increase oil supplies from unconventional sources, we will accelerate the resource acquisition rate, and therefore the degradation of our natural environment.
It is important to realize that the problems related to declining EROI are not easily solved.
Lastly, it seems apparent that the supply-side solutions (more oil, renewable energy, etc.) will not be sufficient to offset the impact that declining EROI has on economic growth. All of this evidence indicates that it is time to re-examine the pursuit of economic growth at all costs, and maybe examine how we can reduce demand for oil while trying to maintain and improve quality of life. A good summary of these problems is also given in Sorrell [72].
For society, we can either dictate our own energy future by enacting smart energy policies that recognize the clear and real limits to our own growth, or we can let those limits be dictated to us by the physical constraints of declining EROI. Either way, both the natural succession of ecosystems on Earth and declining EROI of oil production indicate that we should expect the economic growth rates of the next 100 years to look nothing like those of the last 100 years.