Limits to Growth is on schedule. Collapse likely around 2020

Alice Friedemann   www.energyskeptic.com  author of “When Trucks Stop Running: Energy and the Future of Transportation”, 2015, Springer and “Crunch! Whole Grain Artisan Chips and Crackers”. Podcasts: Practical Prepping, KunstlerCast 253, KunstlerCast278, Peak Prosperity , XX2 report ]


Climate scientists and others have in the past few years issued a steady stream of analyses showing that without immediate remedial actions, a disastrous future is headed our way. But is it a four-decade-old study that will prove prescient?

That study, issued in the 1972 book The Limits to Growth, forecast that industrial output would decline early in the 21st century, followed quickly by a rise in death rates due to reduced provision of services and food that would lead to a dramatic decline in world population. To be specific, per capita industrial output was forecast to decline “precipitously” starting in about 2015.

Well, here we are. Despite years of stagnation following the worst economic crash since the Great Depression, things have not gotten that bad. At least not yet. Although the original authors of The Limits to Growth, led by Donella Meadows, caution against tying their predictions too tightly to a specific year, the actual trends of the past four decades are not far off from the what was predicted by the study’s models. A recent paper examining the original 1972 study goes so far as to say that the study’s predictions are well on course to being borne out.

That research paper, prepared by a University of Melbourne scientist, Graham Turner, is unambiguously titled “Is Global Collapse Imminent?” As you might guess from the title, Dr. Turner is not terribly optimistic.

He is merely the latest researcher to sound alarm bells. Just last month, a revised paper by 19 climate scientists led by James Hansen demonstrates that continued greenhouse-gas emissions will lead to a sea-level rise of several meters in as few as 50 years, increasingly powerful storms and rapid cooling in Europe. Two other recent papers calculate that humanity has already committed itself to a six-meter rise in sea level and a separate group of 18 scientists demonstrated in their study that Earth is crossing multiple points of no return. All the while, governments cling to the idea that “green capitalism” will magically pull humanity out of the frying pan.

Four decades of ‘business as usual’

At least global warming is acknowledged today, even if the world’s governments prescriptions thus far are woefully inadequate. In 1972, the message of The Limits to Growth was far from welcome and widely ridiculed. Adjusting parameters to test various possibilities, the authors ran a dozen scenarios in a global model of the environment and economy, and found that “overshoot and collapse” was inevitable with continued “business as usual”; that is, without significant changes to economic activity. Needless to say, such changes have not occurred.

In the “business as usual” model, the capital needed to extract harder-to-reach resources becomes sufficiently high that other needs for investment are starved at the same time that resources begin to become depleted. Industrial output would begin to decline about 2015, but pollution would continue to increase and fewer inputs would be available for agriculture, resulting in declining food production. Coupled with declines in services such as health and education due to insufficient capital, the death rate begins to rise in 2020 and world population declines at a rate of about half a billion per decade from 2030. According to Dr. Turner:

“The World3 model simulated a stock of non-renewable as well as renewable resources. The function of renewable resources in World3, such as agricultural land and the trees, could erode as a result of economic activity, but they could also recover their function if deliberate action was taken or harmful activity reduced. The rate of recovery relative to rates of degradation affects when thresholds or limits are exceeded as well as the magnitude of any potential collapse.”

The World3 computer model simulated interactions within and between population, industrial capital, pollution, agricultural systems and non-renewable resources, set up to capture positive and negative feedback loops. Dr. Turner writes that changing parameters merely delays collapse. The current boom in fracking natural gas and the extraction of petroleum products from tar sands weren’t anticipated in the 1970s, but the expansion of new technologies to exploit resources pushes back the collapse “one to two decades” but “when it occurs the speed of decline is even greater.”

Turner collapse chart
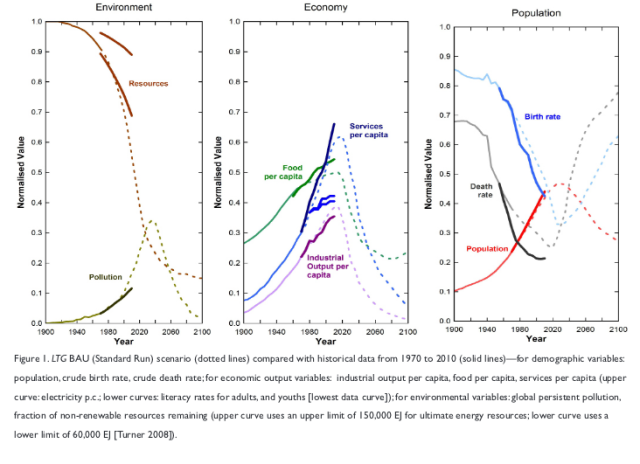
So how much stock should we put in a study more than 40 years old? Dr. Turner asserts that actual environmental, economic and population measurements in the intervening years “aligns strongly” to what the Limits to Growth model expected from its “business as usual” run. He writes:

“[T]he observed industrial output per capita illustrates a slowing rate of growth that is consistent with the [business as usual scenario] reaching a peak. In this scenario, the industrial output per capita begins a substantial reversal and decline at about 2015. Observed food per capita is broadly in keeping with the [Limits to Growth business as usual scenario], with food supply increasing only marginally faster than population. Literacy rates show a saturating growth trend, while electricity generation per capita … grows more rapidly and in better agreement with the [Limits to Growth] model.”

Peak oil and difficult economics

Rising energy costs following global peak oil will make much of the remaining stock uneconomical to exploit. This is a critical forcing point in the collapse scenario. And as more energy is required to extract resources that are more difficult to exploit, the net energy from production continues to fall. John Michael Greer, a writer on peak oil, observes that, just as it takes more energy to produce a steel product than it did a century ago due to the lower quality of iron ore today, more energy is required to produce energy today.

Net energy from oil production has vastly shrunken over the years, Mr. Greer writes:

“[T]the sort of shallow wells that built the US oil industry has a net energy of anything up to 200 to 1: in other words, less than a quart out of each 42-gallon barrel of oil goes to paying off the energy cost of extraction, and the rest is pure profit. … As you slide down the grades of hydrocarbon goo, though, that pleasant equation gets replaced by figures considerably less genial. Your average barrel of oil from a conventional US oilfield today has a net energy around 30 to 1. … The surge of new petroleum that hit the oil market just in time to help drive the current crash of oil prices, though, didn’t come from 30-to-1 conventional oil wells. … What produced the surge this time was a mix of tar sands and hydrofractured shales, which are a very, very long way down the goo curve. …

“The real difficulty with the goo you get from tar sands and hydrofractured shales is that you have to put a lot more energy into getting each [barrel of oil equivalent] of energy out of the ground and into usable condition than you do with conventional crude oil. The exact figures are a matter of dispute, and factoring in every energy input is a fiendishly difficult process, but it’s certainly much less than 30 to 1—and credible estimates put the net energy of tar sands and hydrofractured shales well down into single digits. Now ask yourself this: where is the energy that has to be put into the extraction process coming from? The answer, of course, is that it’s coming out of the same global energy supply to which tar sands and hydrofractured shales are supposedly contributing.”

It is that declining energy availability and greater expense that is the tipping point, Dr. Turner argues:

“Contemporary research into the energy required to extract and supply a unit of energy from oil shows that the inputs have increased by almost an order of magnitude. It does not matter how big the resource stock is if it cannot be extracted fast enough or other scarce inputs needed elsewhere in the economy are consumed in the extraction. Oil and gas optimists note that extracting unconventional fuels is only economic above an oil price somewhere in the vicinity of US$70 per barrel. They readily acknowledge that the age of cheap oil is over, without apparently realising that expensive fuels are a sign of constraints on extraction rates and inputs needed. It is these constraints which lead to the collapse in the [Limits to Growth] modelling of the [business as usual] scenario.”

New oil is dirty oil

The current plunge in oil and gas prices will not be permanent. Speculation on why Saudi Arabia, by far the world’s biggest oil exporter, continues to furiously pump out oil as fast as it can despite the collapse in pricing frequently centers on speculation that the Saudis’ pumping costs are lower than elsewhere and thus can sustain low prices while driving out competitors who must operate in the red at such prices.

If this scenario pans out, a shortage of oil will eventually materialize, driving the price up again. But the difficult economics will not have disappeared; all the easy sources of petroleum have long since been tapped. And the sources for the recent boom — tar sands and fracking — are heavy contributors to global warming, another looming danger. The case for catastrophic climate disruption due to global warming is far better understood today than it was in 1972 — and we are already experiencing its effects.

Dr. Turner, noting with understatement that these gigantic global problems “have been met with considerable resistance from powerful societal forces,” concludes:

“A challenging lesson from the [Limits to Growth] scenarios is that global environmental issues are typically intertwined and should not be treated as isolated problems. Another lesson is the importance of taking pre-emptive action well ahead of problems becoming entrenched. Regrettably, the alignment of data trends with the [Limits to Growth] dynamics indicates that the early stages of collapse could occur within a decade, or might even be underway. This suggests, from a rational risk-based perspective, that we have squandered the past decades, and that preparing for a collapsing global system could be even more important than trying to avoid collapse.”

Sobering indeed. Left unsaid (and, as always, there is no criticism intended in noting a research paper not going outside its parameters) is why so little has been done to head off a looming global catastrophe. Free of constraints, it is not difficult to quantify those “powerful societal forces” as the biggest industrialists and financiers in the world capitalist system. As long as we have an economic system that allows private capital to accumulate without limit on a finite planet, and externalize the costs, in a system that requires endless growth, there is no real prospect of making the drastic changes necessary to head off a very painful future.

Just because a study was conducted decades in the past does not mean we can’t learn from it, even with a measure of skepticism toward peak-oil fast-collapse scenarios. If we reach still further back in time, Rosa Luxemburg’s words haunt us still: Socialism or barbarism.

Pete Dolack writes the Systemic Disorder blog and has been an activist with several groups. His book, It’s Not Over: Learning From the Socialist Experiment, is available from Zero Books.

Posted in 2) Overshoot, Limits To Growth, Scientists | Tagged , , | Comments Off on Limits to Growth is on schedule. Collapse likely around 2020

Millions of hours of magnetic tape will be lost forever

[ Sarah Everts writes about the race to save magnetic tape in the August 21, 2014 issue of NewScientist in Wiped out: The race to save our video heritage. This article suggests that the fix is to convert magnetic tape to digital.  But digital will not last for centuries, and also suffers from the possibility of media that no longer have devices to play them, especially in the future when the electric grid isn’t always up and the consequent inability to make today’s computer chips is lost (also from lack of rare earth metals, etc).  I’ve paraphrased and put in excerpts of this article below.  Alice Friedemann  www.energyskeptic.com ]

What’s at stake

Whether recordings of people speaking near-extinct languages, video documentation of earthquakes in action, footage of Nobel laureates in their labs or defining moments in sport and culture, a goodly portion of recent human memory is encoded on thin strips of black ribbon. The Co-ordinating Council of Audiovisual Archives Associations has recently estimated that worldwide some 200 million hours of culturally valuable audiovisual content is in danger of disappearing entirely if it isn’t converted into a preservable digital format.

Richard Wright, a former technology manager of the BBC archives estimates 70% of content on magnetic tape will be lost within a decade due to slow rates of converting them to digital media.

Magnetic tape begins to degrade chemically in anything from a few years to a few decades, depending on its precise composition.  Often it’s not only the tapes degrading, but also the technical know-how to play them at all, or the machines to play the dizzying 60 plus formats of magnetic tape invented since 1956.  Tapes vary from a quarter of an inch to two inches wide, have differing real and cassette dimensions, and specific playback equipment for each one. Magnetic tapes are made in dozens of ways as well, and manufacturers won’t disclose how their tapes were made even though they’re obsolete now, making it hard for researchers to understand why they’re degrading.

The problem: Magnetic tape suffers from fading magnetism over time and “sticky shed”

The structural base of most magnetic tape is a thick layer of polyester, although in older audio tape it can be acetate, paper or polyvinyl chloride. Whatever the base, information is encoded in a thin coating of magnetic particles embedded in a polyurethane-based binder. In the earliest tapes, these particles were made of iron oxide. Other magnetic particles have since come on the scene. Barium ferrite is less rust-prone and has a smaller particle size, allowing information to be encoded more densely. Chromium dioxide is ideal when a recording has a lot of high-frequency sound.

The range of frequency and volume that a tape can record, and the ease of recording and re-recording, are determined by the size of the particles, their range in size, and their orientation on the tape. Various lubricants make the tape flow smoothly through the player, plasticisers make it supple, and antifungal agents and antioxidants extend its life. There are also other ingredients whose identities are proprietary, says Eric Breitung, a conservation scientist at the US Library of Congress in Washington DC.

A common problem magnetic tape suffers from is “sticky shed”, which occurs when the polyurethane binder that holds magnetic particles on the tape begins to break down and leach out – when stored in humid conditions, for example. Even if the recording remains playable, the tapes can easily get stuck or ripped in machines. The fix is baking them to dry out moisture and restabilize the polyurethane by heating them to  50 °C from hours to weeks.


Posted in Preservation of Knowledge | 1 Comment

E. O. Wilson to save humanity from extinction, get rid of religion

[ Below is an excerpt, out of order, from New Scientist’s 21 Jan 2015 interview with E.O. Wilson “Religious faith is dragging us down“. The extinctions we cause will kill us too, says the sociobiology pioneer – the best thing would be to eliminate religions]

Why is biodiversity loss suicidal for humans?

The major theme of my upcoming book will be that we are destroying Earth in a way that people haven’t appreciated enough, and that we are eroding away the biosphere through species extinction, like the death of a thousand cuts.

I want to examine the new ideology of the anthropocene – namely those who believe that the fight for biodiversity is pretty much lost and we should just go on humanizing Earth until it is peopled from pole to pole; a planet by, of and for humanity. It sounds good, but it’s suicidal.

The biosphere is an extremely complex system, and razor thin: if you look at it from the side, from orbit, you can’t even see it with unaided vision. That’s where we live, and that’s what produced us, plastered on the surface of our planet. We were not just created separately in some manner and then lowered into the biosphere. Everything about us – our minds, our bodies – is conditioned to exist in those exact conditions created by our biosphere.

The beautiful equilibrium of the living world is a result of all the species, plants, animals and microorganisms around us. As it is eroded away, the living world is almost certainly going to reach a tipping point where its equilibrium is going to decay and unravel. And when that happens, the whole thing collapses – and we collapse with it.

JG: Why does our species seem to ignore scientific warnings about Earth’s future?

WILSON: I think primarily it’s our tribal structure. All the ideologies and religions have their own answers for the big questions, but these are usually bound as a dogma to some kind of tribe. Religions in particular feature supernatural elements that other tribes – other faiths – cannot accept. In the US, for example, if you’re going to succeed in politics, it’s a prerequisite to declare you have a faith, even if some of these faiths are rather bizarre. And what they’re saying is “I have a tribe”. And every tribe, no matter how generous, benign, loving and charitable, nonetheless looks down on all other tribes. What’s dragging us down is religious faith.

The important thing is that it appears that humans, as a species, share a religious impulse. You can call it theological, you can call it spiritual, but humans everywhere have a strong tendency to wonder about whether they’re being looked over by a god or not. Practically every person ponders whether they’re going to have another life. These are the things that unite humanity.

[Our built-in] transcendent searching has been hijacked by the tribal religions. So I would say that for the sake of human progress, the best thing we could possibly do would be to diminish, to the point of eliminating, religious faiths. But certainly not eliminating the natural yearnings of our species or the asking of these great questions.

The question I most want answered now is whether or not there’s life on other planets. I’ve just got to know!

Jason Grow (JG): Your new book, The Meaning of Human Existence, addresses a huge question. What inspired you to tackle it?
Wilson: I think it’s time to be audacious. The central questions of religion and philosophy are three in number: where do we come from, what are we and where are we going? We now have a pretty good picture of how humanity arose in Africa, what intermediate forms existed, the rate at which these forms evolved and the circumstances in which they evolved. So of those three great questions, we have most of the answer for where we come from. And in this book I take up the question: what are we? We’re starting to close in on that one. We need to know where we came from and what we are to have the self-understanding to sensibly plan where we’re going.

JG:  So will you examine humanity’s future next?

Wilson: I’m writing a trilogy. The first was The Social Conquest of Earth, which dealt with where we come from. The Meaning of Human Existence deals with what we are. And the final part, The End of the Anthropocene, will look at where we are going.

[ Religion is the main reason birth control and abortion are illegal or hard to get. Obviously one child per woman would be the most humane solution to declining energy and natural resources (see posts on population). Overpopulation has led to massive pollution of land, air, and water, the destruction of (rain)forests, biodiversity, fisheries, topsoil, clean water, and every other problem facing us.

What little control women have had over their lives and fates during this brief age of oil is likely to vanish after civilization collapses and  energy slaves are replaced with human slaves. Although many Hindu, Muslim, and other conservative religious women aren’t considered “slaves”, they often have no control over who they marry, family planning, careers, ability to travel, the chance to become educated.  Which is damn close to being slavery.  Getting rid of religion will never happen, we’re hardwired for it, and consequently the Biblical phrase “Be fruitful and multiply, and fill the earth, and subdue it; and rule over the fish of the sea and over the birds of the sky and over every living thing that moves on the earth” has the potential to drive us and most other species extinct.    Alice Friedemann   www.energyskeptic.com  ]

Posted in Biodiversity Loss, Extinction, Scientists Warnings to Humanity, World's Best Scientists | Tagged , , , | 3 Comments

Corrosion eats $552 billion of infrastructure a year (6% of GDP)

Preface. United States infrastructure was built when the EROI of oil was very high and minerals and metals were cheap due to high ore concentrations. This study was done in 2002, since then, things have gotten much worse (see ASCE 2013 Infrastructure report card). ASCE estimates the bill to fix corrosion is now $3.6 trillion.

Globalization was made possible by really large ships that can be up to 80 times more energy efficient than trucks, and carry up to 90% of internationally traded goods. Yet these behemoths last only 29 years on average before they’re scrapped, and double-hulls have made super-rust possible, accelerating corrosion.

Alice Friedemann   www.energyskeptic.com  author of  “Life After Fossil Fuels: A Reality Check on Alternative Energy”, 2021, Springer; “When Trucks Stop Running: Energy and the Future of Transportation”, 2015, Springer; Barriers to Making Algal Biofuels, and “Crunch! Whole Grain Artisan Chips and Crackers”. Podcasts: Collapse Chronicles, Derrick Jensen, Practical Prepping, KunstlerCast 253, KunstlerCast278, Peak Prosperity , XX2 report

***

USDOT. March 2002. Corrosion cost and preventive strategies in the United States. U.S. Department of transportation, Federal highway administration. 784 pages.

NACE. Corrosion costs and preventive strategies in the United States.

cost of corrosion per economic sector in $ billions

cost of corrosion per economic sector in $ billions

Cost of corrosion in industry categories

Summary of Total Cost

The cost of corrosion was estimated for the individual economic sectors. The total cost due to the impact of corrosion was $137.9 billion per year. Since not all economic sectors were examined, the sum of the estimated costs does not represent the total cost of corrosion to the entire U.S. economy. By estimating the percentage of U.S. GDP of the sectors for which corrosion costs were not determined and extrapolating the cost numbers to the entire U.S. economy, a total cost of corrosion of $276 billion was estimated. This is approximately 3.1 percent of the nation’s GDP. The indirect corrosion costs (i.e., the costs incurred by other than owners and operators as a result of corrosion) are conservatively estimated to be equal to the direct cost; giving a total direct plus indirect cost of $552 billion (6 percent of the GDP). Evidence of the large indirect corrosion costs are: (1) lost productivity because of outages, delays, failures, and litigation; (2) taxes and overhead on the cost of corrosion portion of goods and services; and (3) indirect costs of non-owner/operator activities.

Infrastructure

cost of corrosion infrastructure

The U.S. infrastructure and transportation system allows for a high level of mobility and freight activity for the nearly 270 million residents and 7 million business establishments. In 1997, more than 230 million motor vehicles, ships, airplanes, and railroad cars were used on 6.4 million km (4 million mi) of highways, railroads, and waterways connecting all parts of the United States. The transportation infrastructure also includes more than 800,000 km (approximately 500,000 mi) of oil and gas transmission pipelines, 8.5 million tanks for hazardous materials storage, and 18,000 public and private airports. The annual direct cost of corrosion in the infrastructure category is estimated at $22.6 billion.

Highway Bridges: Based on the National Bridge Inventory Database, there are 586,000 bridges in the United States, half built between 1950 and 1994. Of this total, 435,000 bridges are made from steel and conventional reinforced concrete, 108,000 bridges are constructed using pre-stressed concrete, and the balance is made using other materials of construction. Approximately 15 percent of the bridges are structurally deficient, primarily due to corrosion of steel and steel reinforcement. The dollar impact of corrosion on highway bridges is considerable. The annual direct cost of corrosion for highway bridges is estimated to be $8.3 billion, consisting of $3.8 billion for the annual cost to replace structurally deficient bridges over the next 10 years, $2.0 billion for maintenance and cost of capital for concrete bridge decks, $2.0 billion for maintenance and cost of capital for concrete substructures (minus decks), and $0.5 billion for maintenance painting of steel bridges. Life-cycle analysis estimates indirect costs to the user due to traffic delays and lost productivity at more than 10 times the direct cost of corrosion.

Conventional Reinforced-Concrete Bridges. The primary cause of reinforced-concrete bridge deterioration is chloride-induced corrosion of the black steel reinforcement, resulting in expansion forces in the concrete that produce cracking and spalling of the concrete. The chloride comes from either marine exposure or the use of deicing salts for snow and ice removal. Because the use of deicing salts is likely to continue, if not increase, little can be done to prevent bridge structures from being exposed to corrosive chloride salts.

The expected service life of a newly constructed bridge is typically 75 years and up to 120 years for stainless steel rebar construction.

Steel Bridges. The primary cause of corrosion of steel bridges is the exposure of the steel to atmospheric conditions. This corrosion is greatly enhanced due to marine (salt spray) exposures and industrial environments. The only corrosion prevention method for these structures is to provide a barrier coating (paint).

Gas and Liquid Transmission Pipelines: There are more than (328,000 mi) of natural gas transmission and gathering pipelines, (74,000 mi) of crude oil transmission and gathering pipelines, and (82,000 mi) of hazardous liquid transmission pipelines. For all natural gas pipeline companies, the total investment in 1998 was $63.1 billion, from which a total revenue of $13.6 billion was generated. For liquid pipeline companies, the investment was $30.2 billion, from which a revenue of $6.9 billion was generated. At an estimated replacement cost of ($1,117,000 per mi), the asset replacement value of the transmission pipeline system in the United States is $541 billion; therefore a significant investment is at risk with corrosion being the primary factor in controlling the life of the asset. The average annual corrosion-related cost is estimated at $7.0 billion, which can be divided into the cost of capital (38 percent), operation and maintenance (52, percent), and failures (10 percent). With a range of corrosion O&M cost of $3,100 to $6,200 per krn ($5,000 to $10,000 per mi), the total corrosion O&M cost ranges from $2.42 billion to $4.84 billion.

If corrosion is allowed to progress unchecked, the integrity of the pipeline will eventually be compromised. Depending on the flaw size, the pipeline material properties, and the pressure, either a leak will form or a rupture will occur. Typically, a rupture of a high-pressure natural gas pipeline results in a sufficient release of stored energy to blow the pipeline out of the ground. An annual direct cost of corrosion-related accidents for both gas and liquid pipelines is estimated to range from $471 million to $875 million.

A liquid (non-compressible) pipeline has less stored energy than a natural gas pipeline; therefore. a rupture does not immediately result in a major explosion. However, once leaked out into the environment, a major explosion can occur upon ignition of an explosive liquid product. For a hazardous liquid product pipeline, the environmental impact can be as significant as the risk of an explosion. The risk of an oil leak from the TransAlaskan pipeline, for example, has continued to be the primary driver for the aggressive corrosion prevention and inspection program maintained by the operator. Of major concern is the risk of product leakage into surface waters, thereby, contaminating water supplies.

Corrosion of the pipe wall can occur either internally or externally. Internal corrosion occurs when corrosive liquids or condensates are transported through the pipelines. Depending on the nature of the corrosive liquid and the transport velocity, different forms of corrosion may occur, including uniform corrosion, pitting/crevice corrosion, and erosion-corrosion. Figure 3 shows an example of internal corrosion that occurred in a crude oil pipeline due to high levels of saltwater and carbon dioxide (CO2).

There are several different modes of external corrosion identified on buried pipelines. The primary mode of corrosion is a macro-cell form of localized corrosion due to the heterogeneous nature of soils, local damage of the external coatings (holidays), and/or the disbandment of external coatings. Figure 4 shows typical external corrosion on a buried pipeline. The 25-mm-(1 -in-) grid pattern was placed on the pipe surface to permit sizing of the corrosion and nondestructive evaluation (NDE) wall thickness measurements.

Stray Current Corrosion. Corrosion can be accelerated through ground currents from dc sources. Electrified railroads, mining operations, and other similar industries that utilize large amounts of dc current sometimes allow a significant portion of current to use a ground path return to their power sources. These currents often utilize metallic structures (pipelines) in close proximity as a part of the return path. This “stray” current can be picked up by the pipeline and discharged back into the soil at some distance down the pipeline close to the current return. Current pick-up on the pipe is the same process as cathodic protection, which tends to mitigate corrosion. The process of current discharge off the pipe and through the soil of a dc current accelerates corrosion of the pipe wall at the discharge point. This type of corrosion is called stray current corrosion.

Microbiologically Influenced Corrosion (MIC). Microbiologically influenced corrosion (MIC) is defined as corrosion that is influenced by the presence and activities of microorganisms, including bacteria and fungi. It has been estimated that 20 to 30 percent of all corrosion on pipelines is MIC-related. MIC can affect either the external or the internal surfaces of a pipeline. Microorganisms located at the metal surface do not directly attack the metal or cause a unique form of corrosion. The byproducts from the organisms promote several forms of corrosion, including pitting, crevice corrosion, and under-deposit corrosion. Typically, the products of a growing microbiological colony accelerate the corrosion process by either: (1) interacting with the corrosion products to prevent natural film-forming characteristics of the corrosion products that would inhibit firther corrosion, or (2) providing an additional reduction reaction that accelerates the corrosion process. A variety of bacteria have been implicated in exacerbating corrosion of underground pipelines and these fall into the broad classifications of aerobic and anaerobic bacteria. Obligate aerobic bacteria can only survive in the presence of oxygen, while obligate anaerobic bacteria can only survive in its absence. A third classification is facultative aerobic bacteria that prefer aerobic conditions, but can live under anaerobic conditions. Common obligate anaerobic bacteria implicated in corrosion include sulfate reducing bacteria (SRB) and metal-reducing bacteria. Common obligate aerobic bacteria include metal-oxidizing bacteria, while acid-producing bacteria are facultative aerobes. The most aggressive attacks generally take place in the presence of microbial communities that contain a variety of types of bacteria. In these communities, the bacteria act cooperatively to produce conditions favorable to the growth of each species. For example, obligate anaerobic bacteria can thrive in aerobic environments when they are present beneath biofilms/deposits in which aerobic bacteria consume the oxygen. In the case of underground pipelines, the most aggressive attack has been associated with acid-producing bacteria in such bacterial communities

Stress Corrosion Cracking. A particularly detrimental form of pipeline corrosion is known as stress corrosion cracking (SCC). SCC is defined as the brittle fracture of a normally ductile metal by the conjoint action of a specific corrosive environment and a tensile stress. On underground pipelines, SCC affects only the external surface of the pipe, which is exposed to soil and groundwater at locations where the coating is disbonded. The primary component of the tensile stress on an underground pipeline is in the hoop direction and results from the operating pressure. Residual stresses from fabrication, installation, and damage in service contribute to the total stress. Individual cracks initiate in the longitudinal direction on the outside surface of the pipe. The cracks typically occur in colonies that may contain hundreds or thousands of individual cracks. Over time, the cracks in the colonies interlink and may cause leaks or ruptures once a critical-size flaw is achieved. Figure 7 shows an SCC hydrostatic test failure on a high-pressure gas pipeline (see later section on hydrostatic testing). The two basic types of SCC on underground pipelines that have been identified are classical or “high pH” cracking (pH 9 to lo), which propagates intergranularly, and “near-neutral pH” cracking, which propagates transgranularly. Each form of SCC initiates and propagates under unique environmental conditions. Near-neutral pH SCC (< pH 8) is most commonly found on pipelines with polyethylene tape coatings that shield the cathodic protection current.(5) The environment that develops beneath the tape coating and causes this form of cracking is dilute carbonic acid. Carbon dioxide from the decay of organic material in the soil dissolves in the electrolyte beneath the disbonded coating to form the carbonic acid solution. High-pH SCC is most commonly found on pipelines with asphalt or coal tar coatings. The high-pH environment is a concentrated carbonate bicarbonate solution that develops as a result of the presence of carbon dioxide in the groundwater and the cathodic protection system.

Fresh Water. Airborne or splash zone attack is normally not a problem at freshwater facilities; however, air pollution can cause potential problems. Under certain flow conditions, such as turbulent flow or cavitation, fresh water can cause severe corrosion to submerged metallic elements. Ice damage also can limit the effectiveness of coatings on bulkhead walls and support piling. Piers and docks, bulkheads and retaining walls, locks. dams, and navigational aids exposed to freshwater environment experience corrosion-related problems. The most common areas of attack include submerged and splash zones on support piles (piers. docks, and navigational aids) and steel sheet piling (bulkheads and retaining walls). These zones are also found on locks (steel gates, hinges. intake’discharge culverts, valves, and sheet pile walls), dams (steel gates, hinges. intakeidischarge culverts. grates, and debris booms). and navigational aids (anchorages).

Hazardous Materials Storage: There are approximately 8.5 million regulated and non-regulated aboveground storage tanks (ASTs) and underground storage tanks (USTs) for hazardous materials (HAZMAT) in the United States. While these tanks represent a large investment, and good maintenance practices would be in the best interest of the owners, federal and state environmental regulators are concerned with the environmental impact of spills from leaking tanks. In 1988, the US. Environmental Protection Agency set a December 1998 deadline for UST owners to comply with the requirement to have corrosion control on all tanks, as well as overfill and spill protection. Thus, tank owners face considerable costs related to clean-up and penalties imposed by the government if they would not be in compliance. It is estimated that the annual cost of corrosion for ASTs is $4.5 billion and for USTs is $2.5 billion per year, resulting in a total annual direct corrosion cost of $7.0 billion.

The largest costs are incurred when leaking USTs must be replaced with new tanks. The soil remediation costs and oil spill clean-up costs are significant as well. In the last 10 years, the most common problem associated with USTs occurred at gasoline service stations that did not have corrosion protection on their USTs.

Utilities

cost of corrosion utilities

Utilities form an essential part of the US, economy by supplying gas, water, electricity, and communication. All utility companies combined spent $42.3 billion on capital goods in 1998, an increase of 9 3 percent from 1997. Of this total, $22.4 billion was used for structures and $19.9 billion was used for equipment. The total annual direct cost of corrosion in the utility category is estimated to be $47.9 billion.

Gas Distribution: The natural gas distribution system includes 1,730,000 miles of relatively small-diameter, low-pressure piping, which is divided into 1,080,000 miles of distribution main and 650,000 miles of services. There are approximately 55 million services in the distribution system. A large percentage of the mains (57 percent) and services (46 percent) are made of steel, cast iron, or copper, which are subject to corrosion. The total annual direct cost of corrosion was estimated at approximately $5.0 billion.

The typical distribution of piping diameters is between 40 mm and 150 mm (1.5 in and 6 in) for main distribution piping and 13 mm to 20 mm (0.5 in to 0.75 in) for service piping. A small percentage of mains and services is larger diameter pipe, typically for commercial and industrial application. Several different materials have been used for distribution piping. Historically, distribution mains were primarily made of carbon steel pipe; however, since the 1970s, a large portion of the gas distribution main lines have been made of plastic, mostly polyethylene (PE), but sometimes polyvinyl chloride (PVC). A large percentage of mains (57 percent) and services (46 percent) are made of metal (steel, cast iron, or copper). The methods for monitoring corrosion on the lines are the same as those used for transmission pipelines; however, leak detection is the most widely used technique.

Drinking Water and Sewer Svstems: According to the American Waterworks Association (AWWA) industry database, there is approximately 876,000 mi of municipal water piping in the United States. This number is not exact, since most water utilities do not have complete records of their piping system. The sewer system consists of approximately 16,400 publicly owned treatment facilities releasing some 155 million m3 41 billion gallons) of wastewater per day (1995). The total annual direct cost of corrosion for the nation’s drinking water and sewer systems was estimated at $36.0 billion. This cost was contributed to by the cost of replacing aging infrastructure. the cost of unaccounted-for water through leaks, the cost of corrosion inhibitors, the cost of internal mortar linings, and the cost of external coatings and cathodic protection.

Americans consume and use approximately 550 L of drinking water per person per day, for a total annual quantity of approximately 56.7 billion m’. The treated drinking water is transported through 1.4 million km of municipal water piping. The water piping is subject to internal and external corrosion. resulting in pipe leaks and water-main breaks. The total cost of corrosion for the drinking water and sewer systems includes the cost of replacing aging infrastructure. the cost of unaccounted-for water, the cost of corrosion inhibitors, the cost of internal cement mortar linings, the cost of external coatings, and the cost of cathodic protection.

In March 2000, the Water Infrastructure Network WIN) estimated the current annual cost for new investments, maintenance, operation, and financing of the national drinking water system at $38.5 billion per year, and of the sewer system at $27.5 billion per year. The total cost of corrosion was estimated from these numbers by assuming that at least 50 percent of the maintenance and operation costs are for replacing aging (corrosion) infrastructure, while the other 50 percent would be for system expansions. This results in an estimated cost of corrosion for drinking water systems of $19.25 billion per year and for sewer systems of $13.75 billion per year. WIN stated that the current spending levels are insuficient to prevent large failure rates in the next 20 years. The WIN report was presented in response to a 1998 study(”) by AWWA and a 1997 study by the EPA. Those studies had already identified the need for major investments to maintain the aging water infrastructure. In addition to the costs for replacing aging infrastructure, there is the cost for unaccounted-for water. One city reported a constant percentage of unaccounted-for water of 20 percent in the last 25 years, with 89 percent of its main breaks directly related to corrosion. Nationally, it is estimated that approximately 15 percent of the treated water is lost. The treatment of water that never reaches the consumer results in inflated prices (national lost water is estimated at $3.0 billion per year) and extra capacity in treatment facilities to produce the lost water. Adding these three major cost items results in a total annual cost of corrosion of $36.0 billion per year for drinking water and sewer systems combined.

Electrical Utilities: The electrical utility industry is a major provider of energy in the United States. The total amount of electricity sold in the United States in 1998 was 3,240 billion GWh at a cost to the consumers of $218 billion. Electricity generation plants can be divided into seven generic types: fossil fuel, nuclear, hydroelectric, cogeneration, geothermal, solar, and wind. The majority of electric power in the United States is generated by fossil and nuclear supply systems. The total annual direct cost of corrosion in the electrical utility industry in 1998 is estimated at $6.9 billion, with the largest amounts for nuclear power at $4.2 billion and fossil fuel at $1.9 billion, and smaller amounts for hydraulic and other power at $0.15 billion, and transmission and distribution at $0.6 billion.

The fossil fuel sector (including gas turbines and combined cycle plants) is the largest, with a generating capacity of approximately 488 GW, and a total generation of 2.2 million GWh in 1998. In 1998, approximately 102 nuclear stations were operational, with a generating capacity of 97.1 GW, and a total generation of 0.67 million GWh.

The total direct cost of corrosion in the electric utility industry in 1998 is estimated at $6.889 billion per year. In comparison, an Electric Power Research Institute (EPRI) study(“‘ estimated the cost of corrosion to the user/consumer to be $17.27 billion per year.

Because of the complex and often corrosive environments in which power plants operate, corrosion has been a serious problem, with a significant impact on the operation of the plants. In the 1970s and the 1980s, major efforts were spent on understanding and controlling corrosion in both nuclear and fossil fuel steam plants, and significant progress was made. However, with the aging of several plants, old problems persist and new ones appear. For example, corrosion continues to be a problem with electrical generators and with turbines. Specifically, stress corrosion cracking in steam generators in PWR plants and boiler tube failures in fossil fuel plants continue to be problems. There are further indications that aging of buried structures, such as service water piping, has started to result in leaks that cannot be tolerated

Telecommunications: The telecommunications infrastructure includes hardware such as electronics, computers, and data transmitters, as well as equipment shelters and the towers used to mount antennas, transmitters, receivers, and television and telephone systems. According to the U.S. Census Bureau, the total value of shipments for communications equipment in 1999 was $84 billion. An important factor for corrosion cost is the additional cost of protecting towers and shelters, such as painting and galvanizing. In addition, corrosion of buried copper grounding beds, as well as galvanic corrosion of the grounded steel structures, contributes to the corrosion cost. For this sector, no corrosion cost was determined because of the lack of information on this rapidly changing industry. Many components are being replaced before physically failing because the technology has become obsolete in a short period of time.

Transportation

cost of corrosion transportation

The transportation category includes vehicles and equipment, such as motor vehicles, aircraft. railroad cars, and hazardous materials transport, that make use of the U.S. highways, waterways, railroads, and airports. The annual cost of corrosion in the transportation category is estimated at $29.7 billion.

Motor Vehicles: U.S. consumers, businesses, and government organizations own more than 200 million registered motor vehicles. Assuming an average value of $5,000, the total investment Americans have made in motor vehicles can be estimated at more than $1 trillion. Since the 1980s, car manufacturers have increased the corrosion resistance of vehicles by using corrosion-resistant materials, employing better manufacturing processes, and by designing corrosion-resistant vehicles. Although significant progress has been made, further improvement can be achieved in the corrosion resistance of individual components, such as fuel and brake systems, and electrical and electronic components. The total annual direct cost of corrosion is estimated at $23.4 billion, which is divided into the following three components: (1) increased manufacturing costs due to corrosion engineering and the use of corrosion-resistant materials ($2.56 billion per year), (2) repairs and maintenance necessitated by corrosion ($6.45 billion per year), and (3) corrosion-related depreciation of vehicles ($14.46 billion per year).

The total cost of corrosion to owners of motor vehicles is estimated at $23.4 billion per year or 79 percent of the Transportation category (see figure 13). This cost is divided into the following three components: (1) increased manufacturing costs due to corrosion engineering and the use of corrosion-resistant materials ($2.56 billion per year), (2) repairs and maintenance necessitated by corrosion ($6.45 billion per year), and (3) corrosion-related depreciation of vehicles ($14.46 billion per year).

Ships: The U.S. flag fleet can be divided into several categories as follows: the Great Lakes with 737 vessels at (62 billion ton-mi), inland with 33,668 vessels at (294 billion ton-mi), ocean with 7,014 vessels at (350 billion ton-mi), recreational with 12.3 million boats, and cruise ship with 122 boats serving North American ports (5.4 million passengers). The total annual direct cost of corrosion to the U.S. shipping industry is estimated at $2.7 billion. This cost is divided into costs associated with new construction ($1.1 billion), with maintenance and repairs ($0.8 billion), and with corrosion-related downtime ($0.8 billion).

Railroads: In 1997, there were nine Class I freight railroads (railroads with operating revenues of more than $256.4 million). These railroads accounted for 71 percent of the industry’s (170,508 mi) of railroad. There were 35 regional railroads (those with operating revenues between $40 million and $256.4 million and/or operating at least 560 km (350 mi) of railroad). The regional railroads operated 34,546 km (21,466 mi) of railroad. Finally, there were 5 13 local railroads operating more than 45,300 km (28,149 mi) of railroad. The elements that are subject to corrosion include metal members, such as rail and steel spikes; however, corrosion damage to railroad components are either limited or go unreported. Hence, a corrosion cost could not be determined.

One area where corrosion has been identified is in electrified rail systems, such as those used for local transit authorities. Stray currents from the electrified systems can inflict significant and costly corrosion on non-railroad-related underground structures such as gas pipelines, waterlines, and underground storage tanks.

Railroad Cars: In 1998, 1.47 million freight cars and 1,962 passenger cars were reported to operate in the United States. Covered hoppers at 28 percent make up the largest portion of the freight-car fleet, with tanker cars making up the second largest portion at 18 percent. The type of commodities transported range from coal (largest volume) to chemicals, motor vehicles, farm products, food products, and metallic and non-metallic ores and minerals. Railroad cars suffer from both external and internal corrosion. It is estimated that the total annual direct cost of corrosion is approximately $0.5 billion, divided over external coatings ($0.25 billion) and internal coatings and linings ($0.25 billion).

It is estimated that the total annual corrosion-related maintenance cost for railroad cars is approximately $504 million ($958 million for external coatings and $246 niillion for internal coatings and liners

The rate of corrosion has to be controlled in order to: ( 1) prolong the service life of the car. (2) prevent contamination of the transported product, such as food products or high-purity chemicals, and (3) prevent hazardous spills that could contaminate the environment and pose a public safety hazard. Protection from internal corrosion is achieved by using organic coating systems or rubber linings. As an alternative. cars for certain corrosive cargo services are manufactured from corrosion-resistant materials, such as aluminum or stainless steel. which raises the price of a car twofold.

Waterways and Ports: In the United States, (25,000 mi) of commercial navigable waterways serve 41 states, including all states east of the Mississippi River. Hundreds of locks facilitate travel along these waterways. In January 1999, 135 of the 276 locks had exceeded their 50-year design life. The oldest operating locks in the United States are Kentucky River Locks 1 and 2. U.S. ports play an important role in connecting waterways, railroads, and highways. The nation’s ports include 1,914 deep-water (seacoast and Great Lakes) and 1,812 along inland waterways. Corrosion is typically found in piers and docks. bulkheads and retraining walls, mooring structures, and navigational aids. There is no formal tracking of corrosion-related costs. The U.S. Army Corps of Engineers estimated annual corrosion-related costs for locks and dams to be approximately $70 million at 5 percent of the O&M budget of $1.4 billion.(39′ Because of the aging of the structures however, high replacement costs are anticipated due, in part, to corrosion. The annual corrosion cost of ports and waterways owned and/or operated by public port authorities is estimated at $182 million.’401 The U.S. Coast Guard maintains navigational aids such as light structures, buoys, and other saltwater and freshwater exposed structures. In 1999, the corrosion-related cost for maintaining these structures was estimated at $4 1 million. The total annual cost of corrosion for waterways and ports is $293 million ($70 million + $1 82 million + $4 1 million). This must be a low estimate since the costs of harbor and other marine structures are not included.

The reinforced-concrete structures exposed to the marine environment suffer premature corrosion-induced deterioration by chlorine ions in seawater. Corrosion is typically found in piers and docks, bulkheads and retaining walls, mooring structures, and navigational aids. The marine environment can have varying effects on different materials depending on the specific zones of exposure. Atmosphere, splash, tide, immersion, and subsoil have very different characteristics and, therefore, have different influences on corrosion. Atmospherically exposed submerged zones and splash zones typically experience the most corrosion. These zones are found on piers and docks (ladders, railings, cranes, and steel support piles), bulkheads and retaining walls (steel sheet piling, steel-reinforced concrete elements, backside, and anchors on structures retaining dredged fill), and mooring structures and dams (steel gates, hinges, intakeidischarge culverts, grates, and debris booms). Stationary navigational aids suffer from corrosion of support piles and steel-reinforced concrete pile caps. Floating steel buoys are subject to corrosion as well.

Aircraft: In 1998, the combined aircraft fleet operated by U.S. airlines was more than 7,000, of which approximately 4,000 were turbojets. The fleet includes the Boeing 707, DC-9, Boeing 727, DC-10, and the earlier versions of the Boeing 737 and 747. At the start of the jet age (1950s to 1960s), little or no attention was paid to corrosion and corrosion control. One of the concerns is the continued aging of the airplanes beyond the 20-year design life. Only the most recent designs (Boeing 777 and late version 737) have incorporated significant improvements in corrosion prevention and control in design and manufacturing. The total annual direct cost of corrosion to the U.S. aircraft industry is estimated at $2.2 billion, which includes the cost of design and manufacturing ($0.2 billion), corrosion maintenance ($1.7 billion), and downtime ($0.3 billion).

The annual (1996) corrosion cost to the U.S. aircraft industry is estimated at $2.225 billion, which includes the cost of design and manufacturing at $0.225 billion, corrosion maintenance at $1.7 billion, and downtime due to corrosion at $0.3 billion (see figure 15). With the availability of new corrosion-resistant materials and an increased awareness of the importance of corrosion to the integrity and operation ofjet aircraft, the current design service life of 20 years has been extended to 40 years without jeopardizing structural integrity and significantly increasing the cost of operation.’

Airports: The United States has the world’s most extensive airport system, which is essential to national transportation and the U.S. economy. According to 1999 Bureau of Transportation Statistics figures, there were 5.324 public-use airports and 13,774 private-use airports in the United States. A typical airport infrastructure is complex. and components that might be subject to corrosion include the natural gas distribution system, jet fuel storage and distribution system, deicing storage and distribution system, vehicle fueling systems, natural gas feeders, dry fire lines, parking garages, and runway lighting. Generally, each of these systems is owned or operated by different organizations or companies; therefore, the impact of corrosion on an airport as a whole is not known or documented. However, the airports do not have any specific corrosion-related problems, that have not been described elsewhere in this report.

Hazardous Materials Transport: According to U.S .Department of transportation, there are approximately 300 million hazardous materials shipments of more than 3.1 billion metric tons annually in the United States. Bulk transportation of hazardous materials includes overland shipping by tanker truck and rail car, and by special containers that are loaded onto vehicles. Over water, ships loaded with specialized containers, tanks, and drums are used. In small quantities, hazardous materials require specially designed packaging for truck and air shipment. The total annual direct cost of corrosion for hazardous materials transport is more than $0.9 billion. The elements of the annual corrosion cost include the cost of transporting vehicles ($0.4 billion per year), the cost of specialized packaging (S0.5 billion per year), and the direct and indirect costs ($0.5 million per year and an unknown value, respectively) of accidental releases and corrosion-related transportation incidents.

The total cost of corrosion for HAZMAT transportation is at least $0.887 billion per year (see figure 17). The elements of this cost include the corrosion-related cost of transport vehicles ($400 million per year), the cost of specialized packaging ($487 million per year), and the direct cost of $0.5 million per year of accidental releases and other corrosion-related transportation incidents. The indirect costs of releases are not known.

Production and Manufacturing

cost of corrosion production and manufacturing

This category includes industries that produce and manufacture products of crucial importance to the U.S. economy and the standard of living in the United States. These include oil production, mining, petroleum refining, chemical and pharmaceutical production, and agricultural and food production. The total annual direct cost of corrosion in this category was estimated to be $17.6 billion.

Oil and Gas Exploration and Production: Domestic oil and gas production can be considered to be a stagnant industry, because most of the significant available onshore oil and gas reserves have been exploited. Oil production in the United States in 1998 consisted of 3.04 billion barrels. The significant recoverable reserves left to be discovered and produced are probably limited to less convenient locations such as in deep water offshore, remote arctic locations, and difficult-to-manage reservoirs with unconsolidated sands. The total annual direct cost of corrosion in the U.S, oil and gas production industry is estimated at $1.4 billion, made up of $0.6 billion for surface piping and facility costs, $0.5 billion in downhole tubing expenses, and $0.3 billion in capital expenditures related to corrosion.

The majority of cost-savings for any oil production facility is in the prevention of failure in one of the production arteries, such as downhole tubing, surface pipelines, and production vessel. Downhole tubing, surface pipelines, pressure vessels, and storage tanks in oil and gas production are subject to internal corrosion by water, which is enhanced by the presence of CO2 and H2S in the gas phase. Internal corrosion control is a major cost item consideration. The total cost of corrosion in the U.S. oil and gas production industry is estimated to be $1.372 billion annually, made up of $589 million for surface piping and facility costs. $463 million in downhole tubing expenses, and $320 million in capital expenditures related to corrosion.

Mining: In the mining industry, corrosion is not considered to be a significant problem. There is a general consensus that the life-limiting factors for mining equipment are wear and mechanical damage rather than corrosion. Maintenance painting, however, is heavily relied upon to prevent corrosion, with an annual estimated expenditure for the coal mining industry of $0.1 billion.

Petroleum Refining: Petroleum is the single largest source of energy for the United States. The nation uses twice as much petroleum as either coal or natural gas. The U.S. refineries represent approximately 23% of the world’s petroleum production, and the United States has the largest refining capacity in the world, with 163 refineries. In 1996, U.S. refineries supplied more than 18 million barrels per day of refined petroleum products. The total annual direct cost of corrosion is estimated at $3.7 billion. Of this total, maintenance-related expenses are estimated at $1.8 billion, vessel turnaround expenses at $1.4 billion, and fouling costs are approximately $0.5 billion annually.

The total annual cost of corrosion for the petroleum refining industry is estimated at $3.692 billion, which is 2 1 percent of the Production and Manufacturing category (see figure 2 1). Of this total, maintenance-related expenses are estimated at $1.767 billion, vessel turnaround expenses at $1.425 billion, and fouling costs are approximately $0.500 billion annually. The costs associated with corrosion control in refineries include both the processing side and water handling. Corrosion-related issues regarding the processing side include the handling of organic acids, referred to as naphthenic corrosion, and sulfur species, particularly at high temperatures, as well as water carryover in processing vessels and pipelines. Water handling includes concerns with corrosives such as H2S, C02, chlorides, and high levels of dissolved solids.

Increasing regulation and pressure from environmental groups have forced the ref neries to implement defensive strategies where little attention is paid to improved corrosion control. This is compounded by overseas market forces, such as OPEC, which control the price of the feedstock oil. In a commodity-driven industry that is struggling to compete in the world market, investment in more effective corrosion control strategies often takes a backseat to across-the-board cost-cutting measures. The majority of pipelines and vessels in refineries are constructed of carbon steel, and opportunities for significant savings exist through the use of low-alloy steels and alloy-clad vessels, particularly as increasingly higher fractions of acidic crude oil are refined.

Chemical, Petrochemical, and Pharmaceutical: The chemical, petrochemical, and pharmaceutical industries play a major role in the U.S. economy by providing a wide range of products. The chemical industry includes those manufacturing facilities that produce bulk or specialty compounds by chemical reactions between organic and/or inorganic materials. The petrochemical industry includes those manufacturing facilities that create substances from raw hydrocarbon materials such as crude oil and natural gas. The pharmaceutical industry formulates, fabricates, and processes medicinal products from raw materials. The total annual direct cost of corrosion for this industry sector is estimated at $1.7 billion per year (8 percent of total capital expenditures). No calculation was made for the indirect costs of production outages or indirect costs related to catastrophic failures. The costs of operation and maintenance related to corrosion were not readily available; estimating these costs would require detailed study of data records of individual companies.

Pulp and Paper: The $165 billion pulp, paper, and allied product industry supplies the United States with approximately 300 kg of paper per person per year. More than 300 pulp mills and more than 550 paper mills support its production. The total annual direct cost of corrosion is estimated at $6.0 billion, with the majority of this cost in the paper and paperboard-making industry, and calculated as a fraction of the maintenance costs. No information was found to estimate the corrosion costs related to the loss of capital.

Agricultural: Agriculture operations are producing livestock, poultry, or other animal specialties and their products, and producing crops, including fruits and greenhouse or nursery products. According to the National Agricultural Statistics Service, there are approximately 1.9 million farms in the United States. Based on a 1997 census, the total value of farm machinery and equipment is approximately $15 billion per year. The two main reasons for replacing machinery or equipment include upgrading old equipment and substituting because of wear and corrosion. Discussions with people in this industrial sector resulted in an estimate of corrosion costs in the range of 5 percent to 10 percent of the value of all new equipment. The total annual direct cost of corrosion in the agricultural production industry is estimated at $1.1 billion.

Food Processing: The food processing industry is one of the largest manufacturing industries in the United States, accounting for approximately 14 percent of the total US, manufacturing output. Sales for food-processing companies totaled $265.5 billion in 1999. Because of quality-of-food requirements, stainless steel is widely used. Assuming that the stainless steel consumption and cost in this industry is entirely attributed to corrosion, a total annual direct cost of corrosion is estimated at 52.1 billion. This cost includes stainless steel usage for beverage production, food machinery, cutlery and utensils, commercial and restaurant equipment, appliances, aluminum cans, and the use of corrosion inhibitors.

Electronics: Corrosion in electronic components manifests itself in several ways. Computers, integrated circuits, and microchips are now an integral part of all technology-intensive industry products, ranging from aerospace and automotive to medical equipment and consumer products, and are therefore exposed to a variety of environmental conditions. Corrosion in electronic components are insidious and cannot be readily detected; therefore, when corrosion failure occurs, it is often dismissed as just a failure and the part or component is replaced. Particularly in the case of consumer electronics, devices would become technologically obsolete long before corrosion-induced failures would occur. However, capital-intensive industries, with significant investment in durable equipment with a considerable number of electronic components, such as the defense industry and the airline industry, tend to keep the equipment for longer periods of time, and corrosion is likely to become an issue. Although the cost of corrosion in the electronics sector could not be estimated, it has been suggested that a significant part of all electronic component failures are caused by corrosion.

Home Appliances The appliance industry is one of the largest consumer product industries. For practical purposes, two categories of appliances are distinguished: “Major Home Appliances” and “Comfort Conditioning Appliances.” In 1999, a total of 70.7 million major home appliances and a total of 49.5 million comfort conditioning appliances were sold in the United States, for a total of 120.2 million appliances. The cost of corrosion in home appliances includes the cost of purchasing replacement appliances because of premature failure due to corrosion. For water heaters alone, the replacement cost was estimated at $460 million per year, using a low estimate of 5 percent of the replacement being corrosion-related. The cost of internal corrosion protection for all appliances includes the use of sacrificial anodes ($780 million per year), corrosion-resistant materials (no cost estimate), and internal coatings (no cost estimate). The cost of external corrosion protection using coatings was estimated at $260 million per year. Therefore, the estimated total annual direct cost of corrosion in home appliances is at least $1.5 billion.

Government. Federal, state, and local governments play important roles in the U.S. economy with a 1998 GDP of approximately $1.1 trillion ($360 billion federal. $745 billion state and local). While the government owns and operates large assets under various departments, the US. Department of Defense (DOD) was selected for analysis because of its significant impact on the U.S. economy. A second government sectors elected is nuclear waste storage under the U.S. Department of Energy (DOE).

Defense: The ability of the DOD to respond rapidly to national security and foreign commitments can be adversely affected by corrosion. Corrosion of military equipment and facilities has been. for many years, a significant and ongoing problem. The corrosion-related problems are becoming more prominent as the acquisition of new equipment is decreasing and a large degree of reliability of aging systems is expected. The data provided by the military services (Army, Air Force, Navy, and Marine Corps) indicate that corrosion is potentially the number one cost driver in life-cycle costs. The total annual direct cost of corrosion incurred by the military services for both systems and infrastructure was estimated at $20 billion.

A considerable portion of the cost of corrosion to the Army is attributed to ground vehicles, including tank systems, fighting vehicle systems, fire support systems, high-mobility multipurpose wheeled vehicles (HMMWV), and light armored vehicles. Other systems that are affected by corrosion include fring platforms and helicopters. Many of the Army systems are well beyond their design service lives and because of generally aggressive operating environments, corrosion is becoming increasingly severe and costly. While often replacement of the aging systems is not budgeted, insufficient use is being made of existing technology to maintain these systems in a cost-effective manner. Even with the procurement of new equipment such as the HMMWV, the use of corrosion-resistant materials and design are often neglected in favor of quantity of procurement and system properties. In recent years, the Air Force has experienced considerable corrosion problems. As with the commercial aircraft industry, corrosion on airframes in the past has not been considered to have a significant impact on structural integrity; therefore, a “find and fix” approach has long been the preferred way to deal with corrosion in aircraft. With no significant hiding available for new system acquisition, the Air Force is forced to extend the operational life of many of the aircraft, such as the KC-135 tanker, far beyond their design service life

Nuclear Waste Storage: Nuclear wastes are generated from spent nuclear fuel, dismantled nuclear weapons, and products such as radio pharmaceuticals. The most important design item for the safe storage of nuclear waste is effective shielding of radiation. Corrosion is not considered a major issue in the transportation of nuclear wastes due to the stringent packaging requirements and the relatively short duration of the transport. However, corrosion is an important issue in the design of the casks used for permanent storage with a design life of several thousand years. A 1998 total life-cycle cost analysis by DOE for the permanent disposal of nuclear waste in Yucca Mountain, Nevada, estimated the total repository cost by the construction phase (2002) at $3.9 billion, with an average annual cost (from 1999 to 21 16) of 920.5 million. Of this cost, S42.2 million is corrosion-related.

NACE has a powerpoint of the 2002 study: http://www.nace.org/Publications/Cost-of-Corrosion-Study/

[ About this report: done from1999 to 2001 by CC Technologies Laboratories, Inc., with support from the FHWA and NACE. Its main activities included determining the cost of corrosion control methods and services, determining the economic impact of corrosion for specific industry sectors, extrapolating individual sector costs to a national total corrosion cost, assessing barriers to effective implementation of optimized corrosion control practices, and developing implementation strategies and cost-saving recommendations. ]


Posted in Bridges, Oil & Gas, Rail, Transportation Infrastructure | Tagged , , , , , , | 2 Comments

Coal plants are causing water shortages in China

Wong, E. March 22, 2016. Report Ties Coal Plants to Water Shortage in Northern China. New York Times.

China’s consumption of coal, a major contributor to climate change and the country’s horrific air pollution, is worsening a severe water shortage in the northern part of the country, Greenpeace said in a report released Tuesday. China’s coal-fired power plants consume more water where water is scarce than plants in any other country, according to the report, which assessed global water depletion from coal use.

A decades-long drought in northern China — home to the bulk of the country’s coal production and consumption — is worsening, and the central and local governments are grappling with widespread desertification. Officials have relocated millions of people. Beijing, the capital, where more than 20 million people live, has extremely low water levels.

The problem is so severe in the north that China has built an enormous series of canals, the South-North Water Diversion Project, to transport water hundreds of miles from the Yangtze River.

In much of northern China, people are using water faster than it can be regenerated, Greenpeace said, “posing a serious threat to local ecology.”

At the end of 2013, China had 45% of the world’s coal-fired power plants, with a total installed capacity of 804 gigawatts, according to research by Greenpeace and a summary of findings in its 60-page report, “The Great Water Grab.” Nearly half of the plants were in water-scarce areas, and those had a total annual water consumption of 3.4 billion cubic meters, enough to meet the basic needs of about 186 million people, the researchers found.

Across all of China, coal-fired power plants consume 7.4 billion cubic meters of water each year, enough to meet the needs of 406 million people, or about 30% of the nation’s population, according to the report.

Plants proposed for construction would worsen the problem, the report found. Half of those plants, which would have a total installed capacity of 237 gigawatts, would be built in water-scarce areas. They would consume 1.8 billion cubic meters of water, equal to the annual needs of 100 million people, the report said. The plants would cost about $100 billion to build, and they would worsen the country’s huge overcapacity in coal-fired power plants.

After China, the top countries with the highest water consumption by coal-fired plants in water-scarce areas were India, the United States, Kazakhstan and Canada. China also tops the list for proposed coal-fired plants in water-scarce areas, followed by India, Turkey, the United States and Kazakhstan.

The Greenpeace report was based on modeling done by a Dutch engineering firm, Witteveen & Bos. Data on existing and proposed coal-fired power plants at the end of 2013 was drawn mainly from Platts World Electric Power Plants Database.


Posted in China, Energy Production, Peak Water | Tagged , , , | Comments Off on Coal plants are causing water shortages in China

Don’t export LNG to Europe, they have their own natural gas

Preface. The congressional record is full of senators, representatives, and witnesses trying to sell U.S. shale “fracked” gas as LNG to Europe so that they aren’t beholden to Russia.  Well uh-oh, with the Russian invasion of Ukraine, the chickens have come home to roost, and there really aren’t good alternatives for Russian oil, which was especially suited for diesel fuel and was 10% of world oil production (though on the cusp of declining due to corruption with profits going into oligarch’s Swiss and offshore bank accounts rather than maintaining and improving the oil and natural gas infrastructure).

Hutzler is wrong by the way about Europe’s shale gas reserves — the infrastructure of pipelines isn’t there as it was in the U.S. for conventional oil and gas, the U.S. doesn’t have enough experts here in the U.S., the fracked sand may be difficult to get in Europe (essential for drilling), there are stricter rules on land use and environmental laws and s on.

Alice Friedemann  www.energyskeptic.com  Author of Life After Fossil Fuels: A Reality Check on Alternative Energy; When Trucks Stop Running: Energy and the Future of Transportation”, Barriers to Making Algal Biofuels, & “Crunch! Whole Grain Artisan Chips and Crackers”.  Women in ecology  Podcasts: WGBH, Planet: Critical, Crazy Town, Collapse Chronicles, Derrick Jensen, Practical Prepping, Kunstler 253 &278, Peak Prosperity,  Index of best energyskeptic posts

HRG. 113-623. 2014-7-22. U.S. Security implications of international energy and climate policies and issues. U.S. Senate 113th congress

MARY HUTZLER, DISTINGUISHED SENIOR FELLOW, INSTITUTE FOR ENERGY RESEARCH, BERLIN, MD

EUROPE ’S NATURAL GAS SUPPLIES

According to the Energy Information Administration, Europe has an estimated 470 trillion cubic feet of technically recoverable shale gas resources, around 80% of the U.S. estimated endowment of 567 trillion cubic feet. (1)

Europe is worried about continually receiving the 30% of its natural gas supplies that it receives from Russia, but instead of embracing hydraulic fracturing and horizontal drilling on domestic soil, it is looking toward the United States to export LNG to them.

According to a leaked document, the European Union is making its desire to import more oil and natural gas from the United States very clear in the discussions over the Transatlantic Trade and Investment Partnership (TTIP) trade deal. The EU is pressuring the United States to lift its ban on crude oil exports and make it easier to export natural gas to Europe. The EU emphasizes the TTIP’s role in ‘‘reinforcing the security of supply’’ of energy for the member countries, pointing to the political situation in the Ukraine as a key reason to relax rules against U.S. exports. ‘‘The current crisis in Ukraine confirms the delicate situation faced by the EU with regard to energy dependence,’’ the document states. ‘‘Of course the EU will continue working on its own energy security and broaden its strategy of diversification. But such an effort begins with its closest allies.’’ (2)

EU could start by developing its shale gas resources throughout its member countries.

Germany has proposed a prohibition against hydraulic fracturing through 2021.

France, which has the second-largest estimated shale gas resources in Europe, has a hydraulic fracturing ban through at least 2017

Bulgaria also forbids hydraulic fracturing. Poland, which has Europe’s largest technically recoverable shale gas resources at 148 trillion cubic feet, is interested in developing those resources, but has geology problems demonstrated by poor results from exploratory drilling. Several other European countries are now interested in developing their shale gas resources, such as the U.K., the Netherlands, Denmark, and Romania, but none of the European shale-gas exploration efforts are close to being ready for commercial development. (3)

(1) Energy Information Administration, Technically Recoverable Shale Oil and Shale Gas Resources: An Assessment of 137 Shale Formations in 41 Countries Outside the United States, June 2013.   EIA Detailed 145 page report on European Natural Gas

(2) Huffington Post, Secret Trade Doc Calls for More Oil and Gas Exports to Europe, July 8, 2014.

(3) Europe wants the energy, but not the fracking, July 15, 2014.

Posted in LNG Liquified Natural Gas, Oil & Gas Fracked | Tagged , , , | Comments Off on Don’t export LNG to Europe, they have their own natural gas

Why we need a diverse electricity generation portfolio: House hearing 2013

House 113-12. March 5, 2013. American Energy security and innovation. The role of a diverse electricity generation portfolio. House of Representatives. 135 pages.

  • June 5, 2015. Proposed Clean Power Plan would accelerate renewable additions and coal plant retirements. U.S. Energy Information Administration
  • Even without the Clean Power Plan rule (CPP), 40 GW of coal capacity is expected to retire by 2040. If the CPP is passed, between 90 to 101 GW of coal plants may retire (EIA June 5 2015).
  • The EIA expects 46 to 62 GW of natural gas plant retirements replaced by 166 GW.
  • Coal plant retirement 40.1 GW by 2025 EIA DOE 2015 Annual energy outlook with projections to 2040.

Even in the absence of the proposed Clean Power Plan rule, 40 GW of existing coal-fired capacity and 46 GW of existing natural gas/oil-fired capacity are expected to retire through 2040 in the Reference case. Cases that implement the proposed Clean Power Plan rule accelerate and amplify these retirements, especially for coal. In the Base Policy case, 90 GW of coal-fired capacity and 62 GW of natural gas/oil-fired capacity retire by 2040. In the Policy Extension case, as emission rates continue declining after 2030, 101 GW of coal-fired generating capacity and 74 GW of natural gas/oil-fired generating capacity retire by 2040. The timing of the coal retirements is heavily influenced by implementation of environmental rules that may require power plant operators to either incur costs to retrofit power plants or receive less revenue because of lower levels of operation. As a result, coal retirements occur during the implementation of the Mercury and Air Toxics rule (in both the Reference case and Base Policy case), and in the initial year of the Clean Policy Plan implementation.

If EPA’s clean power plan and mercury and air toxis standards passes, then 60 GW of coal plants may retire early. EIA. March 20, 2014 Planned coal-fired power plant retirements continue to increase

  • Nuclear EIA DOE 2015: 19% of total electricity in 2013: 5.5 GW new by 2020 with 3.2 GW retirements by 2020
  • Natural Gas 2013: 8.4 quadrillion BTU = 8.2 Tcf to 9.6 QUADS = 9.4 Tcf in 2040
  • Only 3% of the nations 80,000 dams have hydropower, though more could be added.

APPA (7 million customers) Diversification is a means of risk management to prevent reliability, and low cost electricity.

40% of new plant construction is NG, 19.1% wind, 12.7% solar, 11.4% nuclear. NG is 43.4% operating capacity with coal 30%. Utilities are spending hundreds of millions to convert coal facilities to NG or new NG plants. They are also using NG to back up wind and solar. NG is subject to price volatility. Prices may be low now, but can easily rise due to increased regulation of fracking, increased utility demand, exports, and increasing use in the transportation sector. It’s not clear if there’s enough infrastrucuture or storage to accommodate greater use of ng by electric utilities.

Rules causing coal and nuclear plants to shut down:

  • the utility MACT rule
  • clean air transport rule (CATR) cross-state air pollution rule
  • Coal ash rule (resource conservation and recovery act)
  • Cooling water intake structures rule (section 316(b) of Clean water act)
  • New Source Performance Standards (NSPS)
  • new National Ambient Air Quality Standards (NAAQS) for criteria pollutants
  • National Emission Standards for Hazardous Air Pollutants (NESHAP) for industrial, commercial, and industrial ICI boilers and reciprocating internal combustion engines (RICE) units)

Commercially available technologies can be bought from a vendor, are proven at a commercial scale, and offered with robust guarantees on performance and reliability.

There are no commercially available technologies for the capture of CO2 from coal-based power plants. The DOE has 12 major CCS demonstration projects but not one of them has been completed or even started operating. Most are on paper, canceled, or delayed indefinitely, and AEP canceled its own project due to lack of adequate funding. Nor is CCS available abroad. Even if the technology was ready the high cost precludes commercial deployment. At best CCS technology is at least 10 years away indefinitely until projects are implemented. And since CCS equipment is so large, expensive to install, and highly energy intensive there is a real risk that project economics would discourage widespread deployment unless revolutionary technology innovations come along. On top of that CCS faces significant regulatory and legal barriers to get access to geologic repositories and liability and stewardship of the stored CO2. Lending institutions won’t risk several billion dollars without adequate assurances that CCS technology can be installed given EPA rules. Put another way, a utility operator will never select an electric generating technology that requires a control equipment retrofit of unknown technology to be installed 10 years after initial operation. As a result, EPA’s proposed rule is likely to delay for many years the development of CCS technology because new coal-fueld generation will not be built, and without the development of such new coal-based units in the future, the incentive to invest in and advance CCS technology will be greatly diminished.

Mark C. McCullough, exec VP generation, American Electric Power, 5 million retail customers.

The more fuel diversity the less risk since each fuel type and technology is different in terms of availability, reliability, cost, and performance.

Coal and nuclear plants buffer against natural gas fuel supply disruptions because they have 30-60 days of fuel on site. Baseload power runs around the clock with low fuel costs and provides the bulk of electricity. Intermediate and peaking facilities run primarily during periods of high electricity demand. Policies that prevent new or force early retirement of coal and nuclear reduce capacity diversity, risk availability, reliability, and cost.

Too great a reliance on natural gas with a history of great price volatility increases the risk of price spikes and supply disruptions. In Japan, only 2 of 54 nuclear reactors are back and heavily populated areas of the country have rolling blackouts, reduced output in manufacturing facilities, and some of them are moving abroad. NG prices tripled to make up the deficit.

Coal is solid and can an inventory of 30 to 60 days of supply can be at the plant site, unlike natural gas which is subject to disruptions of supply when pipeline infrastructure is damaged in storms and natural disasters. Nuclear power also has large reserves of fuel capacity.

AEP is concerned that a prolonged “dash” to gas will lead to over reliance on one fuel. Already there can be bottlenecks in delivery when both electric and consumer heating demands occur at the same time, especially on cold, short winter days.

Electric utilities have publicly announced plans to shut down 335 coal-fired generating units totally about 47,000 MW. It is likely that over 20% of the U.S. coal fleet will be shut down in the next few years. ACCCE “Coal Unit Shutdowns” feb 14, 2014

The grid will become increasingly reliant on Natural Gas (NG).

William Mohl, president, Entergy wholesale commodities (6 pages of mostly how safe nukes are)

NG 2013 8.4 quadrillion BTU = 8.2 Tcf to 9.6 QUADS = 9.4 Tcf in 2040

Replacing the approximately 101,000 megawatts of capacity provided by U.S. nuclear plants with gas-fired Combined-Cycle Gas Turbine (CCGT) plants would cost between $100 and $110 billion dollars, not including pipelines.

replacing all U.S. nuclear units with gas-fired generation would require an additional 14.5 billion cubic feet per day of additional gas supply, a 70% increase over the 20.8 billion cubic feet per day of gas that electric generators used in 2011. Natural gas fired generators do not have on-site fuel inventory and must be continuously supplied through a pipeline system, and while some facilities may have access to gas storage facilities to ensure continuous supply, many facilities do not. Supply issues can arise during peak times, when pipeline capacity is needed to satisfy the demands of local gas distribution companies to serve homes and businesses, in addition to the needs of power plants that may not have contracts for firm delivery. By contrast, nuclear plants have up to eighteen months of fuel supply on site and do not compete with residential and business consumers for fuel

Regional electric grids require a mix of baseload, load-following, and peaking facilities. Baseload power sources are those plants that can generate dependable power to consistently meet demand. Baseload generation typically runs at full capacity, 24 hours a day, seven days a week, unless a unit is off-line for a scheduled or unscheduled outage. Load-following power sources are typically called upon to increase or reduce output throughout the course of a day as demand for power from end users changes. Peaking units are usually called into service only when demand for electricity is especially high, such as during periods of extreme heat or cold. While each regional electric system has its own unique characteristics, in general, coal and nuclear plants have long supplied baseload power, while natural gas-fired units have been used as the predominant source of load-following and peaking capacity.

There are 1031 operating nuclear power plants in the United States generating approximately twenty percent (20%)2 of the Nation’s electricity. Those nuclear plants operate as baseload, high capacity factor (approximately 89% in 20111) units that power — and help stabilize — the electric grid in or near many major American cities, including New York, Boston, Philadelphia, Pittsburgh, Baltimore, Washington, D.C., Chicago, Detroit, Cleveland, Charlotte, Miami, New Orleans, and Phoenix, among others. Almost half of U.S. nuclear reactors are located within 50 miles of a metropolitan area that has a population of more than half a million. Throughout the Nation, nuclear generators help keep wholesale electricity prices lower than they otherwise would be.

A misconception about nuclear power plants we sometimes encounter is that they remain as they were when they first began operating. To the contrary, many key components are upgraded or replaced periodically, incorporating technological innovations that have been tested and proven suitable. One example is digital instrumentation, which has replaced other types of instrumentation for multiple systems and sub-systems at Entergy plants. Where digital instrumentation has been installed after rigorous analysis and testing, it generally allows plant operators to exercise finer control of systems and provides more immediate feedback. Another example is replacement components made from innovative new materials, such as working components of feed-water pumps and the turbine blades that are driven by steam to produce power. Components such as these, which often cost much more than the components they replace due to their use of cutting-edge materials, last longer and increase plant reliability

American chemistry council. the US chemical industry is the nation’s largest user of combined heat and power (CHP) with 82 GW of installed capacity at 3,700 sites. CHP is significantly underused. ORNL has estimated there are 130 GW possible in U.S. commercial and industrial applications.

ED WHITFIELD (KENTUCKY). At today’s hearing, we are going to be focusing on the role of a diverse source of fuel for electricity generation. We frequently all hear a vocal chorus about the need for ‘‘all of the above’’ to meet our Nation’s demand for electricity at an affordable cost so that we can be competitive in the global marketplace, create a strong economy, and create jobs.

Robert Mann, the Sierra Club President, was quoted as saying ‘‘Fossil fuels have no part in America’s energy future. Coal, oil, and natural gas are poisoning us. The emergence of natural gas as a significant of our energy mix is particularly frightening, because it dangerously postpones investment in clean energy at a time when we should be doubling down on wind, solar, and energy efficiency.’’

Americans are fortunate to have a variety of electricity sources available to us. Each source brings its own unique mix of assets and liabilities. Some are inexpensive, while others are not. Some are reliably available 24 hours a day and seven days a week and ideal for baseload power, while others are not. Some can be quickly ramped up or down to match quick changes in demand, while others cannot. Some can be located almost anywhere, while others are geographically limited. Some can be easily integrated into the existing electric grid, while others would necessitate costly new infrastructure investments. As a result, there is no one ideal means of generating electricity. The best approach for affordability and reliability is a broad mix of generation sources, be it coal, natural gas, nuclear, or renewables. Each source can serve a purpose in the electricity mix, and each has strengths that can compensate for the other’s weaknesses.

BOBBY L. RUSH (ILLINOIS). If we are going to be able to be a manufacturing country and actually create jobs here, it is going to take energy to do it, and under the current breakdown we have today, roughly 87 percent of the electricity that is generated in this country comes from coal, from nuclear power, and from natural gas, and unfortunately, all three are under attack by this administration. The war on coal has been duly noted, you know, you see so much coal being exported because you can’t even use it in this country today, yet it represents over 37 percent of the electricity that is generated. How you can continue to enjoy the standard of living we have as a country today when the administration is attacking 37 percent of that resource, and then in addition, it is all of the other things that are produced in this country. You can’t just do it on wind and solar. We support the advancement of those technologies, but when 87 percent of your electricity comes from the other sources and you are going after them, that is truly the government picking winners and losers and ultimately, the losers are families who are paying higher electricity costs when this kind of policy goes into effect.

Mr. Shimkus of Illinois. the State of Illinois is a 50 percent nuclear, 50 percent coal, so we have the benefits,

HENRY A. WAXMAN (CALIFORNIA). Cheap natural gas is also helping to transform our electricity sector. This market reality is driving a shift away from the use of polluting coal to generate electricity. Even boosters of coal acknowledge that it is not cost effective to build new coal plants today.

Mr. Mark McCullough, Executive Vice President, Generation, at American Electric Power

Energy diversity plays an important role in reducing the potential exposure of our company and our customers to major fluctuations in markets, costs, regulations, and electric demand. This allows for the use of the lowest cost resources possible while enabling rapid response to demand changes. However, policies that could prevent the construction of new base load generating units or force the retirement of existing capacity could lead to significant shifts to this balanced energy mix and reduce capacity diversity.

For example, the proposed CO2 NSPS for new sources effectively prohibits the construction of any new coal-fired power plant because of a lack of commercially available CO2 control technology. Due to these regulations, as well as numerous other challenges facing nuclear energy, our Nation’s electric grid will become increasingly reliant on a single fuel for new base load generation capacity, likely eliminating both diversity and flexibility in new power plant builds. Federal policy should support fuel diversity, not preclude it.

The importance of fuel diversity cannot be overstated

Too great a reliance upon any one energy source creates a significant risk of exposure to electricity price spikes and supply disruptions. Among other benefits, coal and nuclear plants buffer against fuel supply disruptions because they can inventory months of fuel on site, a fundamental value to any energy security solution with national security benefits.

Over the past 12 years, AEP has added more than 5,000 megawatts of natural gas fuel diversity, enabling our company to switch between fuel sources based on price fluctuations. While we recognize the value that natural gas brings to the diversity equation, AEP is concerned that a prolonged ‘‘dash’’ to gas will lead to over reliance on one fuel and have adverse consequences for the balance and diversity of the power sector and the economy.

With the current low cost of natural gas, coal, and uranium, now is the ideal time to look to the future and adjust the focus of technology development to truly innovative, revolutionary paradigms for energy conversion and use. We support commercialization of Small Modular Reactor, or SMR, technology for the next generation of nuclear power. For fossil fuels, the United States must invest in technologies that show promise of a step change move of the needle regarding cost, fuel efficiency, and environmental performance.

With success, technologies like chemical looping and other new revolutionary technologies will enable our next generation of power plants to use coal with extremely high efficiency and ultra-low emissions, while producing a pure stream of CO2 with no added energy penalty. These technologies can open a vast, yet untapped, oil reserves in this country to enhanced oil recovery production by making enormous quantities of low-cost CO2 available for EOR purposes, bringing an even higher level of energy security. These technology innovations require attention now to enable industry to overcome the high cost of commercialization. Encouragingly, as stated in the CURC–EPRI Technology Roadmap, the necessary funding to develop and commercialize these concepts is not beyond the levels invested in recent years with DOE’s Fossil Energy clean coal programs. This funding just needs to be focused on the proper technologies.

SMR development could address nuclear risk that prevents its broad deployment today.

William Mohl, President of Entergy Wholesale Commodities.

Entergy is one of the largest nuclear operators in the United States. We currently operate 11 nuclear power facilities in New York, Vermont, Michigan, Massachusetts, Arkansas, Louisiana, and Mississippi.

Nuclear plants are an essential part of this Nation’s energy portfolio. Regional electric grids require a mix of base load, load-following, and peaking facilities. While each regional electric system has its own unique characteristics, in general, coal and nuclear plants have long supplied base load power, while natural gas-fired units have been used as the predominant source of load-following and peaking capacity. There are 103 operating nuclear power plants in the United States, generating approximately 20 percent of the Nation’s electricity. Those nuclear plants operate as base load, high capacity factor units that power and help stabilize the electric grid in or near many major American cities. Throughout the Nation, nuclear generators help keep wholesale electricity prices lower than they otherwise would be.

A simple way of looking at the economic value of the existing nuclear generation fleet is to consider the potential cost of replacing it. Using data from the Energy Information Administration, we have calculated that replacing the 100,000 megawatts of nuclear capacity with new combined cycle technology gas plants would cost more than $110 billion. To put that number in perspective, in 2011, American utilities invested slightly more than $30 billion in transmission and distribution facilities, less than 1/3 of the nuclear for combined cycle replacement cost. Moreover, this replacement cost estimate does not include any costs of expanding pipeline capacity to serve new gas-fired plants. The adequacy of pipeline capacity is a key consideration, as was recently demonstrated in New England.

Nuclear power is also a crucial contributor to maintaining America’s air quality.

Mr. BARTON. Let us be honest. You are not going to build a coal plant with those regulations, and you will build, probably, almost all natural gas. I am in the Barnett Shale, so I am not anti-natural gas, but I also have lignite coal plants and I support nuclear power and wind power. So I think it is a little bit disingenuous to say that they are fuel neutral. They are not. The gentleman from Entergy, you are a big proponent of nuclear power. Do you think it is possible in today’s market environment to build a base load nuclear power plant in America?

Mr. MOHL. It is very challenging in this environment to be able to build a new nuclear plant. Currently there is a handful of them being developed down South.

Mr. BARTON. Yes, where they still have the regulated markets and you can roll in the prices. But is the challenge for new nuclear, is it more still regulatory and licensing, or is it just the simple fact that because of the competition from coal and natural gas, and to some extent, wind power possibly, that it is just not cost effective right now? It is not economically possible?

Mr. MOHL. There are three challenges as it relates to merchant nuclear. Low gas prices obviously have depressed the markets. Regulation, we need fact-based scientific approach that is based on cost benefit, and we need fair and competitive wholesale markets. And so you are exactly right, that trying to build a new nuclear plant in a wholesale market is just not feasible. Mr. BARTON. I want the record to show that we had a witness say I was exactly right. If you all will make a note of that.

Mr. Benjamin Fowke, who is President and CEO, Xcel Energy

QUESTOIN: would you comment on the assistance stability impacts of wind and solar energy in your utilities?

Mr. FOWKE. Yes, the reliability issues increase, obviously, the more renewables you have on system. I mentioned in my testimony at one point earlier this year, we had 57 percent of our energy coming from wind. So when that happens, you have to quickly back down your generation, and typically you want that to be a gas-fired generation versus nuclear or coal, because they are designed better for those sorts of things. So you have to ramp up and ramp down, and you have to follow the load accordingly. And that does—as you get higher levels of penetration, increase the cost of having that much renewables on your system.

QUESTION: how does wind energy form a hedge against price spikes?

Mr. FOWKE. Wind, as we all know, is interruptible, so while it has a capacity factor for planning, we put a very small capacity factor on it. So it is fuel. So you can build it and you can determine how long it is going— what it is going to cost over a 20-year period. For us, that is about $40 a megawatt hour. Then you compare that to other fuel sources, natural gas specifically. Sometimes at $40 a megawatt hour it is in the money, as it was when natural gas was at 8 and $10. Sometimes it is a little bit out of the money, as it is today in a very low natural gas environment. But it is still a hedge.

QUESTION: You said in your testimony that only 3 percent of the dams, 80,000 dams across America produce electricity. Could you explain that a little bit? What is holding that up?

Mr. GERKEN. Well, one issue is it is very capital intense projects, and they take such a long time to develop. And a lot of these are not your big—dams or obviously run-of-the-river where we are at, so they have smaller capacity name plate. Our projects are, example, 105 megawatts, 82 megawatts, 72 megawatts, and 48 megawatts. But for the most part, it is that capital intense issue. I am not sure we would build these projects today, you know, in today’s natural gas markets it would have been tough to justify this, because quite frankly, our run-of-the-river hydro are very similar to the nuclear when it comes to cost. But we look at that component from we don’t have a fuel to buy and a waste stream on the other side——

MARK MCCULLOUGH ON BEHALF OF AMERICAN ELECTRIC POWER

Energy diversity plays an important role in reducing the potential exposure of our company and customers to major fluctuations in markets, costs, regulations, and electric demand by allowing for the use of the lowest cost resources possible while enabling rapid response to changes in demand that occur throughout the day. However, policies that could prevent the construction of new baseload generating units or force the retirement of existing coal-fired capacity could cause significant shifts to this balanced energy mix; reduce capacity diversity; and hinder our ability to provide reliable and affordable electricity to our communities and customers. For example, the proposed CO2 NSPS for new sources effectively prohibits the construction of any new coal-fired power plant because of the lack of a commercially available CO2 control technology. Due to these regulations, as well as numerous other challenges facing nuclear energy, our nation’s electric grid will become increasing reliant on natural gas for new generation capacity, likely eliminating both diversity and flexibility in new power plant builds. Federal policy should support fuel diversity, not preclude it.

The importance of fuel diversity cannot be overstated given its implications for assuring economic and energy security. Too great a reliance upon any one energy source (particularly those with a history of price volatility) creates a significant risk of exposure to electricity price spikes and supply disruptions. This can lead to severe impacts on the supply stability and price of electricity for residential, commercial, and industrial customers. Consider the Tsunami catastrophe in Japan, where a natural disaster resulted in all 54 nuclear reactors being abruptly removed from service. Nearly two years later only two units are back in service. Hurricane Katrina in 2005 disabled nine oil refineries and rendered 30 oil platforms damaged or destroyed. Coal and nuclear plants buffer against fuel supply disruptions because they can inventory months of fuel on site, a fundamental value to any energy security solution with national security benefits.

Over the past twelve years AEP has added more than 5,000MW of natural gas fuel diversity, which has enabled our company to switch between fuel sources based on price fluctuations of fuels over time. This diversity has served our customers and communities well and has allowed us to keep our electricity rates low. For example, AEP responded to the spikes in natural gas pricing during the mid2000’s by increasing its use of cheaper coal to serve our customers, while at the same time decreasing emissions. Similarly, recently depressed natural gas pricing have allowed us to keep our electricity prices low by using additional natural gas where more cost effective than coal. However, AEP is concerned that a prolonged“dash” to gas will lead to over reliance on one fuel and have adverse consequences for the balance and diversity of the power sector and the economy.

With the current low cost of natural gas, now is the ideal time to look to the future and adjust the focus of technology development to truly innovative, revolutionary paradigms for energy conversion and use. We support commercialization of Small Modular Reactor (SMR) technology for the next generation of nuclear power. For fossil fuels, the United States must invest in technologies that show promise of meaningfully moving the needle regarding cost, fuel efficiency, and environmental performance. With success, chemical looping and other new revolutionary technologies will enable our next generation of power plants to use coal with extremely high efficiency and ultra-low emissions, while producing a pure stream of CO2 with no added energy penalty. Not only will these new paradigms revolutionize the power generation industry, they can open the vast, yet untapped, oil reserves in this country to Enhanced Oil Recovery (EOR) production by making enormous quantities of low cost CO2 available for EOR purposes. These technology innovations are essential to a diverse energy future, but they require attention now and focused funding to enable industry to overcome the high cost of commercialization. Encouragingly, as stated in the CURC-EPRI Technology Roadmap, the necessary funding to develop and commercialize these concepts is not beyond the levels invested in recent years with DOE’s Fossil Energy clean coal programs; this funding just needs to be focused on the proper technologies.

To ensure our current investments in coal-fired generation can be retained in the future to maintain diversity, we have also invested heavily in the advancement of carbon capture and storage technology. The Mountaineer CCS Project treated a 20-MW portion of flue gas from our 1300-MW Mountaineer Plant, removed the carbon dioxide (CO2), and compressed and injected the CO2 into two deep underground formations more than 7,000 feet below the surface of the plant property. The project successfully operated from 2009 to 2011, and permanently stored nearly 40,000 tons of CO2 in deep saline reservoirs, with continuing post-closure monitoring. A second phase of that project, which would have advanced the technology to a 235-MW commercial scale, was deferred due to the failure to raise funding.

THE ROLE OF DIVERSITY

Diversity plays an important role in reducing the potential exposure of our company and customers to fluctuations in markets, costs, regulations, and electric demand. Diversity within the electric power sector can refer to a variety of practices that reduce these exposures. Perhaps the most important measure of diversity for the electric power sector is the practice of fuel diversity. The U.S. has an abundance of energy resources that can be used to generate electricity, including coal, natural gas, uranium, wind, solar, water, biomass and geothermal. These fuel sources each have a unique cost profile based on both supply and demand of the fuel as well as the unique generating technology required to turn chemical, solar or kinetic energy into useful electrical energy. However, each fuel type and technology present different risk characteristics in terms of availability, reliability, cost, and performance. As such, fuel diversity among these energy resources will lower the overall risk of the generation portfolio and provide for a more reliable and cost effective electric supply. Generating technologies are specific to the fuel or energy resource used to produce electricity to our electric grid. Developing capacity diversity within our generating system is important because it allows for the use of the lowest cost resources when possible while enabling rapid response to changes in demand that occur throughout the day. Capacity diversity is achieved by constructing baseload, intermediate and peaking facilities in addition to intermittent facilities (e.g. wind and solar), which may or may not be available to generate electricity at any given time. When properly deployed, each type of resource can synergistically operate during the various fluctuations in supply and demand to reliably support customer needs and requirements. Generally speaking, baseload facilities (coal, nuclear, hydro, and more recently gas) are designed to run around the clock with low fuel costs and provide the bulk of electricity to the grid. Intermediate and peaking facilities are designed to run primarily during periods of higher electric demand. However, policies that could prevent the construction of new baseload facilities or force their retirement could cause significant shifts to this mix; reduce capacity diversity; and increase risk of availability, reliability, and cost of electricity.

IMPORTANCE OF FUEL DIVERSITY

The importance of fuel diversity cannot be overstated given its implications for assuring economic and energy security. Too great a reliance upon any one energy source (particularly those with a history of price volatility [NATURAL GAS]) creates a significant risk exposure to electricity price escalation and supply disruptions. As has been proven repeatedly across the globe, such exposure can lead to severe impacts on the supply and price of electricity for residential, commercial, and industrial customers. For example, the recent catastrophe in Japan serves as a sobering reminder of what can happen if a single energy source is abruptly removed from use. In 2011, an earthquake and tsunami devastated shoreline communities and seriously damaged the Fukushima Daiichi nuclear power plant. Resultant radiation leaks and a greatly eroded public faith in safety of nuclear power lead to the shutting down of all of Japan’s 54 nuclear reactors for mandatory maintenance and safety checks. To date, only two units are back in service. Heavily populated areas of the country have faced the realities of rolling blackouts, while manufacturing facilities are reducing output, with some making moves to relocate abroad. Meanwhile, natural gas prices in Japan nearly tripled as power producers scrambled to fill the massive void left in their energy infrastructure. Domestic energy disruptions and their consequences are clearly evident by such disasters as Hurricane Katrina in 2005, where nine oil refineries were shut down for an extended period of time and 30 oil platforms were either damaged or completely destroyed, dramatically hampering oil and gas production. United States natural gas prices spiked following the disaster and for months afterward remained more than double the price over the previous year.

There is another unique feature to coal that must be considered from an energy security perspective. Coal is a solid and physically stable energy resource that can be safely stockpiled at the power plant site. A typical power plant takes advantage of this feature by keeping an inventory of 30 to 60 days of supply of coal at the plant site. This is an incredibly valuable characteristic when considering the risks associated with supply interruptions of other fuels, such as natural gas. If storms, natural disasters, or other forces interrupt major gas pipeline infrastructure, gas-fired power plants immediately cease to produce electricity and cannot resume production until infrastructure repairs are made. Coal plants, on the other hand, can continue to operate if the major fuel supply is compromised.

Similarly, nuclear power enjoys the benefit of large reserves of fuel capacity on the plant site. This is a factor of fundamental value to any energy security solution and has national security benefits as well– particularly given the abundant reserves of coal in the United States.

While we value natural gas as a critical component of our generation energy mix, AEP is concerned that the United States has reached an important crossroads in terms of fuel diversity planning. EPA’s regulations have led to the premature shut down of some of our existing coal fired facilities, while not allowing the construction of new coal-fired facilities, as discussed later. This effectively precludes further use of a low-cost, abundant and domestic resource, coal, within the U.S. generating mix and will force AEP and others to increasingly rely on natural gas for generating electricity– which has a long history of price volatility. AEP is concerned that a prolonged “dash” to gas will lead to over reliance on one fuel and have adverse consequences for the balance and diversity of the power sector and the economy.

For example, the increased use of natural gas to generate electricity puts stress on a natural gas supply system designed to meeting peak winter heating needs by requiring increasingly larger supply and flow rate to power plants, which currently represent a minority share of U.S. natural gas demand. As an example, ISO New England just told the Federal Energy Regulatory Commission on February 7 that it was concerned about “increasing reliance on natural gas-fueled generators at times when there is an increasingly tight availability of pipeline capacity to deliver natural gas from the south and west to New England.” This increased reliance has contributed to rapid price spikes in the cost of natural gas in that area, which translates into much higher wholesale electric prices. There are additional concerns surrounding the synchronization of electricity and natural gas markets as supplies of power and natural gas are secured on a different time basis. This disconnect may prevent facilities committed to provide electric power from securing the gas supplies they need to operate. This picture is further complicated by the interdependent nature of the natural gas supply and electric generation industries. As more of the power generation comes from gas, the impact of simultaneous peak electricity demand and peak consumer heating demands converge, creating a scenario where gas deliverability capability can become a bottleneck.

This is particularly true in the winter when shorter days and colder temperatures increase demands for heating and lighting. While adequate supply of gas may exist, delivering at the rate needed during peaks could be constrained.

The dash to gas and the potential problems created in its wake has come at the same time that other countries around the world are increasingly turning to coal to fuel their economies. China is currently far and away the largest consumer of coal, and in fact is consuming almost as much coal as the rest of the world combined. Additionally, Europe is increasingly returning to coal to fuel its electric sector, with much of the imported coal coming from the United States. Consequently, any policy, direct or indirect, to restrict coal use within the U.S. is unlikely to have a significant impact on reducing global coal consumption. The more significant impacts will be felt however by the U.S. economy, particularly in regions of the country which rely on coal production for economic stability and low-cost electric generation.

REGULATORY BARRIERS TO FUEL DIVERSITY

There are numerous barriers to fuel diversity within the electric generation fleet; however our most pressing concerns are the new federal environmental regulations and the lack of an energy policy promoting diversity and therefore energy security.

As an example, the proposed CO2 NSPS for new sources effectively prohibits the construction of new coal-fired facilities for the reasons discussed in the next section. These proposed CO2 performance standards come in the wake of other new environmental regulations, most notably the Mercury and Air Toxics Standards. Due to these new EPA rules and other factors, electric utilities have already publicly announced their plans to shut down 335 coal-fired generating units, totaling about 47,000 MW. Additional coal plant shutdowns are expected as companies finalize their air toxics compliance plans. Once these additional plant retirements are combined with already announced retirements, it is likely that over 20 percent of the U.S. coal fleet will be shut down within the next few years. 1 See http://www.eia.gov/todayinenergy/detail.cfm?id=9751 .2 See http://www.economist.com/news/briefing/21569039-europes-energy-policy-delivers-worst-all-possible-worldsunwelcome-renaissance. 3 See

Due to these regulations, our nation’s electric grid will become increasing reliant on natural gas for new generation capacity, likely eliminating both diversity and flexibility in new power plant builds.

CCS is not currently commercially available or economically viable at this time. EPA supports its fuel discriminatory standard by stating that the rule would not impose any additional costs on the economy because under current economic conditions, no new coal-fueled units will be built. While AEP agrees that current market conditions generally do not support development of new coal-fueled units, this result is driven primarily by current low prices of a very volatile commodity, natural gas. Natural gas prices have fluctuated over the past decade between $2 and $13 per MMBtu on a monthly average basis. Average prices over most of the last decade have been above $6 per MMBtu. Most 10-year projections show gas prices in the range of $4 to $6 per MMBtu. By contrast, most coal prices in the US are less than $3 per MMBtu. In light of the significant historical fluctuation of natural gas prices, it is reasonable to plan for some continued variation in natural gas prices over the long-term even though shale gas reserves appear to be plentiful at this time. If, for example, natural gas prices were to increase modestly to levels seen only a few years ago, electric generating companies could opt to build new coal units based on economics, absent the proposed CO2 NSPS requirements. However, with EPA’s proposal to adopt a CO2 emissions standard based on the performance of natural gas combined cycle units, electric generating companies are unable to build coal-fueled units without assuming unreasonable risks, and therefore generally have no choice but to build gas units instead.

Nuclear energy also faces daunting challenges. According to an MIT study “The Future of Nuclear Power”, nuclear energy faces four unresolved problems: high relative cost; perceived adverse safety, environmental, and health effects; potential security risks stemming from proliferation; and unresolved challenges in long-term management of nuclear wastes. From a new plant construction perspective, risks associated with cost escalation, scheduling, and sheer project size suggest that very few new nuclear plants will be built. Compounding this with the fact that existing nuclear power plants are facing expiration of their operating licenses over the coming years or decades, there is a real threat that nuclear energy will not be a viable participant in a long term diverse energy portfolio.

AEP believes that technological solutions are critical to reducing emissions as well as improving the reliability, efficiency, and availability of electricity production. More than a century of technology innovation qualifies AEP as an industry leader and expert in these topics. Nonetheless, as a consequence of our first-hand experience and intimate understanding of CCS technologies, AEP is convinced that CCS is many years from providing a commercially viable solution to capturing and permanently storing CO2 emissions due to the numerous technical, financial, legal, and regulatory challenges that must first be addressed. However, these solutions will need to be developed to ensure fuel diversity can be maintained with the possibility of a carbon-constrained world. Additionally, there are a number of other new and innovative technologies that convert coal to electric power and other products while producing a pure stream of CO2, not requiring the added processes to capture and purify CO2 emissions. While still in the developmental phase, these emerging technologies are showing tremendous promise at the laboratory and pilot-plant level. In many cases, these new technologies, such as chemical looping applications, are revolutionary as opposed to evolutionary in nature and could usher in a new generation of technology solutions that are lower in cost, perform at higher energy efficiencies, and provide more flexibility in fuel selection.

“Commercially available” technologies are those that can be purchased from a vendor, have been proven at commercial scale on a representative application, and are offered with robust guarantees on performance and reliability. Vendors cannot provide meaningful guarantees without extensive testing at representative scale. Based on this point of reference, no commercially available technologies for the capture of CO2 from coal-based power plants exist today.

The Department of Energy’s Major CCS Demonstration program currently includes twelve projects that propose to demonstrate CO2 capture along with some form of storage and/or utilization of the captured CO2. If this were a list of 12 successfully completed projects, then it could certainly be argued that the technologies are ready for commercial deployment. However, not one of the projects has been completed, and in fact, none have even commenced operation. Most are no more developed than the work on paper required for conception of the project. Some that had previously been included on DOE’s list have been cancelled or delayed indefinitely.

The technologies to capture and sequester CO2 are not commercially available, domestically or otherwise. While several promising CO2 capture technologies are under development, none are ready for commercial deployment. They must be advanced in a systematic and step-wise manner to ensure their technological and economic feasibility.

AEP had begun the process of moving the CCS technology to commercial scale with the Mountaineer CCS Demonstration Project, but the lack of an adequate funding mechanism resulted in the company placing the project on hold. Even if AEP’s project had remained on schedule, the CCS technology, like other first-of-a-kind projects, would have been installed without any commercial guarantees from vendors and would have run the risk of not continuously or reliably achieving high CO2capture levels. AEP’s expectation was that a commercial-scale CCS demonstration project was essential now, so that in 2020 or later, a reliable commercial-scale CO2 capture system might be commercially available and ready for deployment.

With the suspension of the AEP project and as similar DOE projects are delayed or discontinued, the date for commercial readiness of CCS technology continues to move further out on the horizon. A reasonable estimate for commercial availability, based on the current state of technology development, is at least ten years away, and this is assuming that current financial and regulatory barriers to demonstration projects are expeditiously removed. Without a clear path forward, we will remain, perhaps indefinitely, ten years or more from commercialization of CO2 capture technology. Numerous studies and projects by public and private organizations also have concluded that the availability of commercially available CCS is at least a decade away, even if a much more ambitious research, development, and demonstration program were implemented. Even then, CCS equipment is large, expensive to install, and highly energy intensive. There is a real risk that project economics could discourage wide deployment of CCS.

Furthermore, the path to CCS commercialization is filled with significant regulatory and legal barriers. These include issues related to the ownership of, acquisition of, and/or access to geologic pore space, as well as issues surrounding long-term liability and stewardship of geologically stored CO2. The removal of these barriers in many cases will most likely be through the development of state legislation and regulatory programs. Efforts at the state and federal level are underway and in various stages of development, but significant challenges remain before these and other legal and regulatory issues will be sufficiently resolved to support the commercialization of CCS on coal-based generation.

Finally, EPA has proposed an alternative compliance option that will not help coal-fueled EGUs achieve the CO2 performance standard. EPA’s averaging approach will not work without much greater certainty pertaining to CCS cost and technology. In fact, this alternative compliance option does nothing to ensure the demonstration and deployment of CCS technologies. As just discussed, CCS is not yet commercially demonstrated for large-scale commercial applications and the high cost of the CCS technology effectively precludes its commercial deployment, even if the technology was ready. As a result, there are many technical, economic, and legal risks with CCS technology that must be addressed before an EGU developer would consider investing in a new multi-billion dollar plant. These risks will not be taken if the new plant might have to cease operation after ten years if CCS cannot achieve a regulatory standard developed without any real-world data. Without much greater certainty on the timing and success of CCS commercialization efforts, such risk simply will not be acceptable and will effectively preclude the development of any new generation technology that must rely on CCS to operate. It is unlikely that the developer could ever obtain the necessary funding for building the plant until these matters are satisfactorily addressed. Lending institutions and state regulatory commissions will not risk several billion dollars unless they obtain adequate assurances that a CCS technology is capable of achieving the CO2 performance standard and can be installed at the new coal-fueled plant within the initial ten-year period of operation. Simply put, a utility operator will never select an electric generating technology or unit design that requires a control equipment retrofit of unknown technology to be installed ten years after initial operation.

Work done to date on CCS technology has yielded incremental improvements in cost and process efficiency. Substantial “game changing” innovations for CCS cost and performance will require the integration of new CCS technologies with advanced next generation coal-based systems, such as advanced IGCC, oxycombustion, and chemical looping combustion or gasification. As a result, EPA’s proposed rule is likely to delay for many years the development of CCS technology because new coal-fueled generation will not be built and, without the development of such new coal-based units in the future, the incentive to invest in and advance CCS technology will be greatly diminished.

As stated above, the current regulatory climate and market are such that no new coal-fired power plants are likely to be built so long as gas prices remain low.

Currently, most power generation-related technology development is focused on modifications and retrofit applications to the existing power plant fleet. Yet, most of the existing fleet in the US is over 30 years of age and already carrying expensive and complex retrofit systems, many of which were installed at costs rivaling the original power plant. Any further modification or retrofit will add complexity and most likely reduce the energy efficiency of the power plant.

QUESTION: let us talk about this shift in natural gas. I am all for it, but I think you alluded to—just like an electricity grid and a transmission grid, we may have some pipeline constraints. Can you talk about that?

Mr. MCCLURE. Well, there is a recent example, a very real example in New England that I think many of you have become familiar with where high demand for electricity and a very cold snap, high demand for gas for heating created a real spike in prices for both natural gas and electricity. There are other parts of the country where we simply don’t have the gas pipeline infrastructure. We could not convert our two coal plants to gas because there is no— not an adequate gas line infrastructure there.

Mr. SHIMKUS. And Mr. Gramlich, that is some of the challenges on wind power on the reverse side, just with the transmission grid, is it not?

Mr. GRAMLICH. Transmission is very helpful——

Mr. SHIMKUS. Just trying to wield that power to places that it might be used. So those are—I think those are especially issues in a bipartisan manner that we can talk about is expanding our natural gas pipeline, expanding the transmission grid.

Mr. MCCULLOUGH. We will be converting just a few plants to natural gas, but that will be for capacity reserve reasons, not for, you know, overall energy economics. You lose some efficiency, as these units are designed to burn coal and gas can’t get steam temperatures to the same efficiency levels that it was designed for, so it is not going to be a very efficient use of natural gas, as you try to meet the energy needs of your jurisdiction.

Mrs. CHRISTENSEN.  We are looking at wind energy. We  are doing some solar, but haven’t really moved towards wind yet. For a place that doesn’t have a grid that supplies energy from diverse areas, like the Virgin Islands, do you think that we could reach that same reliability from wind or would we need additional reserve capacity? I am thinking that we couldn’t rely on it.

Mr. FOWKE. You know without specifics, the smaller the grid and the larger the one single source of wind would be, I think the more problems you would have making sure that it is integrated efficiently and reliably.


Mr. OLSON. We all know more people means more homes, more commerce, more industry, more need for electricity generation. ERCOT is the agency in our State of Texas that regulates most of the electricity in the State, about 90 percent of it, and they did a recent study that says we may have a power crisis by 2014 unless we have new power generation brought up online. We will be short 2,500 megawatts is their estimate. If we have a heat wave like the August before last, we were over 100 degrees in every part of the State for over a month. If that happens again, we will have brownouts or blackouts. We need more capacity.


Posted in Coal, Grid instability, Natural Gas, U.S. Congress Energy Independence | Tagged , , | Comments Off on Why we need a diverse electricity generation portfolio: House hearing 2013

Nature: All women in the world should have the right to birth control

Source: Masri L (2019) “Two is enough” Egypt tells poor families as population booms. The Star.

Preface. Nature is one of the top science journals, so it is a big deal that Nature finally acknowledged a growing population will wreak enormous havoc on the world, and that the best way to slow the human juggernaut of destruction is for women to be able to control their own bodies and lives.

Fewer people is the only way to slow down climate change, pollution, poverty,  depletion of  (rain)forests, topsoil, aquifers, housing shortages, low-paying jobs and unemployment, and so on. Can you even think of a single problem that would not be helped by fewer people?

Continue reading

Posted in Population, Scientists Warnings to Humanity | Tagged , , | Comments Off on Nature: All women in the world should have the right to birth control

67% of USA counties still in recession — lower incomes than 2009

[ Time magazine points out that most of the green counties are oil drilling locations, which in 2016 are quickly losing jobs ]

Wilson, C. December 15, 2015. See How Well Your Neighbors Have Recovered From the Recession. Time Magazine.

The recession may have officially ended in mid-2009, but millions of working Americans have seen their income remain stagnant. New figures from the U.S. Census Bureau confirm that the median household income in the U.S. was $53,482 between 2010 and 2014, down from $56,568 between 2005 and 2009 when adjusted for inflation—a drop of 5%. Only 1,038 of 3,142 counties have a higher median income than they did five years ago. The following map shades every county by its growth or decline in median income since 2009.

Time mag most of USA still not recovered since 2009

Posted in Poverty | Tagged , , | Comments Off on 67% of USA counties still in recession — lower incomes than 2009

Nearly a third of cacti threatened with extinction

Illegal trade contributes to placing cacti among world’s most threatened species – IUCN Red List

05 October 2015 | International news release

Gland, Switzerland, 5 October 2015 (IUCN) – Thirty-one percent of cactus species are threatened with extinction, according to the first comprehensive, global assessment of the species group by IUCN and partners, published today in the journal Nature Plants. This places cacti among the most threatened taxonomic groups assessed on The IUCN Red List of Threatened Species™ – more threatened than mammals and birds.

According to the report, cacti are under increasing pressure from human activity, with more than half of the world’s 1,480 cactus species used by people. The illegal trade of live plants and seeds for the horticultural industry and private collections, as well as their unsustainable harvesting are the main threats to cacti, affecting 47% of threatened species.

“These findings are disturbing,” says Inger Andersen, IUCN Director General. “They confirm that the scale of the illegal wildlife trade – including trade in plants – is much greater than we had previously thought, and that wildlife trafficking concerns many more species than the charismatic rhinos and elephants which tend to receive global attention. We must urgently step up international efforts to tackle the illegal wildlife trade and strengthen the implementation of the CITES Convention on International Trade in Endangered Species, if we want to prevent the further decline of these species.”

Other threats to cacti include smallholder livestock ranching affecting 31% of threatened species, and smallholder annual agriculture affecting 24% of threatened species. Residential and commercial development, quarrying and aquaculture – particularly shrimp farming, which expands into cacti’s habitats – are also among major threats faced by these species.

Cacti are key components of New World arid ecosystems and are critical to the survival of many animal species. They provide a source of food and water for many species including deer, woodrats, rabbits, coyotes, turkeys, quails, lizards and tortoises, all of which help with cactus seed dispersal in return. Cactus flowers provide nectar to hummingbirds and bats, as well as bees, moths and other insects, which, in turn, pollinate the plants.

Cactus species are widely used by people in the horticultural trade, as well as for food and for medicine. Their fruit and highly nutritious stems are an important food source for rural communities. The nutritional value of one cactus stem of Opuntia ficus-indica – a ‘prickly pear’ cactus popular in Mexico, where it is known as ‘nopal’ – is often compared to that of a beef steak, and the roots of species such as Ariocarpus kotschoubeyanus which is listed as Near Threatened, are used as anti-inflammatories.

Trade in cactus species occurs at national and international levels and is often illegal, with 86% of threatened cacti used in horticulture taken from wild populations. European and Asian collectors are the biggest contributors to the illegal cactus trade. Specimens taken from the wild are particularly sought after due to their rarity.

“The results of this assessment come as a shock to us,” says Barbara Goettsch, lead author of the study and Co-Chair of IUCN’s Cactus and Succulent Plant Specialist Group. “We did not expect cacti to be so highly threatened and for illegal trade to be such an important driver of their decline. Their loss could have far-reaching consequences for the diversity and ecology of arid lands and for local communities dependent on wild-harvested fruit and stems.”

“This study highlights the need for better and more sustainable management of cactus populations within range countries. With the current human population growth, these plants cannot sustain such high levels of collection and habitat loss.”

Cacti are renowned for their diverse forms and beautiful flowers. They are endemic to New World arid lands except for one species, Mistletoe Cactus (Rhipsalis baccifera), which is also found in southern Africa, Madagascar and Sri Lanka. Hotspots for threatened cactus species include arid areas of Brazil, Chile, Mexico and Uruguay. These areas are perceived as uncharismatic and unimportant, even though they are rich in biodiversity, hence arid-land species like cacti are often overlooked in conservation planning. The report’s authors highlight the need to broaden arid land protected area coverage and raise awareness about the importance of sustainable collection of cacti from the wild in order to better conserve the species.

Additional notes:

“Cacti are extraordinary plants that concentrate water and nutrients used by natural and human communities, in some of the world’s most challenging environments,” says Mary Klein, President of NatureServe, an IUCN partner in facilitating assessments of North American and Caribbean cacti. “This study confirms that cacti are especially vulnerable, but that with focused attention on reducing the threats such as illegal harvest, we can conserve these miracles of nature for the future.”

• The seven most threatened taxonomic groups assessed on The IUCN Red List of Threatened Species™ are cycads (63%), amphibians (41%), conifers (34%), warm-water reef building corals (33%), cacti (31%), mammals (25%) and birds (13%).

• Cacti are native to the New World but species have been introduced to Africa, Australia, and Europe. For example, prickly pears (Opuntia spp.) were introduced to Australia in the 19th century and have since then become invasive species, spreading throughout the Outback and outcompeting native flora.

• Agriculture is the most widespread threat to cacti, affecting species in large parts of northern Mexico, Mesoamerica and the southern part of South America. Cacti in coastal areas, such as the Caribbean and the Baja California peninsula in Mexico, are mainly affected by residential and commercial development. In southern Brazil, conversion of land for eucalyptus plantations is affecting at least 27 species, including the Endangered Parodia muricata.

• More than 30 species, such as the Critically Endangered Coleocephalocereus purpureus in eastern Brazil are affected by quarrying. Arrojadoa marylaniae, also listed as Critically Endangered, may go extinct in the near future, as the single white quartz rock on which it is exclusively found is threatened by mining.

• In the north-western part of Mexico, species such as the Critically Endangered Corynopuntia reflexispina are unexpectedly becoming threatened by aquaculture, as shrimp farming expands into the desert.


Posted in Biodiversity Loss | Tagged , | Comments Off on Nearly a third of cacti threatened with extinction