Preface. Some of the interesting parts of this session are $95 billion dollars of new manufacturing, transport, & utilities that are growing to take advantage of the cheap NG here, which will exponentially increase the use of energy. Even if we had 100 years of oil and gas, exponential growth cuts that in half or more. Also battles between Oil & Gas producers to export LNG versus DOW and other industries who want to keep most of the NG here. There are allegations that the overproduction of NG was an illegal scam for speculative investment in export of LNG, the NRDC on the damage of fracking, and the Wilderness Society about the massive amounts of drilling in America, much of it on Federal Land. This was somewhat surprising to me since so much of the oil & gas company testimony is begging congress for opening up restricted land so they can DRILL, BABY, DRILL.
Alice Friedemann www.energyskeptic.com Author of Life After Fossil Fuels: A Reality Check on Alternative Energy; When Trucks Stop Running: Energy and the Future of Transportation”, Barriers to Making Algal Biofuels, & “Crunch! Whole Grain Artisan Chips and Crackers”. Women in ecology Podcasts: WGBH, Financial Sense, Jore, Planet: Critical, Crazy Town, Collapse Chronicles, Derrick Jensen, Practical Prepping, Kunstler 253 &278, Peak Prosperity, Index of best energyskeptic posts
***
TO EXPLORE OPPORTUNITIES AND CHALLENGES ASSOCIATED WITH AMERICA’S NATURAL GAS RESOURCES
Jack Gerard, President and Chief Executive Officer, American Petroleum Institute:
“Six/seven years ago someone estimated [reserves were] about 20 to 30 years. Most recently the EIA has estimated that it’s at least 90–95 years. Other independent analysis—ICF, etcetera have estimated it’s 150 years, and there’s some who’ve believe it’s 200–300 years worth of supply at current levels of consumption. It’s evolving quickly because of breakthrough technology as we define more resources. It’s going up dramatically quickly. What happened today, and I can’t overstate this, what is happening today is unprecedented in the history of our country in terms of our opportunity to become energy secure and self-sufficient. Just think back 5 or 6 years ago nobody was having this conversation. Today we’re the world’s No. 1 gas producer. It’s now estimated through this advancement in technology, we’ll be the world’s No. 1 oil producer by 2020, 7 short years and surpass Saudi Arabia.”
Drinking the Kool-aid: political leaders swallow LNG, fracking fluids, and the belief the US is Energy Independent
[my comment: Leaders represent the businesses within their domain and keep their personal opinions to themselves. Murkowski and Hickenlooper are leaders from energy-producing states and promote those industries, regardless of what they think, especially ironic from Hickenlooper because he was a host and speaker at the Association for the Study of Peak Oil conference in 2005 when he was Mayor of Denver. Being an energy producer cheerleader is one of many reasons why Americans aren’t hearing about the energy crisis from their leaders]
“The really great thing was when someone dipped a graham cracker into the LNG and passed it around for the rest of us to eat. Senator Wyden waited for me to take the first bite to make sure I didn’t die. It was like a Thin Mint from the freezer. So I think we demystified some of the concerns about LNG (Mufson, S. Feb 9, 2013. Q&A: Republican Sen. Lisa Murkowski of Alaska on her ‘20/20’ vision for energy policy. Washington Post)
JOHN W. HICKENLOOPER, GOVERNOR OF COLORADO: At one point in my office, I’m not sure how this happened, but the new frack fluid is made with food additives, and somehow we all took a swig of the new frack fluid, and it was not terribly tasty, but again, I’m still alive to—like Senator Wyden coming back from Alaska is still alive to tell the story.
RON WYDEN, U.S. SENATOR FROM OREGON.
For the first time in decades, our Nation will be able to rely on its own U.S. energy resources, especially new oil and gas development from shale instead of being dependent on imports from the Middle East and other parts of the world that haven’t always had our best interests at heart. This is a major change for American energy policy.
36 years ago the predecessor to this committee called the Interior and Insular Affairs Committee, and they held hearings on natural gas as the country faced a supply emergency that triggered shortages across the Northeastern United States. During that supply emergency hundreds of thousands of people were laid off as commerce and industry reduced hours or simply shut down altogether. The committee at that time was chaired by our legendary Senator, Henry ‘‘Scoop’’ Jackson, and the committee released a report prepared by the Department of Defense predicting that LNG imports would account for 10% of the country’s gas supply [and that report] has dominated American energy policy until just a few years ago. In 2005, Congress, over the objection of some, swept aside the ability of States to even approve the siting of LNG import terminals. As recently as 2007, when the Congress last enacted major legislation the focus was still overwhelmingly on energy scarcity.
Today, the outlook could not be more different. Instead of scarcity and shortages, the prediction is that domestic production will soon outstrip American demand. Given the dramatic change in the outlook for natural gas supply, it is clearly time for a fresh look at our current policies and to start thinking about how to update those policies to reflect a very new reality.
MARY L. LANDRIEU, U.S. SENATOR FROM LOUISIANA. The wealth of natural gas is extraordinary, with estimates indicating America currently has 317 trillion cubic feet of proven, accessible reserves, and a further 2,000 tcf in total resource base estimates. This is enough to fulfill our current demand, a little over 24 bcf per day, for over 100 years.
Louisiana, Methanex Corporation, which moved its last U.S. plant overseas in 1999, is now spending over $1 billion to move a methanol plant from Chile to Ascension parish, near Baton Rouge. This plant will produce the raw materials for everything from windshield washer fluid to paints and sealants, even wrinkle free shirts. Williams, a petrochemical company based in Tulsa, is planning a new $400 ethylene plant also in Ascension parish, where they will supply our plastics manufacturers. Finally, CF Industries, one of the world’s largest producers of nitrogen fertilizer, is looking to spend $2.1 billion to build a new fertilizer plant in Ascension. That’s over $3.5 billion being invested in one parish in Louisiana, all thanks to our new abundance of domestic natural gas. Of course, that isn’t the whole story; nationwide, these same petrochemical, plastics, steel and fertilizer industries are planning to invest upwards of $80 billion in new plants and new capabilities.
One of the most important topics in our conversation about how best to approach this new wealth of natural gas is the issue of exports, specifically liquefied natural gas, to nations around the world. There are strong arguments to be made on each side, for and against the expansion of these exports, and I am sensitive to both. I believe, however, that there is enough domestic production, and the capacity for enough production increase to support our vital manufacturing industry and allow for responsible levels of export. The recent NERA study, commissioned by DOE, supports this view, and indicates that it is possible for a level of export to exist that both incentivizes increased production while at the same time continuing to provide our domestic consumers with reliable, low-cost natural gas.
LISA MURKOWSKI, U.S. SENATOR FROM ALASKA. Natural gas is now an abundant, affordable, clean source of energy, providing great opportunities for economic growth, and an energy security. When we look at our energy sources just a few years ago, we were talking about the scarcity of our resources. We have now moved from a discussion about scarcity to one of abundance. In addition, our allies overseas are now looking at the United States, they want our natural gas, and we’ve got enough resources to help make that happen.
This requires us to look critically and perhaps rethink some of the conversations that we have had about energy. Last week I introduced a proposal in a document about 115 pages, Energy 20–20, that I hope will spur us to conversations about energy and how we should be looking differently at energy because of exactly this—this paradigm shift, going from one of scarcity to relative abundance. Our resource base estimates have increased 44 percent for natural gas in less than 5 years. That’s pretty incredible. Production is up, prices are low. There’s been a positive impact on our greenhouse gas emissions.
We also need to be careful about intervening in efforts to export our LNG. There’s a long established regulatory process for natural gas exports through the Department of Energy and through the FERC. This includes environmental review under NEPA. So before we reinvent the wheel, I think we need to look at existing laws and regulations and determine if and where there are deficiencies. The debate on this issue has focused on the impacts to domestic natural gas prices and supply, but I think we also need to include within this discussion an understanding of the role that the market forces will play, not only on domestic prices, but the number of projects that may actually be built. These are mega projects that we are dealing with, in every sense of the word, ranging from $8 billion to $25 billion, depending on the amount of existing infrastructure. Up in Alaska, we’re talking about a project of about $65 billion. This is real money. Gas is a global commodity, and other countries, including Canada, are already moving forward. So I don’t think that dragging our feet is an option here, if we want to export our LNG. We should also not forget the positive impacts that exports would have on our trade imbalance and the geopolitical benefits of exporting to our allies.
PAUL SANSONE, SANSONE & ASSOCIATES. The ‘Shale Gale’, a huge expansion of available domestically produced natural gas, is the subject of the hearing. I am writing to provide documentation that the legal and regulatory oversight of the industry was manipulated by apparent fraud to secure exception from environmental regulation (Clean Air Act, and Clean Water Act exemptions), fast track approval for LNG ‘‘import’’ terminals ( FERC review not State review), and the right of eminent domain for natural gas pipelines connected to these terminals. Substantial evidence exists that the use of false and misleading information and industry wide racketeering was utilized to allow industry to produce the current oversupply of natural gas and create a political and economic conditions necessary to convert the ‘‘stranded assets’’ of import terminals and pipelines for the export of natural gas. The goal of the apparent fraud and racketeering appears to be a covert effort to convert limited regional natural gas markets into an internationally traded commodity which could be used for speculative investment. The scope and impact of this apparent fraud obligates an immediate investigation, the cessation of any natural gas export permits until the full facts are made public, and the criminal prosecution of those responsible for misleading Congress and the American people.
ANDREW N. LIVERIS, CHAIRMAN & CEO, DOW CHEMICAL COMPANY, MIDLAND, MI
Dow is a major user of natural gas and natural gas liquids (NGL), both as an energy source and as feedstock for production of our products to drive the chemical reactions necessary to make useful products.
Dow’s global hydrocarbon and energy use amounts to the oil equivalent of 850,000 barrels per day, the daily energy use of Australia.
Natural gas is an essential component in thousands of everyday consumer products such as cars, appliances, paper, steel, plastic products, pharmaceuticals, and fertilizer for our farms. Natural gas provides heat, hot water, cooking and electric power to tens of millions of residential consumers.
Manufacturing in the United States is undergoing a renaissance, facilitated in substantial part by reasonable and stable natural gas prices. For the first time in over a decade, domestic manufacturers in multiple industries, including petrochemicals, fertilizers, glass, aluminum and steel, are planning to invest in production facilities in the United States. Over 100 new projects have been announced so far, representing approximately $95 billion in new investments. Dow alone is investing about $4 billion in new U.S. facilities. To a great extent, continuing optimism for U.S. manufacturing is founded on the prospect of an adequate, reliable and reasonably priced supply of natural gas.
A plentiful and affordable natural gas represents a tremendous competitive advantage for American industry. It would be misguided to take actions that threaten this advantage.
As with any other commodity, the supply of and demand for natural gas determine its price, and the balance between the two is affected by governmental policies. At the same time, U.S. manufacturers are particularly sensitive to natural gas price fluctuations.
As natural gas prices rise, manufacturers are more likely than other sectors of the economy to reduce their consumption. Because of this relatively high demand elasticity, manufacturers tend to serve as ‘‘shock absorbers’’ for the economy when natural gas prices rise. They cut consumption of natural gas, which reduces demand and mutes price volatility for others. Gas price increases undermine manufacturing jobs. The United States enjoyed relatively stable natural gas prices from the 1970s to around 2000. Between 2000 and 2009, however, U.S. industrial gas demand fell 24% as prices rose to highs of almost $14.50/MMBtu from a base of roughly $3.50/MMBtu. Job losses in the manufacturing sector totaled approximately 5.4 million between 2000 and 2009, and volatile natural gas prices were a significant factor. Manufacturing’s high demand elasticity also means that governmental policies that tend to encourage upward pressure on natural gas prices affect manufacturers more than other sectors.
Utilizing natural gas domestically would enhance employment and value added throughout the economy. As demonstrated in the chart below*, the effect of deploying 5bcf/day of natural gas in the domestic manufacturing sector would be an increase of $4.9 billion in the national value added (GDP) and a manufacturing employment increase of 180,000 jobs, both directly and through the supply chain. In stark contrast, exporting that same 5bcf/day of natural gas overseas as liquefied natural gas (LNG) would lead to a GDP increase of only $2.3 billion and an employment increase of only 22,000 jobs. Moreover, even within the construction sector the payoff from using natural gas domestically far exceeds the benefits of exporting LNG, as the plant-building construction activity associated with increasing the supply of natural gas to energy intensive, trade exposed industries is more than four and one-half times greater than the construction activity associated with LNG exports.
Shale gas production has created a short-term focus on expanded supply and the effect of that supply on market clearing prices. We believe that focus is misplaced because very few policy-making and investment decisions have an impact over such a short time horizon. Instead, investment and policy-making should be focused on both the medium-and long-term outlook for natural gas. In the medium-and long-term, domestic natural gas demand growth is expected to be driven by several factors, including: • The policy-driven shift in electricity production from coal to natural gas, • Increased investments by industry, which uses forty percent of the nation’s natural gas and gas-produced electricity, and • Increasing numbers of truck and fleet vehicles that use natural gas in lieu of conventional motor fuels. Companies in the manufacturing, transportation and utility sectors are already making investment decisions based on today’s competitive prices and the outlook for affordable and stable natural gas into the future. These decisions will play out over the next ten to twenty years. Our assessments indicate that demand for U.S. natural gas may increase by approximately 60 percent above current levels by 2035. An important corollary question is whether supply can possibly keep up with this new demand.
Congress should be circumspect about policies that could disrupt natural gas supply and pricing, such as:
Policies that focus consumption on one fuel source or that artificially accelerate demand ahead of supply, such as regulations that encourage rapid replacement of coal fired power plants with natural gas power plants. • Bans or unreasonable limitations on recovering natural gas and oil through hydraulic fracturing. • Exporting LNG without a thorough and inclusive process for evaluating the implications for domestic supply and demand, costs to consumers and manufacturers, jobs and economic growth.
Export licensing. Over 70 years ago, Congress recognized that the import and export of natural gas, a finite natural resource, can have critical implications for U.S. prosperity. In the Natural Gas Act, Congress charged the executive branch with regulating the import and export of natural gas in accordance with the public interest. The Department of Energy (DOE) has extensive experience evaluating import applications, but it has had limited experience with export applications. Perhaps not surprisingly, there are no clearly established criteria for DOE to apply in determining the public interest with regard to natural gas exporting. Dow supports expanded exports and trade. However, we also believe it is crucial that DOE have the information and analysis necessary to properly apply the Natural Gas Act requirement that exports be consistent with the public interest. We applaud DOE’s recent acknowledgement that an economic study that it commissioned is but one data point in the broad array of considerations that are relevant for a public interest determination. In short, Dow supports an approach to such determinations by DOE that is based on objective criteria and metrics, established through a public process and applied on an incremental, case-by-case basis in a consistent and balanced manner.
Today, DOE is considering 16 applications to export LNG. Since the proposed importing countries do not have a particular type of free trade agreement (FTA) with the United States, these applications are not covered by the statute’s presumption that an FTA represents a determination that the application meets the public interest test. After approving one such application, DOE has temporarily suspended the processing of ‘‘non-FTA’’ LNG export applications. Implicitly recognizing that more is at stake than can be resolved through its traditional approach to processing export applications, DOE commissioned a report from a private firm to evaluate the macroeconomic effects of higher LNG exports. As detailed in Dow’s January 24 submission to DOE1, this consultant report is fundamentally flawed and underestimates the potential harmful effects of sharply higher LNG exports.
The outstanding authorization requests present what is essentially a new challenge. In the modern era, the U.S. government has not faced the need to determine the public interest in connection with requests to authorize exports of large volumes of natural gas. This Committee should encourage DOE to continue its effort to improve the process for evaluating LNG export applications by providing an opportunity for all affected constituencies and the public at large to comment on how best to assess the public interest as it pertains to exports of natural gas.
Newly discovered sources of natural gas present a great opportunity for the United States. At the same time, natural gas remains a finite natural resource with important implications for U.S. energy security, energy independence and the environment.
Unchecked LNG export licensing can cause demand shocks, and the resulting price volatility can have substantial adverse impacts on U.S. manufacturing and competitiveness. In the recent past, the price of natural gas was very high and volatile until the advent of substantial shale gas production.
DOE interprets the Natural Gas Act’s public interest standard as creating a rebuttable presumption that a proposed export of natural gas is in the public interest. This means that DOE is to approve an application unless those who oppose the application can overcome this presumption.
The topics that DOE has identified for evaluating the public interest are too narrow and vague to capture all of the critical national, regional and local issues at stake with LNG exports or to offer any useful guidance. In response to the economic study it commissioned, DOE has received more than 370 submissions from a broad array of stakeholders covering an equally broad array of topics. The sheer number of submitted comments reflects the depth of interest regarding this issue. Unfortunately, the current process provides no assurance that DOE will consider all aspects of the public interest in any given proceeding. This is inevitable for an administrative process that depends on arguments and evidence submitted by the parties to a specific export application process. These parties are representing their specific interests, and may not adequately represent the totality of the public interest.
We believe the list below provides a good starting point for identifying specific, concrete and forward-looking criteria that DOE should evaluate in connection with LNG export applications: • Domestic manufacturing—How will exports impact natural gas prices and the supply/demand balance? Will natural gas supply be reduced? Will there be less feedstock for announced investment projects? Will the jobs created by increased exports exceed jobs lost by the manufacturing industry? Will additional exports displace U.S. consumption? • U.S. consumers—Will exports reduce the supply of natural gas available for utilities or affect consumer prices or energy costs? Will utilities decrease fuel switching to natural gas? • Energy security—Will exports reduce the volume of natural gas available for domestic use or increase the need to rely on imported petroleum? • Employment—How many new jobs will be created or existing jobs impacted? Are employment gains in the oil and gas sector offset by job losses in other areas of the economy affected by relatively higher natural gas prices? • International trade—Will exports improve the U.S. balance of trade payments sufficiently to offset falling exports in other value-adding sectors of the economy? As to proposed exports to FTA countries, are the exports destined for consumption in the FTA country or will there be transshipment of natural gas to non-FTA countries? How can export applications be disposed of in a manner consistent with U.S. trade obligations? • Environmental—What would the proposed exports’ environmental impact be? • Strategic interests—Will the exports support a strategic American ally in a meaningful way and consistent with stated policy priorities? Do proposed importing countries accord the United States reciprocal favorable international trade treatment? What are the implications for any current or proposed FTA negotiations? • Price and volatility—How is the LNG contract being priced, and is it linked to oil in some manner? What is the expected short and long term impact on natural gas and electricity price volatility? • Other regulatory impacts—What is the potential impact of other regulatory decisions on natural gas demand or supply and what is the interplay between those impacts and exports of natural gas?
We are in year four or five of a 100 year energy advantage.
None of us get the gas price right. Five years ago we had it wrong. We were building import terminals. Five years from now, what’s it going to be? How many terminals should the public interest demand? What is the public interest here? It is to get volatility and instability out of an energy price. We care about agriculture here in this country. We care about defense. We should care about energy. This opportunity to get it right by doing both in the public interest means we should take a crawl- walk-run approach to how many terminals we approve and how many of these occur over time. As I said in my testimony, we’re in the fifth year of our 100-year advantage. You can’t move factories overnight, to state the obvious. Why put at risk the 5 million jobs, the $96 billion worth of investment that are on the books today? Over 60 companies, why put that at risk by doing either or? Why transfer the risk? So be cautious, do what the public interest demands and the DOE application process. I agree, financing will be difficult. I agree, prices will be volatile. But why take the risk and let the speculators set the gas price like they did 10 years ago, and we all remember the Enron’s and what the efficient market did for us 10 years ago. It was hardly efficient. OK. It was very inefficient.
Gas, as already noted, has to be liquefied and shipped at billions and billions of dollars. That is not an open market, that’s a point to point contract. There’s probably 30 of these contracts around the world from nation states to nation states.
ROSS EISENBERG, VP, ENERGY & RESOURCES POLICY, National Assoc of Manufacturers
The NAM is the nation’s largest industrial trade association, representing nearly 12,000 small, medium and large manufacturers in every industrial sector and in all 50 states. Manufacturers are major energy consumers, using one-third of the energy consumed in the United States. For manufacturers, natural gas is a critical component of an ‘‘all-of-the-above’’ energy strategy that embraces all forms of domestic energy production, including oil, gas, coal, nuclear, energy efficiency, alternative fuels and renewable energy sources.
Natural Gas—Fueling Growth in the Manufacturing Sector. The natural gas boom has provided major opportunities for manufacturers across the supply chain. Upstream, manufacturers design and construct drilling facilities; supply machinery and materials, such as cement and steel for hydraulic fracturing and well completion; and perform a wide range of support activities and services for the natural gas extraction process. Midstream, manufacturers provide needed infrastructure, such as pipelines, compressor stations, storage facilities and processing facilities. And downstream, the possibilities-from chemicals to windows to toys to electricity-are truly endless.
The natural gas manufacturing supply chain extends even further. All of this new activity will require roads and bridges, which, in turn, requires concrete, brick, gravel and steel. Drilling sites will need vehicles, fuel and significant water supplies- which will need to be supplied, transported and treated. Site employees will need uniforms, and those uniforms will need to be cleaned and maintained. The list goes on and on.
As more natural gas is recovered, domestic manufacturers gain a substantial cost benefit relative to their international competitors. Thanks to newfound supply and price stability, manufacturers in the United States enjoy natural gas prices considerably lower than in China, India, Brazil, Japan and the United Kingdom.1 This is a very important point, since the NAM estimates that due to domestic tax, tort and regulatory policies, it is 20 percent more expensive to manufacture in the United States than in any of its nine largest trading partners-and that excludes the cost of labor. Manufacturers in the United States enjoy a slight competitive advantage regarding energy, and with the right policies, this advantage can grow.
Chemical manufacturers had been the largest beneficiaries of this new abundance of natural gas, owing primarily to less expensive ethane, a natural gas liquid derived from shale gas. PwC identified Bayer Corporation, Chevron Phillips Chemical Company, Formosa Plastics Corporation and Westlake Chemical Corporation as companies taking early advantage of the shale gas boom.
PwC found that the benefits of shale gas for manufacturers were not limited to the major natural gas users; the benefits extended throughout the supply chain. According to PwC, companies that sell goods, such as metal tubular products and drilling and power equipment, were likely to experience near-term growth in sales as domestic natural gas production rates increased. PwC identified projects by U.S. Steel and Vallourec Ohio intended to supply steel pipe and related materials for shale gas extraction activities. These higher production levels would also yield benefits higher in the value chain, such as manufacturers of components used in drilling equipment. Overall, PwC found that 17 chemical, metal and industrial manufacturers commented in SEC filings in 2011 that shale gas development drove demands for their products, compared to none in 2008.
In the 13 months that have passed since PwC released its study, the impact of new supplies of natural gas on manufacturing has become even more pronounced. Nucor embarked on plans to develop a $750 million iron facility in Louisiana and announced a $3 billion joint venture with Canadian oil and gas producer Encana for 20 years of access to its natural gas wells.3 Mitsubishi announced plans to build an acrylic-resin processing plant adjacent to a newly constructed ethylene plant.4 Fertilizer manufacturer CF Industries announced that it will spend $2.1 billion to expand its fertilizer manufacturing operations.5 Formosa Plastics Corporation increased the size of its Texas ethylene plant included in the 2011 PwC6 report. Even foreign manufacturers are now seeking to build operations in the United States. Austrian steel manufacturer Voestalpine AG announced in late 2012 it plans to build a $661 million steel factory in the United States.7 South African energy company Sasol announced plans to construct America’s first commercial gas-to-liquids plant in Louisiana, an $11 billion-$14 billion venture.8 Egyptian fertilizer manufacturer Orascom Construction Industries plans to build a $1.4 billion nitrogen fertilizer production plant in Wever, Iowa.9 Canadian methanol producer Methanex announced in 2012 that it will dismantle a methanol plant in Chile and move it to Ascension Parish, Louisiana.10 BlueScope Steel Limited, an Australian company, is building a steel factory in Ohio in partnership with U.S. manufacturer Cargill.11 And Indian manufacturer Essar Global Limited is planning a steel facility for Minnesota.12
Last June, a report by independent global energy research firm IHS CERA predicted that the share of U.S. natural gas produced from unconventional sources will reach 67 percent by 2015 and 79 percent by 2035. 13Fullenbaum, Richard, and John Larson, The Economic and Employment contributions of Unconventional Gas Development in State Economies, June 2012, available at http:// www.anga.us/media/content/F7D4500D-DD3A-1073-DA3480BE3CA41595/files/ statelunconvlgasleconomiclcontribution.pdf .
This would lead to $3.2 trillion in investments to develop the resource
Natural gas liquefaction is a manufacturing process. To convert natural gas to LNG, the gas is purified by removing any condensates, such as water, oil and mud, as well as other gases, such as carbon dioxide and hydrogen sulfide and trace amounts of mercury. The gas is then supercooled in several stages until it is liquefied and ready for shipping.
NATURAL GAS AND MANUFACTURING Industry relies on natural gas for much of its energy needs and as a raw material.
FRANCES BEINECKE, PRESIDENT, NATURAL RESOURCES DEFENSE COUNCIL
(many of the references are at the bottom of this post)
Today, there is an extraordinary mismatch between the ever growing scale of fracking—which is occurring in about thirty states—and the limited scope of measures to govern it. Indeed, companies engaged in fracking are not even required to provide enough information to enable scientists and the public to fully understand the nature or extent of the environmental and health risks fracking poses.
Oil and natural gas production are expanding across the nation, largely because advanced hydraulic fracturing (also known as ‘‘fracking’’) and horizontal drilling have made it easier to extract oil and gas from previously inaccessible or uneconomical sites. Fracking involves injecting water and chemicals deep into the earth at extremely high pressure to break up layers of rock that harbor deposits of natural gas and/or oil. Hundreds of thousands of new oil and gas wells have been drilled in the past decade, and oil and gas development is now occurring in about thirty states and under consideration in other states.3 According to some reports, about 90 percent of new wells in North America are fracked (4)
Shale gas production comes with the risk of a range of environmental and health impacts, including contaminated drinking water supplies; the release of methane, a potent greenhouse gas; unhealthy air quality; poorly managed toxic waste disposal; impairment of rivers and streams; disruption of communities; and destruction of landscapes and wildlife habitat. These impacts stem from all aspects of the shale gas extraction process, including hydraulic fracturing itself, site development, well construction , water, wastewater and waste management; and well operation, trucking and other activities that result in air emissions-especially emissions of air toxics, ozone-forming pollutants and methane, a highly potent greenhouse gas.5
Natural gas producers are not required by any federal law to identify the chemicals in the fracking fluids they are injecting into the ground, and state disclosure requirements vary widely. Of the states where fracking takes place, only fourteen states require some level of public hydraulic fracturing disclosure and none of these provides comprehensive disclosure. An NRDC analysis found that even where some disclosure is required, the public is hampered in getting this most basic information about fracking. For example, • In some states it is difficult for the public to access the information disclosed; • Only seven of fourteen states mandate the chemical identification of all additives used in fracking fluids; • Only one state has a clear process for evaluating and approving or denying trade secret exemption claims; and • Only six states provide for access to trade secret information by health care providers.10 In addition, enforcement of state rules is uneven; NRDC has found that state agencies have accepted disclosure reports that lack required information.
The lack of standardized, national disclosure greatly hampers the ability of researchers to study the impacts of fracking on health and the environment. Scientists need transparent, thorough and consistent information on what chemicals different communities are being exposed to. The variation in disclosure requirements among states makes it difficult to do comparative studies and deprives communities of information they have a right to know.
Health Concerns Related to Drinking Water and Air Pollution Scientific concern about the health impacts of fracking are growing. In April 2012, the Institute of Medicine (IOM), part of the National Academy of Sciences, convened a two-day workshop of public health experts that included more than a dozen presentations raising concerns about the health implications from natural gas development.11 Additionally, government agencies, including the Agency for Toxic Substances Disease Registry (ATSDR) within the Department of Health and Human Services (HHS) and the Environmental Protection Agency (EPA), have investigated and found risks from individual sites and practices.12 Health-related advisories and informational resources have been made available by the National Institute for Occupational Safety and Health (NIOSH), the Occupational Safety and Health Administration (OSHA)13 and the Pediatric Environmental Health Specialty Units (PEHSU).14
Some of the pollutants associated with fracking are also known to cause the same types of respiratory and/or neurological problems that are the focus of concern in impacted communities. Some of these chemicals are also well- established as carcinogens. 15 Fracking also can generate pollution from hazardous substances, including metals, radioactive material, methane and other volatile organic compounds (VOCs), that are found in the geologic deposits being exploited and brought to the surface in the drilling, fracking, and production processes. Chemicals in Drinking Water.—Because fracking is exempt from many environmental monitoring requirements, there are inadequate data on the impact of natural gas production on water contamination. However, data from private wells and a published investigation raise concerns that water contamination from fracking is creating health risks. Potential contaminants include methane, organic chemicals (including benzene, a known carcinogen), metals and radioactive elements. A published study from Pennsylvania documented evidence of drinking water contamination with methane associated with shale gas extraction. These researchers found increased levels of methane in wells closer to well sites including levels that present an explosion hazard for residents. 16 Other household-level investigations conducted by state and federal agencies have also found methane levels in drinking water in homes near drill sites that were caused or are suspected to have been caused by oil and gas operations and present an explosion hazard as well as an asphyxiation hazard for residents. 17 One study reported severe impacts to livestock, including reproductive abnormalities, acute kidney or liver failure and death, in animals that drank from polluted ponds and creeks near fracking operations. 18 The same study also documented a family living near a fracking site that reported symptoms such as headaches, nosebleeds, and skin rashes; the symptoms subsided when the family was relocated, suggesting a causal link with the nearby fracking operations.
Studies linking specific health impacts to drinking water contamination resulting from fracking operations have not yet been conducted, which illustrates the results of under-regulating this industry, but the evidence suggests that current practices may be exposing families to unsafe levels of contaminants.
Air Emissions. Fracking operations release air pollutants that can have health consequences at the local and regional level. As with water, researchers are hampered because fracking operations have been exempted from many monitoring requirements. But some of the health complaints reported by people living near fracking sites, particularly respiratory and neurological symptoms, are consistent with exposure to the chemical contaminants identified in some monitoring reports./ 19/ All of this underscores the urgent need to require effective pollution control equipment and community-level air quality monitoring to better assess the exposures and potential health risks. In the meantime, there is a strong rationale for reducing this contamination immediately to prevent potentially harmful exposures. The research, monitoring data, and public health expertise available to date indicate that natural gas facilities produce air pollution that can increase health risks. These risks increase with proximity, particularly for populations more vulnerable to the impacts of air pollution, which include children, elderly, and those with underlying health problems. Fracking activities expose communities to a range of harmful air pollutants, including known carcinogens, and respiratory, neurological, immunological and reproductive toxins. These pollutants are present in the diesel emissions released by truck traffic and heavy equipment use. Additionally, fracking operations can expose communities to silica dust, which causes lung disease. Workplace investigations at fracking sites have identified both silica and diesel as posing a health hazard for workers exposed on the job site.20 Since state laws allow drilling as close as 100 feet to residences, sensitive populations, such as children, may also be threatened by this pollution. VOCs released from natural gas wells and processing facilities have been shown to play a significant role in increasing unhealthy air quality, including from ground- level ozone. In the past year, four published studies have identified pollution from oil and gas facilities, where fracking is being deployed, as a source of pollutants contributing to regional ozone in Colorado, Texas, and Pennsylvania.21 22 23 24 Ground- level ozone is a powerful respiratory toxicant that is well known to aggravate asthma and other respiratory conditions. Additionally, a study in Colorado found elevated levels of air pollutants close to well sites during well production. Taken together, these pollutants were found to be high enough to put nearby residents at risk for respiratory and neurological health impacts.25 In addition, proximity to these facilities can also subject individuals to light and noise pollution, wastewater spills, noxious odors, and increased health and safety risks from explosions and other malfunctions. For this reason, as noted above, separating vulnerable populations from sources of air pollution and other hazards, should be an integral part of ensuring health and safety. All of these indications of health risks are cause for concern, underscoring the need to better protect the public. That means requiring mandatory disclosure of all chemicals used in fracking, thorough evaluations of potential health threats, the best possible pollution controls and drilling and fracking standards, and increased air and water monitoring both before and after drilling and fracking begin.
Climate Change Impacts. When natural gas is burned at a power plant to generate electricity, it emits far less carbon pollution than coal-based electricity. 26 But the production of natural gas produces significant methane emissions 27 Methane, which makes up as much as 90% of natural gas, is a potent global warming pollutant, trapping at least 25 times more solar radiation than carbon dioxide over a 100-year period. According to both the EPA’s national inventory of greenhouse gas emissions and the EPA’s tabulation of individual companies’ emission data reports,28 the oil and gas industry is the nation’s second largest industrial emitter of greenhouse gases (mainly methane and carbon dioxide), surpassed only by electric power plants. 29 Currently, methane leaks into the atmosphere at many points in the natural gas production and distribution process—from wells during extraction, from processing equipment while compressing or drying gas, and from poorly sealed equipment while transporting and storing it. While much better data are needed, EPA estimates that at least 2 to 3 percent of all natural gas produced by the U.S. oil and gas industry is lost to leaks or vented into the atmosphere each year30, and some recent studies suggest that the actual leak rate could be much higher.31 Preventing the leakage and venting of methane from natural gas facilities would reduce pollution, enhance air quality, improve human health, and conserve energy resources. The oil and gas industry can afford methane control technologies. Indeed, capturing currently wasted methane for sale could bring in more than $2 billion of additional revenue each year. Ten technically proven, commercially available, and profitable methane emission control technologies together can capture up to 80 percent of the methane currently going to waste.32 EPA, other federal agencies, and the states should move to require use of these technologies for methane control, and industry itself should move quickly to adopt these measures. Last year, EPA issued a Clean Air Act rule to curb VOC emissions from new and modified sources in the oil and gas industry.33 While this is a step forward, the rule is not strong enough and doesn’t cover existing sources.
EPA should also regulate methane directly, which would achieve much larger emission reductions. D. Water Pollution In addition to the risk of contaminating drinking water, shale gas extraction can pollute streams, rivers, lakes and other waterbodies.34 This can happen in a number of ways, including the following: 1. Depletion of Water Resources.—Large volumes of water are required for fracking operations. Fresh water is often taken from local waterbodies. Because water can be contaminated when it has been used for fracking, it cannot be easily be returned to these waterbodies. Permanent loss of water from fresh water resources can harm water quality and availability and also aquatic species and habitat.35
Spills and Leaks of Fracking Chemicals and Fluids.—Fluids, including hazardous chemicals and proppants used in the fracking process, are typically stored in tanks or pits on site. If not stored properly, they can leak or spill, polluting nearby waterbodies. Fluids can also be stored at a centralized facility near multiple well pads and then be transported to the well by trucks or by pipeline, providing another opportunity for leaks and spills during transit. Fracking fluid can also spill during the fracking process. Leaks from tanks, valves, and pipes, as a result of mechanical failure or operator error at any point during these processes, can and do contaminate groundwater and surface water.36 3. Mismanagement of fracking waste.—After fracking, some of the fracking fluid, often referred to as flowback, returns up the wellbore to the surface. In addition, naturally occurring fluid is brought to the surface along with the produced oil or gas (referred to as ‘‘produced water’’). This waste, consisting of both flowback and produced water, can be toxic, and the oil and gas industry generates hundreds of billions of gallons of it each year.37 In addition to the chemicals that were initially injected, flowback and produced water may also contain hydrocarbons, heavy metals, salts,38 and naturally occurring radioactive material. The wastewater is sometimes stored in surface pits. If the pits are inadequately regulated39 or constructed, they run the risk of leaking or overflowing and can pollute groundwater and surface water.40 The waste may also be disposed of on the surface, reused in another well, re-injected underground, or transported to a treatment facility. Each of these forms of wastewater management carries its own inherent risks, including spills, leaks, earthquakes (in the case of underground injection) and threats to groundwater and surface water. 4. Stormwater Pollution.—During a rainstorm or snowstorm, flowing water causes soil erosion and picks up pollutants along the way, including toxic materials and sediment, and these materials can flow into local waterbodies. Stormwater from fracking operations can be particularly polluted because of chemical and oil and gas residues. (Yet, as is described below, the oil and gas industry is exempt from the stormwater permitting requirements of the Clean Water Act).
Oil and gas development can destroy wildlife habitat and sensitive lands if siting does not take these factors into account. Natural gas production operations involve extensive road building and construction of wellpads that can fragment and destroy habitat and cause species to leave their historic breeding and nesting grounds. Light and noise disturb wildlife populations and may drive them to lower quality habitat, and runoff and spills can pollute aquatic habitat.44 F. Community Impacts Oil and gas development can fundamentally change the nature of communities. Fracking is a heavy industrial activity that entails substantial construction, heavy truck traffic, traffic accidents, and noise and light pollution45. It often attracts an influx of out-of-state workers that can bring increases in crime and violence, sexually transmitted diseases and community strife that can stress local emergency, health and other community resources.46 Under many state laws, oil and gas rights take precedence—or are interpreted as taking precedence—over surface ownership, so oil and gas wells and the associated industrial activity-including chemical and waste storage and disposal-can be located in residential or agricultural areas regardless of zoning or even the wishes of individual property owners. To address these issues, NRDC has launched a Community Defense initiative to provide legal assistance to localities that seek to hold natural gas extraction to appropriate scientific standards, protect their property or exclude oil and gas production from their communities.47
SAFE DRINKING WATER ACT (SDWA) Fracking is exempted from the SDWA unless diesel is used in the fracking process, under a provision enacted in the Energy Policy Act of 2005.48 This exemption prevents the Safe Drinking Water Act from protecting underground sources of drinking water from fracking impacts and exempts the siting, construction, operation, maintenance, monitoring, testing, and closing of fracking sites from regulation under the SDWA. 43 http://www.denverpost.com/environment/
CLEAN WATER ACT Oil and gas operations are exempt from the storm water runoff permitting requirements of the Clean Water Act.49 With this exemption, there is no way to know if a company has an adequate Storm Water Pollution Prevention Plan in place to reduce the discharge of pollutants to receiving waters, and to eliminate illegal discharges. CLEAN AIR ACT The oil and gas exploration and production industry is exempt from critical Clean Air Act requirements to adequately assess, monitor, and control hazardous air pollutants.50 This makes it impossible, under existing regulatory statutes, to perform an adequate assessment of air pollution health risks to nearby communities and require adequate safeguards. Excluding this important category of air pollution and air contaminants significantly underestimates the health risks posed by this industry. HAZARDOUS WASTE MANAGEMENT AND SUPERFUND STATUTES Oil and gas waste is exempt from the central federal hazardous waste management law—the Resource Conservation and Recovery Act—including testing, treatment and disposal provisions that govern the assessment, control and clean-up of hazardous waste.51 Similarly, the oil and gas industry is protected from liability for spills under the Comprehensive Environmental Response, Compensation and Liability Act (the Superfund statute), which adopts the same definition of hazardous waste.52
NATIONAL ENVIRONMENTAL POLICY ACT (NEPA) Under a special provision of NEPA, when oil and gas companies lease federal lands, they are often exempt from customary environmental review requirements applicable to other industries.53 A recent Government Accountability Office study found that in a sample from fiscal years 2006-2008, the oil and gas industry received almost 6,900 categorical exclusions (CXs) that waived further environmental review under NEPA. Of that total, almost 6,100 of those CXs were used to waive requirements for permits to drill.54
After electric generation, other primary uses of natural gas energy are in buildings and industrial applications. There are many opportunities to use natural gas more efficiently in these settings. Enhanced building energy codes and stronger efficiency standards for appliances, equipment and cooling and heating systems are among the best ways to use natural gas more efficiently. As is explained in a recent report by the Alliance to Save Energy’s Commission on National Energy Efficiency Policy (on which I served), it is important that DOE stay on track to meet all of its statutory deadlines and responsibilities to strengthen energy efficiency standards for natural gas and electric appliances.58 After a strong start at the beginning of the last term, DOE has fallen behind on this important responsibility.
KENNETH B. MEDLOCK, III, JAMES A. BAKER, III, AND SUSAN G. BAKER, fellow in energy & resource economics, & senior director, center for energy studies, JAMES A. BAKER III INSTITUTE FOR PUBLIC POLICY RICE UNIVERSITY, HOUSTON, TX
According to the US Energy Information Administration, gross withdrawals from shale gas wells in the United States has increased from virtually nothing in 2000 to over 23 billion cubic feet per day (bcfd) in 2011, representing over 29% of total gross production in the US. Moreover, a recent Baker Institute analysis indicates shale gas production could reach over 50% of all domestic natural gas production by the 2030s.1
CNG Vehicles. Currently, natural gas use in transportation is only 0.13% of total gasoline use. So, there is a lot of room for growth. In fact, a 10-fold increase in demand would push demand to about 0.9 bcf/day, which is an increase the U.S. market could absorb with relative ease. But, for the low levels of demand that currently exist to change, it will take substantial investment in fueling infrastructure and large adoption of compressed natural gas vehicles (CNGV) by consumers.4
One thousand cubic feet of natural gas yields eight gallons of CNG. So, if natural gas price is $4/mcf then the cost of natural gas as a feedstock for CNG production is $0.50/gallon. Adding the processing costs for CNG of approximately $1.00/gallon, we have an estimated wholesale price of $1.50/gallon.
The wholesale price of gasoline on the NYMEX is currently at $3.00/gallon. If these prices persist, the per gallon fuel cost of CNG is about half the cost of gasoline, before accounting for things such as distribution costs, profits, local and national taxes, and lease payments by station owners. Assuming all these additional costs are equal for CNG and gasoline, we still have a differential between fuels of about $1.50/gallon.
We could also discuss liquefied natural gas (LNG) options into transportation, but this is primarily for large trucks and local maritime transport.
Despite the preceding cost per gallon comparison, cost per gallon is not the appropriate metric for comparison. We must compare the cost per mile of each fuel option. In order to do this for privately-owned vehicles, we need to incorporate the efficiency of a CNGV and a comparable gasoline hybrid vehicle. Then, we can calculate the annual fuel cost savings for each vehicle type.
If we compare the Honda Civic, for example, we have a gasoline hybrid engine efficiency of 44 miles per gallon in the city. The Honda Civic CNGV has a city driving efficiency of 27 miles per gallon. Thus, the cost per mile is $0.0126 lower for the Civic CNGV. If we assume annual driving of 12,000 miles, the fuel savings is $151/year. Assuming a 7 year vehicle life, we see an undiscounted lifetime savings of just over $1,060. The current MSRP for a Civic CNGV is $26,305, and the current MSRP for a Civic Hybrid is $24,200, meaning the price difference is currently $2,105. Thus, the fuel cost savings does not compensate the higher upfront cost of the vehicle. If we discount future savings, the disparity grows. So, the CNGV is not the most attractive option to the consumer looking to purchase a vehicle that also reduces gasoline demand. If annual mileage jumps to 24,000 miles per year, then the undiscounted fuel cost savings just compensates for the fixed cost differential over 7 years. So, high mileage is a prerequisite for the CNGV option to make economic sense given these fuel costs.
The current pricing differential between natural gas and gasoline has been sufficient to promote adoption of CNGVs in commercial fleets. However, commercial fleet opportunities are small when compared to the fleet of privately owned motor vehicles. So, while an economic argument can be made for natural gas into high-mileage commercial fleets, the same is not true for private vehicles, which, absent a change in fixed costs differentials, will limit the movement of natural gas into private vehicles.
Aside from the cost differences, another issue that stands in the way of large scale CNGV adoption is a lack of re-fueling infrastructure. There are currently about 1,100 CNG fueling stations and 59 LNG fueling stations nationwide. These facilities primarily serve large trucks in the case of LNG and light duty trucks in the case of CNG. But, the ability to refuel becomes an issue when one considers the current consumer driving behaviors. In particular, the flexibility implicit in the existing fuel delivery infrastructure (for gasoline) allows drivers the freedom to plan their activities without necessarily planning routes so that they coordinate with re-fueling opportunities. This point is what leads us to the so-called ‘‘chicken-and-egg’’ problem. Namely, consumers bear a cost if they have to search for re-fueling stations (a so- called ‘‘search cost’’), and this cost can prevent them from buying a CNG vehicle, even if the projected fuel savings compensates for the incremental fixed cost. In turn, station owners may be reluctant to install CNG re-fueling capability if CNGVs are not prevalent enough in the vehicle stock to guarantee some demand for the station’s services. Hence, the conundrum—how does one overcome this mismatch to ensure coordinated growth in both CNGVs and re-fueling locations?
Electric Vehicles. Many of the issues facing CNGV adoption into the private vehicle fleet are also faced by EVs, but by differing degrees. Cost of ownership is certainly an issue, as most EVs are more expensive than their non-EV counterparts. Of course, the low cost of electricity can provide significant fuel savings, but even if EV fuel costs are driven down near zero, the projected 7 year undiscounted savings approaches $5,600. The base model Ford Focus EV lists an MSRP of $39,200. This compares with the gasoline-powered base model Ford Focus MSRP of $16,200. So, just as with EVs, the difference in fixed cost is not fully compensated by the fuel savings. Even with the federal tax credit of $7,500, the fuel savings is not sufficient. In other words, rational individuals who buy an EV are doing so for some additional derived benefit.
Aside from the issue of cost, there are also issues associated with re-fueling. Refueling electric vehicles has both short term and long term components. In the short term, the existing generating fleet is sufficient to meet almost any expectation of electricity demand growth associated with EV penetration. Moreover, many consumers can re-charge at home, and in some cases re-charging capability is available at work and other non-residential locations. But, the availability of non-residential re-charging stations is not sufficient to support wider adoption of EVs. As of September 2012, according to the EIA there were 4,592 non-residential re-charging locations in the U.S., where some locations have multiple charging units. Moreover, most of these locations are in only a couple of states. The location of re-charging stations becomes a relevant issue primarily when long distance travel is desired. Currently, range is limited to less than 100 miles per charge in most commercially available EVs on the market today.5 This creates logistical issues for consumers who wish to drive more than 100 miles for a weekend getaway. If we think about the prospects of EVs longer term, investments in charging stations can be made, particularly if consumers show a propensity to buy EVs.
Even if the proverbial ‘‘chicken-and-egg’’ problem of vehicles and infrastructure can be overcome, the resulting requirements for new electric generation capacity cannot be understated. If EVs are widely adopted into the vehicle fleet, a recent Baker Institute report put the projected growth in power generation requirements are 5%, 12% and 21% higher than the ‘‘business as usual’’ case in 2030, 2040 and 2050, respectively.
6 See ‘‘Energy Market Consequences of Emerging Renewable Energy and Carbon Dioxide Abatement Policies in the United States,’’ by Peter Hartley and Kenneth B Medlock III (Sept 2010), available at www.rice.edu/energy.
the licenses of 93 existing nuclea r power plants would expire before 2030 and these would need to be extended, or the plants repl aced, before nuclear capacity could increase on net.
The majority of this incremental demand for electricity would likely be met by natural gas. However, it is important to recognize that this incremental demand will take decades to materialize, absent government regulations that accelerate the process.
There are other costs that exist, some of which are not even in the current discussion. Cost of expanding and upgrading electricity infrastructure can become an issue. Effectively, current mechanisms would force non-EV owners to subsidize EV expansion. This could become a political issue. Moreover, currently 18.4 cents per gallon of gasoline purchased flows into the National Highway Fund to support construction and maintenance of public infrastructure. As the gasoline base diminishes, the fund will still need to be solvent, so electricity and natural gas will need to be taxed accordingly. Currently, no such tax exists, so it is left out of most breakeven calculations for purchase of CNGVs and EVs. In the case CNGVs, assuming refueling infrastructure is added, a tax at the pump can be instituted in much the same manner as is currently done with gasoline purchases. But, its implementation will almost certainly be protested by early adopters of CNGVs as it could represent an ex post unexpected increase in the cost of ownership.
In the case of EVs, if mechanisms are proposed whereby electricity sales are taxed, then again, non-EV owners are subsidizing EV expansion. While centralized refueling stations are a possibility, their installation is still a pre-requisite capital expense. Moreover, the issue of tax payments is still present. It is more likely that EV owners will recharge at home. So, a mechanism to tax the owners of EVs specifically must be considered. Just as with early adopters of CNGVs, any tax implemented will represent an ex post unexpected increase in the cost of ownership, and will likely be met with resistance.
INDUSTRIAL DEMAND FOR NATURAL GAS There are, of course, also ample opportunities for demand growth in traditional, non-transportation end-uses. Power generation and industrial uses make up the bulk of natural gas demand on an annual basis. Seasonally, the balance shifts more heavily to space heating applications in residential and commercial end-uses, specifically in winter months, but the general trends in annual demand growth are set by industrial and power generation uses. In 2012, power generation comprised 36.1% of annual demand and industrial comprised 32.1%.7 Moreover, the recent low price environment has natural gas use in both sectors poised to grow.
Industrial most recently demand peaked in 1997 (see Figure 1*) reaching levels similar to what was witnessed in the early 1970s. It steadily declined thereafter due to lower cost natural gas in international locations. Industries such as the ammonia and fertilizer industries were heavily favored by lower cost feedstocks elsewhere, and the late 1990s and early 2000s saw many of these types of industrial gas consumers shutter operations in the US Gulf Coast region choosing to move abroad. However, much of this has changed in the last few years, and industrial demand has actually grown since 2009, a trend bolstered by low cost natural gas supply due to growth in shale gas production. 5 For example, the Ford Focus EV has a range of 76 miles and the expectation for continued strong supply and stable pricing is being seen in the slate of recent announcements by firms to expand their businesses that rely on natural gas as a feedstock and energy source. Dow Chemical, an industrial user of natural gas, has recently announced a number of significant expansion plans in Texas.
Other industrial firms have also announced plans to expand domestically. Methanex has moved forward with plans to relocate its Chilean facility to Geismar, Louisiana, and Sasol has announced intent to move forward with a GTL project in Southwest Louisiana. In short, if price does stay low and relatively stable, it is possible that industrial demand could rise to levels not seen since the mid-1990s. This would represent an over 18% increase in industrial gas demand from its current levels. It is important to point out that the long term trend seen in the industrial demand sector bears resemblance to a cycle. Indeed, even the recent growth in industrial demand has been modest in comparison to power generation use. Nevertheless, the past few years have seen a renewal of industrial demand for natural gas. Moreover, the planned capital expenditures by gas-intensive industrial players are quite large
POWER GENERATION DEMAND FOR NATURAL GAS. Natural gas demand in the power generation sector has substantial growth opportunity through fuel substitution, and it can occur in a relatively short time frame. In 2012 we saw a dramatic increase in the use of natural gas in power generation through substitution with coal. In fact, the natural gas share of power generation in 2012 rose to over 30%, which was up from an annual average of 17.9% just 10 years ago. This is in stark contrast to coal, which has seen its market share deteriorate from 50.8% to 36% in the same time frame. In fact, much of the drop in coal’s share in power generation is directly attributable to grid-level switching to natural gas. The rise of gas use at the expense of coal was primarily the result of relatively low natural gas prices, and the fact that there is sufficient natural gas generating capability to allow for large scale, grid-level fuel switching. Much of the existing natural gas fleet that can capitalize on relative price movements was brought into service between 2000 and 2005 (see Figure 2). In fact, natural gas generation capacity surpassed the installed capacity of coal in the US in the early 2000s. Moreover, most of the capacity that was added employs the latest generation combined cycle technology, meaning its thermal efficiency is substantially higher than the majority of the existing coal fleet.
The price of natural gas regularly at a competitive advantage to coal in power generation then older units of the coal fleet will be retired. Initially, the existing natural gas generation fleet will pick up the slack, but eventually, new builds of high efficiency natural gas combined cycle units will be required. This raises the natural gas pricing point for parity because a greenfield expansion must include the cost of capital. However, when one also accounts for the environmental regulations that the US Environmental Protection Agency (EPA) seeks to impose via recent rule-makings, then the competitive balance shifts in favor of natural gas.9
LNG EXPORTS A recent paper by Medlock (2012)19 argues that the volume of LNG exports from the US will ultimately be contingent upon domestic market interactions with the international market. This is because US LNG exports will occur in a global setting, meaning the entire issue must be considered as a classic international trade problem. Only then will any insight be gained with regard to export volumes and thus US domestic price impacts. The paper goes on to argue that (a) the impact on US domestic prices will not be large if exports are allowed, and (b) the long-term volume of exports from the US will not likely be very large given expected market developments abroad.
The bottom line is that the entities involved in LNG export projects may be exposed to significant commercial risk. Much of this conclusion derives from a relatively straightforward analysis of domestic and international natural gas prices taking into consideration the effects of short term deliverability constraints. Indeed, the argument is made that the existing spread in prices between the US, Asia and Europe is transitory.
Spot prices in the UK, US and Asia all move together until the middle of 2010. At that point, the US price begins to drift below the prices in the UK and Asia. This is largely the result of growth in shale gas production in the US. A significant break in the pricing relationship between Asia and Europe occurs at a specific date, March 11, 2011, the day of the disaster at Fukushima. The Asian spot price jumped by almost $2/mmbtu within a week and continued to climb through the end of the year with the closure of every nuclear power plant in Japan. This was the result of an unexpected demand shock as Japanese utilities scrambled to buy any available LNG for power generation. At the same time, the spread between the US and Asia was exacerbated by a negative demand shock in the US. Namely, the winter of 2011/12 was one of the warmest on record in the US, resulting in very low winter heating demands. As a result, natural gas inventories remained very robust and the market was oversupplied, leading to a price collapse to below $2/mmbtu in April 2012. As a result, the spread between the US and Asia rose to as high as $15/mmbtu.
The interest in exporting LNG from the US also accelerated during this period. However, it is reasonable to expect Asian price to revert back to its pre-Fukushima relationship with European price as the current deliverability constraints subside—due to new supplies and reactivation of nuclear capacity in Japan. The LNG export opportunity looks a bit more sobering if that occurs. Importantly, if we consider a longer term view of regional prices, we can begin to understand the potential risk in myopic decision making. Figure 5 indicates annual average price delivered to consumers in Asia, the UK and the US from 1980 through 2012. We can see from 2000-2008 the US price was rising, and it coincides with the period during which LNG regasification capacity was constructed with an aim to import LNG to the US. However, the period since 2008 is characterized by a wide divergence in regional prices, and this coincides with the emerging interest to export LNG. One must consider the longer term price relationships because the recent past is not a prelude to the future. In fact, the 20 years prior to the 2000s is characterized by a relatively stable relationship between the regional market prices that saw Asian prices at a consistent but relatively small (to recent history anyway) premium to prices in Europe and the US. One must, therefore, question the nature of the recent divergence in regional prices.
The conclusion reached in the study by Medlock was one of very low export volumes from the US because the pricing premiums that exist today will not likely persist due to new supplies from a variety of sources as well as reactivation of nuclear reactors in Japan. In effect, the high prices in Asia encourage responses on many margins and thus result in a reduction in price. This follows from the adage, ‘‘the best cure for high prices is high prices.’’ 19‘‘US LNG Exports: Truth and Consequence’’ available at www.bakerinstitute.org.
All the information, when taken together, points to a series of cause-and-effect relationships that present challenges for some margins of response and opportunities for others. It will be surprising if ‘‘all of the above’’ actually results in a market- driven equilibrium. The traditional consuming sectors, specifically industry and power generation, face fewer obstacles because the mechanisms for demand growth—infrastructure and technology—are already in place.
Natural gas into transportation may be a mixed outcome, with fleet vehicles—because they are high mileage vehicles—being the most successful in migrating natural gas into the fuel mix. Absent a policy intervention or a cost reduction, passenger vehicles still face hurdles to large scale penetration of CNG due to lower mileage.
The likelihood of demand pull coming from international sources in the form of LNG exports is high, but not in large quantities. This follows from the fact that US prices will likely rise to reflect marginal costs and international prices are not likely to remain at their current premiums. In fact, if the Asian price reverts back to its pre-Fukushima relationship with European price then the margin for profitable export of LNG from the US becomes razor thin. Thus, market forces will ultimately limit the volume of US LNG exports. So, perhaps what is needed for demand growth for natural gas is a relatively simply prescription—economic growth. Economic growth stimulates demand for electricity and industrial goods, both of which favor natural gas. Moreover, as demands in these traditional sectors grow, this will create competition for supplies of natural gas for LNG exports and new demands. It is for this reason that the most likely demand for the robust supply of natural gas in the US will come from industrial and power generation uses. Transportation and LNG exports will likely remain marginal influences at best.
Governor HICKENLOOPER, Governor of Colorado.
I think it was 1982 and 1995 that the Federal Government invested over $5 billion in terms of trying to create this ability to extract shale gas from tight shales and to get oil from tight shales. We have to recognize that renewable energy such as wind and solar is intermittent and certainly as we are faced with challenges on storage we need ways to be able to have electrical energy generation go on and off efficiently. Natural gas does that at a level that literally almost no other energy can do, so it becomes a perfect partner for solar and wind. I think it will prove to be the transition energy that will allow us eventually to get to a fully renewable energy environment.
So, I made several points. Firstly, the world market for gas does not exist; it’s a world oil price. The world oil price is currently $117 Brent. It’s got nothing to do with the cost of world production. It’s got nothing to do with the actually the affordability of oil around the world. It’s got everything to do with speculation and geopolitics. Before you index the domestic gas price to the world oil price domestically and this up-swirl that Mr. Gerard refers to, which is why you want to export in the first place, I said we are for exports. But we should be very careful that we don’t do what is called Dutch Disease. Economic theory brings back the highest price back to your domestic sector with unintended consequences. Be careful of unintended consequences. Have the production. Have the exploration. Gas prices should rise from where they are today. They putting in-locking in wells because the gas price is too low. There should be a return for everyone here. A return for the people who have taken the risk. A return for society. Let’s use some of this bounty and transition to a low carbon economy, as Senator Franken talked about. We’re for an all-of-the-above energy strategy. Let’s use natural gas as a transition for our economy first. Let’s let that up swirl occur as a reasonable return for everyone and for American manufacturing jobs and the American consumer. That’s a thoughtful approach to how many of these applications to approve.
Food security, national defense, and energy security, in my view, are national interests. I would imagine the national interests being at the highest hierarchy.
The ingredients of natural gas are what we call feedstocks, natural gas liquids. The bounty of shale gas is, thanks to our great oil and gas sisters and brothers, they—the bounty, the geology, is that the gas is very wet, so-called NGO rich. A God-given gift. This is very unusual. The gas fields around the world are not as rich as U.S. gas fields. Therefore there’s a new unintended consequence, which is all the ingredients for everything from laptops to smart phones to pharmaceuticals to paints and varnishes to carpets to cosmetics, all the vital ingredients, 95% of them come from fossil fuels. The best and lightest fossil fuel is natural gas, so natural gas liquids should not be shipped overseas and be burnt in Japanese cooking ovens. It should be kept home so we can add value at 8 times by building these facilities. There’s $4 billion in Louisiana and Texas alone by Dow Chemical, $20 billion by Sasol, $15 billion by Shell to value-add. This is a big bet that we’re going to get responsible supply.
Energy is the lifeblood of an economy in all of its forms.
We’re in the 4th or 5th year of trying to understand what this bounty is. Can we produce it responsibly across the country? There are regions that differ already. We know that. The geology is different. We don’t know how much supply we have. Let’s be careful testing our country on when a market gets to maturity on liquidity risk. Why should we take the liquidity risk as a country in a totality while someone overseas benefits from our bounty.
Senator ALEXANDER. An image I have is the United States going into Iraq because of oil and because Iraq had gone into Kuwait and there we are. So while I’m a big free market, free enterprise person, I also see the value of the domestic price. I don’t want to lose that. I also see the national security consequences of this.
Senator MANCHIN. … look at all of the human sacrifices this country has made because of our lack of independence on energy? It’s a tremendous price we’ve paid in human life and value.
LEE FULLER, VP OF GOVERNMENT RELATIONS, INDEPENDENT PETROLEUM ASSOCIATION OF AMERICA. Projections suggest that identified resources could provide enough natural gas to meet America’s needs based on current demand for as much as 100 years.
IPAA represents thousands of independent oil and natural gas explorers and producers, as well as the service and supply industries that support their efforts, which will be significantly affected by federal action. Independent producers develop 95 percent of American oil and natural gas wells, produce 54 percent of American oil and produce 85 percent of American natural gas.
Projections suggest that identified resources could provide enough natural gas to meet America’s needs based on current demand for as much as 100 years.
STATEMENT OF THE WILDERNESS SOCIETY, DAVID ALBERSWERTH, Senior Policy Advisor
[This is very interesting. Hardly a session related to energy or natural resources goes by without numerous appeals of oil and gas companies asking to be allowed to “DRILL BABY DRILL” on restricted land].
The oil and gas industry and their allies continue to insist that the only way to address our country’s energy challenges is to open more public lands and waters to oil and natural gas drilling, and reduce environmental and safety standards. In truth, oil and gas drilling in America is already occurring at an astonishing pace and in a bewildering number of places. Yet, in the Rocky Mountain West vast expanses of public lands open to drilling and under lease by the industry are not being used, and thousands of drilling permits issued to companies by the Bureau of Land Management (BLM) are sitting idle. More oil and gas drilling occurs in America every year than anywhere else in the world. As of January 13, there were 1,764 rotary drilling rigs operating on U.S. lands and waters.1
America ranks #2 in world natural gas production, and #3 in oil production. The U.S. is the second largest natural gas producer in the world2 and the third- largest producer of oil.3 Tens of thousands of wells are drilled every year in the U.S. At the beginning of the last decade 27,000 oil and gas wells were drilled in the U.S. in one year. But in 2010 over 40,000 new wells were drilled on American lands and waters.4
The West’s public lands are already extensively drilled, leased, and available for leasing. There are tens of thousands of oil and natural gas wells on public lands, with thousands more currently approved for drilling and tens of thousands more planned for the future.5 Tens of millions of acres of federal public lands are available for leasing under current BLM Resource Management Plans. Tens of millions of acres of onshore and offshore federal lands are already under lease to oil and gas companies—the vast majority of it unused. According to BLM data, as of the end of FY 2012, 37,792,212 acres of federal public lands are leased for oil and gas development, an area larger than the State of Florida.6 However, only one third of these leases— 12,512,974 acres— are in production.
In addition, over 34 million acres of offshore federal lands are under lease in the Gulf of Mexico alone, where roughly 4,000 platforms produce oil and/or gas.7
The United States has become a net exporter of refined petroleum products. In 2011, the United States exported more petroleum products, such as gasoline and diesel fuel, than it imported for the first time in decades. The trend has continued into 2012 as the U.S. was exporting about 1,000 Mbbl/d in May 2012, according to the United States Energy Information Agency.8
The oil and gas industry is sitting on nearly 7,000 approved but idle federal drilling permits. Though the industry and their political allies persistently complain about ‘‘restrictive’’ government policies that allegedly are thwarting U.S. oil and gas development, the BLM reported in February, 2013, that 6,990 approved onshore federal drilling permits were sitting idle, unused by oil and gas operators who have obtained them9. The industry has ‘‘shut in’’ thousands of gas wells on western public lands during the past four years, but continues to complain about their alleged ‘‘lack of access’’ to federal lands for drilling. For example, according to the Wyoming Oil & Gas Conservation Commission, as of 2009, there were over 12,500 shut-in coal bed methane wells in the Powder River Basin of Wyoming alone!
Thousands more natural gas wells have been shut-in elsewhere in Wyoming and the West, primarily due to low natural gas prices. Low natural gas prices—not government policies or regulations—are causing many companies to reduce spending on natural gas projects on federal lands, a strategy intended to drive up prices. For example, the CEO of Ultra Petroleum, a large independent producer with major investments in gas wells on federal lands in Wyoming, recently told his investors of the company’s strategy to curtail exploration activities because, ‘‘We don’t believe in cash flow growth or production growth without economic returns.’’11
Moreover, ‘‘Industry-wide, you’re just beginning to see natural gas production roll over. Once it begins, it will accelerate, and I think we are looking at a 2-year window of monthly reductions in domestic natural gas supply. So it’s taken us and the industry some time to react to the market signals, but we have and we won’t be quick to over-invest in the coming years. We’ve seen natural gas prices respond positively, but they are a long, long way away from levels that will attract capital.’’ In other words, natural gas producers will increasingly be curtailing their drilling activities, in a strategy designed to raise consumer prices.
At least one witness during the February 12 hearing implied that federal land management polices are somehow inhibiting the oil and gas industry’s ability to gain access to federal onshore lands for oil and gas development. The relevant facts, however, portray a completely different reality with regard to this question: tens of millions of acres of onshore federal lands are currently available for oil and gas development; tens of millions of acres of federal lands are under lease to oil and gas companies; nearly 7,000 federal drilling permits have been issued to companies but are not being utilized by them; and over ninety-two thousand oil and gas wells are operating on federal onshore lands, with thousands of new wells permitted by the Bureau of Land Management every year. In conclusion and as the accompanying documents demonstrate, the oil and gas industry has available to it tens of millions of acres of onshore federal lands. The real issue that Congress should contemplate is not whether federal policies are unnecessarily inhibiting the extraction of oil and gas resources from our federal lands, but instead whether there are sufficient safeguards in place to assure that (1) the most environmentally sensitive public lands are protected from the adverse impacts of oil and gas development, and (2) that oil and gas extraction and development activities on federal lands are done in an environmentally safe manner.
1 http://investor.shareholder.com/bhi/riglcounts/rclindex.cfm 2Data as of 2010 (most recent available). United States Energy Information Agency http:// www.eia.gov/cfapps/ipdbproject/IEDIndex3.cfm?tid=3&pid=26&aid=1# 3United States Energy Information Agency. http://www.eia.gov/cfapps/ipdbproject/ IEDIndex3.cfm?tid
5&pid=53&aid=1 4United States Energy Information Agency. http://www.eia.doe.gov/emeu/mer/pdf/pages/ sec5l4.pdf
5 As of December 1, 2008, there were 88,357 oil and gas wells on BLM lands. Government Accountability Office. http://www.gao.gov/new.items/d10245.pdf
6 Bureau of Land Management, http://www.blm.gov/wo/st/en/prog/energy/oillandlgas/statistics.html 7 BOEMRE, Gulf of Mexico Region Blocks and Active Leases by planning Area, January 3, 2011; EIA, Overview of U.S. Legislation and Regulations Affecting Offshore Oil and Natural Gas Activity, p. 2, September, 2005.
8 United States Energy Information Agency, http://www.eia.gov/dnav/pet/ petlmovelwklyldcllNUS-Z00lmbblpdll.htm
9 Correspondence from Celia Boddington, BLM, to David Alberswerth, TWS, February12, 2012.
10 http://www.uwyo.edu/eori/lfiles/co2conference10/tom%20doll%20eoril30june2010l2009- 2010.pdf 11http://phx.corporate-ir.net/phoenix.zhtml?c=62256&p=irol-irhome
JOHN W. HICKENLOOPER, GOVERNOR OF COLORADO, DENVER, CO.
Energy independence used to be a catch phrase that people would throw around, but I think we are legitimately on the threshold of achieving it for the first time in my lifetime… what we’ve seen in the last decade is truly transformational.
The Persian Gulf is more volatile than ever, and we see our national security—40 years after our first energy crisis, the oil is controlled by unfriendly regimes in many cases. A national security issue that remains.
3 issues: the economic recovery, the national security, and climate are tough challenges, but the crux of each of them is energy. In 2005, 60% of our oil was imported. Last year, 41% was imported. That trend is going to go further. We see that having cheaper natural gas means that we’re more competitive as a country.
We see that chemical industries, the American fertilizer industries, a lot of these associated industries beginning to really take off. Foreign investment in electricity-intensive industries also is coming home for the first time in decades largely because of inexpensive natural gas. It’s also worth pointing out that carbon emissions, because of inexpensive natural gas and the conversion of older, inefficient electrical generation plants fueled by coal, are per capita—CO2 emissions are the lowest since Eisenhower turned over the White House to John Kennedy. We are, as a country,—even though we didn’t ratify the Kyoto Protocols—we are half way toward compliance, and we have reduced our carbon emissions in the United States more than all that other signatories to the Kyoto Protocols.
It really is game-changing. When I was a geologist this was unheard of. We’d find a big field, and we’d think, well, we’re going to adjust how the value of coal— the value of oil, or the value of gas was going to be projected. This has been a technological revolution. We did fracking when I was a geologist. The first well I sat back in 1981 was a—we did a hydraulic fracking enterprise on that. What’s happened is we’ve had better technology, the discovery of massive—these tight shale and shale oil deposits. The real transformation here is that we could see a natural gas supply that is legitimately a hundred years long, and we continue as the technology continues to improve, we find more gas at lower cost.
We are on target to be a net exporter of natural gas by 2020. Domestic development of shale gas and oil, homegrown renewable energy and efficiency strategies are leading us toward energy independence. With less reliance on foreign sources, our exposure to the impacts of global events is reduced. Our oil imports are falling—to approximately 40 percent of our consumption, down from 60 percent as recently as 2006. By next year, imported oil is projected to make up just 32 percent of demand. More energy dollars will stay home, our dependence on foreign supplies will decrease.
We rank fifth in natural gas production and tenth in oil production. Our diverse hydrocarbon resources encompass a variety of shale, tight sand, coal bed methane, and other formations that span the state. This landscape has changed over the years, and has taken a significant turn as operators combine improvements in hydraulic fracturing and horizontal drilling to unlock reserves of oil and gas in formations, such as the Niobrara in Colorado, historically considered impractical for extraction.
As a former geologist, I have some experience with this technology. We worked on so-called ‘‘frack jobs’’ when I was in the industry in the 1980s. The industry, incidentally funded by billions of federal research dollars in the 1990’s, has made great advances since that time.
Natural gas and renewable sources are proving to be ideal partners, since gas efficiently cycles on and off to pair with intermittent resources such as wind and solar power. We are achieving these energy goals across party lines. Gov. Mary Fallin of Oklahoma and I are leading a bipartisan effort to promote the use of natural gas as a transportation fuel for state vehicles. What started with Oklahoma and Colorado a little over a year ago has now expanded to 22 states representing every region of the country. With a little effort we see the potential for including the federal government and perhaps Canadian provinces and other partners to build a market for large vehicle fleets using natural gas. These initiatives target larger and heavy duty vehicles. Converting from diesel power to compressed natural gas reaps the biggest benefit in reductions of carbon, particulates and other pollutants. We are also finding ways to expand the fueling infrastructure, so trash haulers, delivery vehicles, buses, and trucks have more options for refueling.
ASPO 2005: The day kicked off with an address from the Mayor of Denver, John Hickenlooper, who has joined that brave but small band of honest and courageous politicians willing to go anywhere near the issue of peak oil. Indeed his office is a co-organizer of the conference. Under his leadership, Denver is studying city oil use and what would happen at varying levels of oil price – how would the city adapt. A big focus on integrated transport and land-use planning. The Denver area has a very large transit system just approved by voters. The FasTracks system will involve 57 new stations and 50 of them are close to brownfield sites that can be redeveloped with high density zonings to allow 5-8 story buildings that have mixed use residential and commercial buildings. Denver has reduced the vehicle fleet 7% – and the city uses hybrids and biodiesel. Denver International Airport uses 100% alternative fuels. The mayor is trying to promote telecommuting to area businesses – even 10-20% of the week in telecommuting would makes a big difference to congestion and fuel usage. He is trying to look at whether real-estate agents could be persuaded to launch a TV campaign to promote people moving closer to work (on the theory that the real estate agents would have a lot to gain in getting everyone to shuffle around and be closer to work). Denver Mayor Hickenlooper said that it made sense to help the poor with their gas and electric bills in the dead of winter to get them through the coldest months, but to do that forever in the future as the permanent energy crisis hits would bankrupt the city, it can’t be done. And how was he going to keep the snowplows running, collect the garbage, etc? He’ll be meeting with the mayors of Oakland, Chicago, Seattle, Portland, Austin to discuss and share ideas on how to cope with declining energy in cities, and they’ll present their findings at the national conference of mayors.
REFERENCES FOR: FRANCES BEINECKE, PRESIDENT, NATURAL RESOURCES DEFENSE COUNCIL, NEW YORK, NY
(4) Fracking Hazards Obscured in Failure to Disclose Wells, Bloomberg, Benjamin Haas (Aug. 14, 2012), http://www.bloomberg.com/news/2012-08-14/fracking-hazards-obscured-in-failure-to- disclose-wells.html
11 Institute of Medicine. 2012. Workshop on the Health Impact Assessment of New Energy sources: Shale Gas Extraction. April 30-May 1, 2012. Washington, DC. http://www.iom.edu/Activities/Environment/Environmental HealthRT/2012-APR-30aspx.
12 Masten, S. 2012. HHS & NIEHS Activities Related to Hydraulic Fracturing and Natural Gas Extraction. Presentation made at the 2012 Shale Gas Extraction Summit: October 2, 2012. http://environmentalhealthcollaborative.org/images/ScottPlenary.pdf; ATSDR, Health Consultation: Public Health Implications of Ambient air Exposures to Volatile Organic Compounds as Measured in Rural, Urban, and Oil & Gas Development Areas Garfield County Colorado (2008); United States Environmental Protection Agency (US EPA). 2012. EPA’s Study of Hydraulic Fracturing and Its Potential Impact on Drinking Water Resources. http://www.epa.gov/hfstudy/ .
13 Occupational Safety Health Administration (OSHA) 2012. Hazard Alert, Worker Exposure to Silica During Hydraulic Fracturing. www.osha.gov/dts/hazardalerts/hydrauliclfraclhazardlalert.html;
14 Pediatric Environmental Health Specialty Units and the American Academy of Pediatrics. 2011. PEHSU Information on Natural Gas Extraction and Hydraulic Fracturing for Health Professionals. http://aoec.org/pehsu/documents/hydrauliclfracturinglandlchildrenl2011lhealthlprof.pdf;
15 ATSDR, Health Consultation: Public Health Implications of Ambient Air Exposures to Volatile Organic Compounds as Measured in Rural, Urban, and Oil & Gas Development Areas Garfield County Colorado (2008)
16 Osborn, SG, A Vengosh, NR Warner, RB Jackson. 2011. Methane contamination of drinking water accompanying gas-well drilling and hydraulic fracturing. Proceedings of the National Academy of Sciences, U.S.A. 108:8172-8176. http://www.biology.duke.edu/jackson/pnas2011.pdf.
17 See, e.g., USEPA 2011. Draft Investigation of Ground Contamination near Pavillion, Wyoming. EPA 600/R-00/000 18Bamberger M, Oswald RE. Impacts of gas drilling on human and animal health. New Solut. 2012;22(1):51–77.
19 McKenzie Witter RZ, Newman LS, Adgate JL. 2012. Human Health Risk Assessment of air Emissions from Development of Unconventional Natural Gas Resources. Sci Total Environ. 2012 May 1;424:79-87. 20 Esswein E et al 2012. NIOSH Field Effort to Assess Chemical Exposures in Oil and Gas Workers: Health Hazards in Hydraulic Fracturing. Presentation made at IOM Roundtable: The Health Impact Assessment of New Energy Sources: Shale Gas Extraction. April 30-May 1, 2012
21 Petron G, et al. 2012. Hydrocarbon emissions characterization in the Colorado Front Range: A pilot study. Journal of Geophysical Research, VOL. 117.
22 Gilman JB, Lerner BM, Kister WC, de Gouw J, 2013. Source signature of volatile organic compounds (VOCs) from oil and natural gas operations in northeastern Colorado. Environ Sci Technology DOI: 10. 1021/es304119a
23 Litovitz A, et al. 2013. Estimation of regional air-quality damages from Marcellus Shale natural gas extraction in Pennsylvania. Environ. Res. Lett. 8.
24 Olaguer E 2012. The potential near-source ozone impacts of upstream oil and gas industry emissions. Journal of Air and Waste Management. 62:8, 966–977
25McKenzie Witter RZ, Newman LS, Adgate LS, Adgate JL. 2012. Human Health Risk Assessment of air Emissions from Development of Unconventional Natural Gas Resources. Sci Total Environ. 2012 May 1;424:79–87.
27 NRDC, Leaking Profits: The U.S. Oil and Gas Industry Can Reduce Pollution, Conserve Resources, and Make Money by Preventing Methane Waste (Mar. 2012), available at http:// www.nrdc.org/energy/leaking-profits.asp.
28 EPA, Inventory of U.S. Greenhouse Gas Emissions and Sinks: 1990–2010, Table ES-2, http:/ www.epa.gov/climatechange/Downloads/ghgemissions/US-GHG-Inventory-2012-Main-Text.pdf, 29EPA, Greenhouse Gas Reporting Program, 2011 Data, http://epa.gov.ghgreporting/ghgdata/ reported/index.html
30 U.S. Energy Information Administration, Natural Gas Gross Withdrawals and Production, 2010 data. available at http://www.eia.gov/dnav/ng/nglprodlsumldculNUSla.htm; U.S. Environmental Protection Agency, Inventory of U.S. Greenhouse Gas Emissions and Sinks (1990- 2009) (Apr. 15, 2012). Net emissions of methane are just over 600 bcf (billions of standard cubic feet), while gross withdrawals were approximately 26,800 bcf; this implies a net leakage of approximately 2.3 percent.
31 Robert Howarth et al., ‘‘Methane Emissions from Natural Gas Systems,’’ Background Paper Prepared for the National Climate Assessment (reference number 2011-0003) (Feb. 25, 2012), available at http://www.eeb.cornell.edu/howarth/Howarth%20et%20al.%20– %20National%20Climate%20Assessment.pdf.
32 NRDC, Leaking Profits: The U.S. Oil and Gas Industry Can Reduce Pollution, Conserve Resources, and Make Money by Preventing Methane Waste (Mar. 2012), available at http:// www.nrdc.org/energy/leaking-profits.asp.
34 Hydraulic Fracturing Can Potentially Contaminate Drinking Water sources, NRDC, http:// www.nrdc.org/water/files/fracking-drinking-water-fs.pdf.
35 Soeder, D.J., and Kappel, W.M., 2009, Water Resources and Natural Gas Production fromt he Marcellus Shale: U.S. Geological Survey Fact Sheet 2009-3032, 6 p., available at: http:// pubs.usgs.gov/fs/2009/3032/.
36 See, e.g., DEP Investigating Lycoming County Fracking Fluid Spill at XTO Energy Marcellus Well, http://www.portal.state.pa.us/portal/server.pt/community/newsroom/ 14287?id=15315&typeid=1.
37 U.S. Government Accountability Office, Energy-Water Nexus: Information on the Quantity, Quality, and Management of Water Produced during Oil and Gas Production, GAO-12-156 (Washington, D.C.: Jan 9, 2012).
38 Otton, J.K., 2006, Environmental aspects of produced-water salt releases in onshore and estuarine petroleum-producing areas of the United States: a bibliography: U.S. Geological Survey Open-File report 2006-1154, 223p.
39 NRDC, ‘‘Petition for Rulemaking Pursuant to Section 6974(a) of the Resource Conservation and Recovery Act Concerning the Regulation of Wastes Associated with the Exploration, Development, or Production of Crude Oil or Natural Gas or Geothermal Energy,’’ September 8, 2010, 18–23.
40 See, e.g., DEP Fines Atlas Resources for Drilling Wastewater Spill in Washington County, http://www.portal.state.pa.us/portal/server.pt/community/newsroom/14287?id=13595&typeid=1 41Ohio EPA investigating dumping of drilling waste water in Youngstown area, Feb. 4, 2013, Bob Downing, Beacon Journal, http://www.ohio.com/news/ohio-epa-investigating-dumping-of- drilling-waste-water-in-youngstown-area-1.370584 42http://www.denverpost.com/breakingnews/cil18880544 E. Impacts on Wildlife Habitat and Sensitive Lands

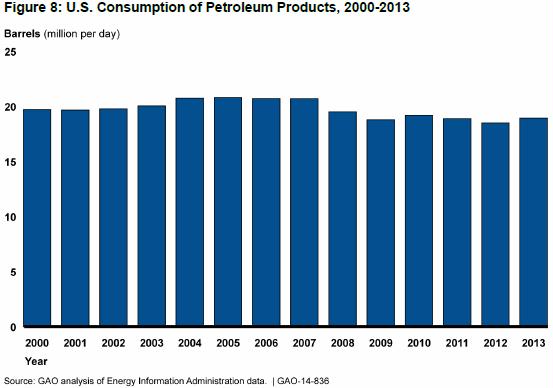
![Figure 1. EROI estimates from three sources, Gagnon et al. [7], Cleveland [8] and Guilford et al. [9]. The Gagnon et al. [7] data represent estimates of the EROI for global oil and gas production using aggregation by Divisia indices. The Cleveland [8] data represent the trend in EROI values for US oil and gas production calculated using the Divisia indices to aggregate energy units. The Guilford et al. [9] data represent estimates of the EROI of US oil production from 1919 to 2007](https://energyskeptic.com/wp-content/uploads/2015/06/murphy-2013-figure-1-EROI-decline-global-oil-prd.jpg)
![Figure 2. Relationship between oil prices and EROI. (Adapted from Murphy & Hall [3].)](https://energyskeptic.com/wp-content/uploads/2015/06/murphy-2013-figure-2-relationship-between-oil-prices-and-EROI.jpg)
![Figure 3. Oil price as a function of EROI. The lines on the figure correspond to various rates of monetary return on investment (MROI). (Adapted from King & Hall [13].)](https://energyskeptic.com/wp-content/uploads/2015/06/murphy-2013-figure-3-oil-price-as-a-function-of-EROI.jpg)
![Figure 4. The 'net energy cliff' graph, showing the relation between net energy and EROI. As EROI declines, the net energy as a percentage of total energy extracted declines exponentially. Note that the x-axis is in reverse order. (Adapted from Mearns [53].)](https://energyskeptic.com/wp-content/uploads/2015/06/murphy-2013-figure-4-Net-Energy-Cliff.jpg)
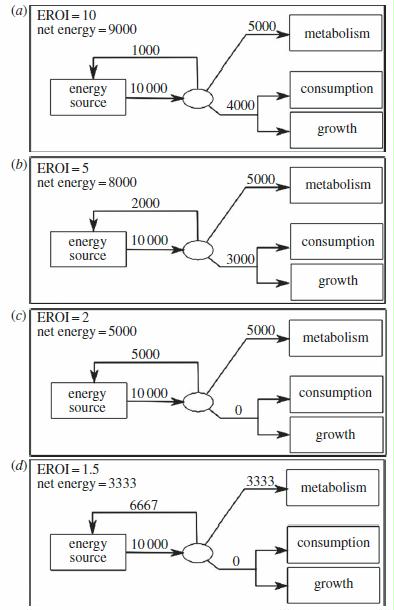
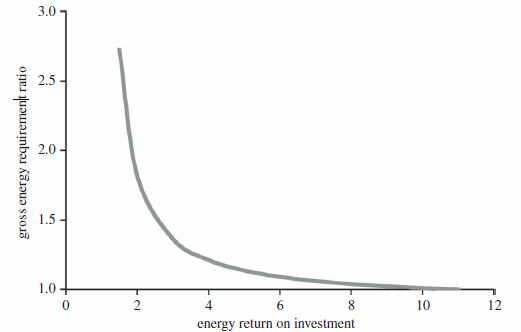
![Figure 10. GDP as a function of energy consumption over the past 200 years. (Adapted from Kremmer [69] and Smil [70].)](https://energyskeptic.com/wp-content/uploads/2015/06/murphy-2013-figure10-GDP-as-a-function-of-energy-consumption-1820-2000.jpg)