
The $2.2 billion dollar Ivanpah Solar power plant generates 100 MW of power when you take the 25% capacity into account (not 400 MW). That’s enough power for 25,000 to 50,000 homes (not 140,000 as claimed). There are 116,700,000 households in the USA (2010 census). So we’d need 2,334 to 4,668 more $2.2 billion Ivanpahs for residential power alone. That would cost $5 to $10 trillion dollars. At the very bottom I’ve added a description of how Ivanpah works.
Huge US solar plant lags in early production
Nov 17, 2014 by Michael R. Blood at phys.org
The largest solar power plant of its type in the world—once promoted as a turning point in green energy—isn’t producing as much energy as planned.
The plant is producing about half of its expected annual output for 2014, according to calculations by the California Energy Commission. Ivanpah sprawls over 5 miles of desert near the California-Nevada border.
How Efficient will the Ivanpah Solar Power Tower Really Be? Reliability and Efficiency
by BasinAndRangeWatch.org
The $2.2 billion dollar Ivanpah Solar Electric Generating System (ISEGS) generates 400 megawatts (MW) of electricity during the sunniest part of the day, and uses natural gas to generate up to five percent of its capacity. Without energy storage, the annual capacity factor of any solar technology is generally limited to about 25 percent of maximum according to the Renewable Energy Research Laboratory. ISEGS will not use storage technology.
Cost
Solar technologies in general remain too costly for grid-connected applications without heavy government subsidies (from Department of Energy).
A Combined Cycle Gas Turbine power plant today costs roughly $1,100/kW – $1,500/kW to build, one of the cheapest power plant options. The price of natural gas electricity costs 3.9 to 4.4 cents/kWh, according to Pure Energy Systems Wiki. The market cost for coal is around 2-3 cents/kwh. The levelized cost of coal is around 4-5.8 cents/kwh. Nuclear generation costs 11.1 to 14.5 cents/kWh.
Parabolic trough solar thermal costs for electricity run from 15 to 18 cents/kWh.
Costs for solar thermal plants: the Nevada One plant completed in 2007 was built for roughly $3,600/kW of capacity. (Source http://www.energybulletin.net/49878)
Add in the Transmission Costs
For remote solar plants like the Ivanpah project, built hundreds of miles from cities, the cost of upgrading and building new power lines needs to be factored in.
The costs of single-circuit alternating current transmission lines for 1989: for a 230 kilovolt line – $150,000 to 375,000 per mile, for a 500 kV line – $400,000 to 800,000 per mile. (Source: Electric Power Research Institute, Technical Assessment Guide: Electric Supply, 1989, Vol. 1, Revision 6, Golden, CO, November 1989, p. B-4)
This cost is passed onto ratepayers, a Southern California Edison representative told us. The Eldorado-Ivanpah Transmission line upgrade alone would make the rates of SCE go up about 5 to 10 cents per power bill per customer. Each additional project that would require an upgrade would also add to the power bills.
We disagree with the statement, “[ISEGS] would not create significant adverse effects on fossil fuel energy supplies or resources, would not require additional sources of energy supply, and would not consume fossil fuel energy in a wasteful or inefficient manner” (page 7.2-1). Fossil fuel would have to be burned elsewhere on the grid as baseload, mostly as coal, as solar energy is intermittent. The Ivanpah solar plant will not run during the night, during cloudy days, and on cold winter mornings the small on-site natural gas burners will have to run to heat the system up.
Efficiency in a power plant is a measure of the how much electricity is generated from a unit of energy put into the system (such as coal, natural gas, or photons). In a thermal power plant water is boiled to produce steam, the heat-energy of which is used to turn turbines. But much heat is lost in the process. Some typical efficiency values (From: Eike Roth, Why thermal power plants have a relatively low efficiency, www.sealnet.org; and Romero-Alvarez and Zarza 2007).
Coal – 45-48% efficiency, Natural gas – 58%, Nuclear – 35%, Hydro – 85%
Solar thermal – Central receiver (like ISEGS design): 12% annual net, 16% peak
Solar thermal – Parabolic trough: 14% annual net, 21.5% peak
Photovoltaic silicon – 15%
Trying to figure an efficiency calculation to use to compare the Ivanpah solar project future efficiency, CEC uses a proxy from existing natural gas power plants. They say, “As a proxy, we will use an average efficiency based on several recent baseload combined cycle power plant projects in the Energy Commission siting process. Baseload combined cycles were chosen because their intended dispatch most nearly mirrors the intended dispatch of solar plants, that is, operate at full load in a position high on the dispatch authority’s loading order” (page 7.2-15). The average of four natural gas combined cycle 565-696 MW power plants: 53.7% LHV (Lower Heating Value*). This does not seem to compare well with real-world measured efficiencies at existing central receiver solar thermal projects (above), but CEC ignores real-world numbers.
Using this proxy, CEC concludes that the Land Use Efficiency for ISEGS would be 238 MWh/acre-year (solar only, subtracting the natural gas burned for morning warm-up and cloud cover).
But why is CEC comparing ISEGS to a baseload plant, which is supposed to produce energy at a constant rate? Examples of baseload plants include nuclear and coal-fired plants. Baseload plants typically run at all times of the year, and all night. Clouds do not turn them off. They also have dispatchability, able to ramp up or down to generate power any time. Peaks or spikes in customer power demand are handled by smaller and more responsive types of power plants called peaking power plants. Peaking plants are typically powered with natural gas turbines. Baseload power plants do not change production to match power consumption demands since it is more economical to operate them at constant production levels. Natural gas is used in base load, intermediate cycle, and peaking units. In California, more than three-quarters of natural gas generation comes from combined cycle gas turbines (CCGT) operated as baseload and intermediate cycle units.
Solar thermal power is not dispatchable.
A load-following power plant gradually ramps up and down its power output to respond to scheduled changes in power demand over the course of a day. Gas, pulverized coal, and hydroelectric generators are commonly used to follow the load. “Solar photovoltaic or CSP [concentrated solar thermal, like ISEGS] without storage can approximately follow the load on sunny days, when peak demand is around mid-day” (From Solar Southwest Initiative).
The ISEGS solar thermal power plants should be compared to a load-following plant, not baseload. But not being dispatchable on command, it compares poorly. We have witnessed the summer monsoon season in Ivanpah Valley shade much of the area with tall thunderheads every afternoon for weeks.
Baseload vs. Peak. Based on reports filed by the nation’s utilities with the Federal Energy Regulatory Commission, about 75% of electricity consumption is baseload and about 25% is intermediate or peak load. Demand is full-time, but wind and solar are part-time. In the absence of electricity storage, there is no such thing as wind/solar by itself — there is only 30% wind/solar combined with 70% natural gas, or 30% wind/solar combined with 70% coal.
Real World Capacity. Utility-scale renewable energy companies like to say how many thousands of houses their power plants will supply, and the newspapers slavishly print these numbers. But they neglect to tell us about capacity factors. The stated wattage, or ‘nameplate capacity,’ is when the sun is shining full-on on a cloudless day. It does not take into account night, short winter days with low sun angle, cloudy and rain days, windy days when the facility will be shuttered, or maintenance (if not done at night). Every generating plant has a capacity factor (the net capacity factor of a power plant is the ratio of the actual output of a power plant over a period of time and its output if it had operated at full nameplate capacity the entire time).
Typical capacity factors:
- Thermal solar “Without energy storage, the annual capacity factor of any solar technology is generally limited to about 25 percent” – Sandia National Laboratories.
- Thermal solar power tower 25%– Abengoa Solar’s large power tower PS10 in Spain, from their brochure pdf.
- Thermal solar parabolic trough ca. 15% average (from Solar Millennium Andasol 1-3 parabolic trough plants in Spain, access date = 2009-05-14). They reported 28% capacity only in peak times.
- Photovoltaic solar in Massachusetts 12-15% (from Renewable Energy Research Laboratory: “Wind Power: Capacity Factor, Intermittency, and what happens when the wind doesn’t blow?”>>PDF). Arizona 19% (from Carnegie Mellon Electricity Industry Center Working Paper CEIC-08-04, The Spectrum of Power from Utility-Scale Wind Farms and Solar Photovoltaic Arrays, by Jay Apt and Aimee Curtright).
- Nuclear 60% to over 100%, U.S. average 92%. Worldwide average varied between about 81% to 87% between 1995 and 2005 (from Renewable Energy Research Laboratory cited above; “15 Years of Progress” PDF, World Association of Nuclear Operators, 2006, Retrieved 2008-10-20.).
- Baseload coal 70-90% (from Renewable Energy Research Laboratory cited above).
- Combined cycle natural gas about 60% (from Renewable Energy Research Laboratory cited above). “Load-following” natural gas plants are turned on only when needed during the higher-demand parts of the day and year, so may have a capacity factor of 42%. When demand for power drops to minimum levels, they are turned off because Baseload power plants designed to run all the time, are already running all the time to provide this minimum demand. Most baseload power plants are coal or nuclear plants.
- Geothermal worldwide average 73%, demonstrated 90% (from Fridleifsson, Ingvar B.; Bertani, Ruggero; Huenges, Ernst; Lund, John W.; Ragnarsson, Arni; Rybach, Ladislaus (2008-02-11). O. Hohmeyer and T. Trittin. ed (pdf). The possible role and contribution of geothermal energy to the mitigation of climate change. Luebeck, Germany. pp. 59-80. Retrieved 2009-04-06).
Concentrating solar power needs a sharp sun image to be efficient. It is best done in deserts where there are no clouds or haze. Dust haze scatters light, and image efficiency plummets. Windstorms blow dust off Ivanpah playa frequently, and could lower efficiency for ISEGS. Cloud cover will force the plant to be turned off during winter and summer storms.
Will high winds whipping through the desert rip 20-foot wide heliostats off their bases like sails?
But what surprises us most is the location of the proposal directly below a large rain catchment basin on the slopes of Clark Mountain. Did the engineers in the city understand desert alluvial deposition processes, or surficial geology and hydrology?
Researchers measured “normal” rain runoff on a fan below the Providence Mountains, just 60 km south of Ivanpah Valley in Mojave National Preserve, from 2003 to 2006. They found that several winter and summer rainstorms delivered more than 10 mm per day of rain, enough to initiate runoff, and some intense summer storms were greater than 60 mm per hour. These redistributed sand, gravel, and organic debris. High-intensity summer rainfall could last an hour, often exceeding the infiltration rates of the soil (Miller et al. 2009).
This was just over three years. Over the 50-year proposed lifespan of the ISEGS larger storms will occur, possibly as damaging as the flood that hit Furnace Creek in Death Valley National Park, and Surprise Canyon in the Panamint Mountains, California.
This is an active sloping alluvial fan, not a stable flatland, seemingly not appropriate for a delicate heliostat array. In describing the engineering of a collector field, Romero-Alvarez and Zarza (2007:21-53) state: “Because of the large area of land required, complex algorithms are used to optimize the annual energy produced by unit of land, and heliostats mst be packed as close as possible so the receiver can be small and concentration high. However, the heliostats are individual tracking reflective Fresnel segments subject to complex performance factors, which must be optimized over the hours of daylight in the year, by minimizing the cosine effect, shadowing and blocking, and receiver [light] spillage.”
Tracking control mechanisms continuously move the heliostats so that they focus solar radiation on the tower receiver. “During cloud passages and transients the control system must defocus the field and react to prevent damage to the receiver and tower structure” (ibid: 21-52).
What if sediments from alluvial runoff tilt several heliostats in the field? Will operators be able to find and correct all heliostat deviations? How long will the plant be shut off while inspections are done after each storm and repairs are made? How much of a tilt would cause tower damage as reflected sun beams are aimed in the wrong direction?
An exacting science: Hot sunbeams reflected by heliostats onto the central receiver tower, solar influx on the receiver can get to 1000 degrees Celsius (ibid:21-51).
In an investment cost breakdown of building a central receiver solar thermal power plant the heliostat field is the single most expensive part of the project, 40% of total capital costs. The power block comes next, at 32% of total (ibid:21-53).
Yet, “Staff believes there are no special concerns with power plant functional reliability due to flooding (page 7.3-6).
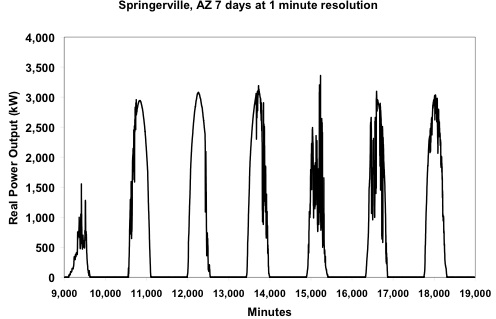
Intermittent power: Real power output (kW) sampled with one minute resolution for a 4.6 MW solar photovoltaic array in northeastern Arizona for one week (from Carnegie Mellon Electricity Industry Center Working Paper CEIC-08-04, The Spectrum of Power from Utility-Scale Wind Farms and Solar Photovoltaic Arrays, by Jay Apt and Aimee Curtright).
REFERENCES:
Miller, David M., et al. 2009. Mapping Mojave Desert ecosystem properties with surficial geology. In, The Mojave Desert: Ecosystem Processes and Sustainability. Edited by Robert H. Webb, Lynn F. Fenstermaker, Jill S. Heaton, Debra L. Hughson, Eric V. McDonald, and David M. Miller. University of Nevada Press: Reno and Las Vegas.
Romero-Alvarez, Manuel and Eduardo Zarza. 2007. Concentrating Solar Thermal Power. In, Frank Kreith and D. Yogi Goswami (eds.), Handbook of Energy Efficiency and Renewable Energy. CRC Press: Boca Raton, London, New York.
[This is an article from power-eng.com on how Ivanpah works. I’ve shortened and reworded much of it ]
Springer, R. September 14, 2015. Large-scale solar on the Rise. Power Engineering.
Solar has about 1 percent of the power generation market in the U.S.
There are a few clouds darkening the utility-scale solar market. The darkest being the possible sun setting of federal investment tax credits (ITC) at the end of 2016.
There are two main ways to generate solar power: photovoltaic cells or concentrated solar power (CSP). CSP uses mirrors to focus solar energy to create heat, which can then power a traditional steam turbine. Photovoltaic cells use an electronic process to convert sunlight into electricity.
The Ivanpah Solar Electric Generating System uses solar thermal technology to produce energy by:
- More than 300,000 computer-controlled mirrors track the sun and reflect it towards boilers that sit atop immense towers.
- Steam is created when the concentrated light hits the boilers.
- The steam is piped to a turbine where it creates electricity.
Ivanpah started up on January 1, 2014, with 3 units having a total generating capacity of 377 MW. Units 1 and 3 provide power for Pacific Gas & Electric while unit 2 sends electricity to Southern California Edison. The plant is in California’s Mojave Desert, 45 minutes southwest of Las Vegas. About 65 full-time operations and maintenance employees work at the plant.
The plant reaches full load during sunny days.
| Google images of Ivanpah |
The challenge producing the most electricity during partly cloudy weather. This is technically very challenging to do, according to Samuelian, “Because you’ve got clouds moving in and out and you’ve got a steam plant with thermal inertia and the parts and pieces move around,” he says.
In the early morning, virtually all of the mirrors are aimed at the tower, but as the day goes on some go into a standby position so the tower doesn’t overheat. The process is regulated by infrared cameras.
The boiler has three sections – super heat, reheat and evaporator – and multiple mirrors heat a different section of the boiler. Large supercomputers balance the energy on the three spots and give aiming signals to each unit every 10 seconds.
The plant uses recycled water.
Another challenge is the sheer size of the plant. A coal-fired plant of similar size would have a much smaller footprint. Ivanpah’s three units cover about 3,000 acres and is about five miles end to end. “So if I’ve got someone working in the solar field on one end of the plant and I need them to go look at something else on the other end of the plant, there’s restrictions on what speed you can drive onsite, for wildlife considerations, and creating dust, and so, the speed limits like 10 miles an hour,” says Samuelian. It takes about half an hour to go from one end of the plant to the other.
Groups of solar panels (or “strings”) run in a series and in parallel until they get the maximum voltage they’re designed for, and the electricity is taken to a combiner box, which is a group of fuses and switches that take the input from the strings and combine it into a single output, according to Stojanovic. “And that typically runs back to another larger combiner box, which is typically a bunch of breakers or large fuses that take the rest of these strings and combine it into one big DC input into an inverter,” he says. The DC power needs to be converted to AC to reduce losses and because that’s what the North American grid supports.