
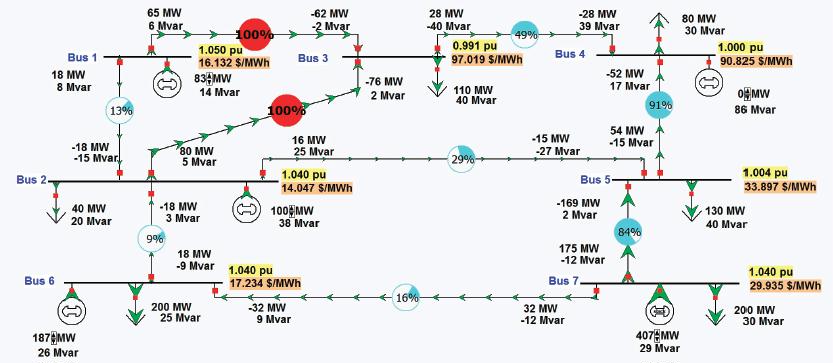
 Figure 1. OPF solution of original seven-bus system with generator at bus 4
Preface. The U.S. electric grid produced 64% of electricity in 2019 with finite fossil fuels, and another 20% from nuclear power. Since fossil fuels and uranium are finite, and biomass doesn’t scale up, the electric grid needs to evolve to 100% renewables from the 9% of renewables powering the U.S. grid today, with the majority of the new power from wind and solar, since sites for hydropower (and pumped), geothermal, utility scale batteries, and Compressed Air energy storage are limited and don’t scale up (the only utility scale battery with enough materials on earth to store just ONE day of U.S. electricity generation is Sodium Sulfur, and would cost $41 trillion and take up 945 square miles of land — calculations and citations in When Trucks Stop Running: Energy and the Future of Transportation
If supply and demand aren’t kept in exact balance, the grid can crash. So increasing penetration of wind and solar will make the grid less stable since they are unreliable, variable, and intermittent. Power engineers need to solve this increasing instability. Right now, the only solution is natural gas (and limited hydropower) to dispatch quick enough to balance wind and solar. Coal and nuclear plants can’t ramp up or down quickly enough without causing damage.
Just as difficult is to completely redesign the grid, which now is mainly a “one-way” grid where power flows from about 6,000 very large, centralized power plants outwards and existing systems can keep good track of it. As millions of home and industrial solar panels and wind turbine farms push electricity the “wrong way” increase, the potential for a blackout grows, because this power is invisible to the operators who keep supply and demand in balance.
Distribution grids around the world tend to operate in relative darkness, in terms of lacking sensors and monitors to reveal their point-to-point and moment-to-moment condition to grid operators. That will have to change as distributed energy resources take up an increasing role. Solar PV in particular can cause problems on distribution systems designed for one-way power flows by causing voltage disruptions or tripping protective equipment. Electric vehicle chargers can add significant loads to circuits not designed to handle them, as can electrifying loads that now run on fossil fuels. To manage this shift, network investments will need to increase substantially over the next decade, covering not only traditional grid reinforcement but also “smart solutions,” such as demand-side flexibility (Deign 2020).
New models, new algorithms, new mathematics, and higher-powered computers than we have now will be needed to be invented to cope with tens of millions of future rooftop solar panels, wind turbines, machinery and appliances, energy storage devices, automated distribution networks, smart metering systems, and phasor measurement units (PMUs) sending trillions of bits of data every few seconds.
This paper proposes that new institutes staffed with power and other engineers be created. Which is easier said than done. Solar panels and wind turbines may be “sexy”, but becoming a power engineer isn’t. Anyone smart enough to become a power engineer can make far more money in other fields, which is why most universities have dropped their power engineering department.
This can be seen in the coming expertise crisis — for every two electric sector employees about to retire, the industry has less than one to replace them (the nuclear power sector alone needs 90,000 trained workers and engineers soon). A lack of specialized workers to maintain and operate the infrastructure will greatly impact affordable, reliable service since new employees don’t have a lifetime of knowledge. They’re bound to make catastrophic errors, which will increase rates for consumers and blackouts (Makansi 2007, NAERC 2006).
And if a new car has hundreds of microchips, imagine how many billions would be needed for a smart grid. Yet there is an enormous shortage of engineers to design and create them. Each chip fabrication plant requires thousands of engineers to operate (Lovejoy 2022).
Renewable power needs genius engineers to also solve these issues:
- The electric grid is interdependent on other systems (transportation, water, natural gas and more). These systems also need to be modeled to make sure there is no impact on them as the grid evolves.
- As wind and solar grow, placing new unpredictable demands on the grid, better forecasting tools are needed.
- Better climate change forecasting tools are also needed since climate change will introduce several uncertainties affecting the grid. In addition to higher temperatures requiring increased air conditioning loads during peak hours, shifting rainfall patterns may affect the generation of hydroelectricity and the availability of cooling water for generating plants. The frequency of intense weather events may increase.
- Modeling and mitigation of high-impact events such as coordinated physical or cyberattack; pandemics; high-altitude electromagnetic pulses; and large-scale geomagnetic disturbances, and so on are especially difficult because few very serious cases have been experienced. Outages from such events could affect tens of millions of people for months.
This report anticipated the need to create fake data in order to hide real data from terrorists that might enable them to find weak points and how/where to attack them. Well oops, too late! The Russian attack of up to 18,000 government and private networks via SolarWind likely snagged the Black start plans of how to restore the electric grid after a cataclysmic blackout. The plans would give Russia a hit list of systems to target to keep power from being restored in an attack like the one it pulled off in Ukraine in 2015, shutting off power for six hours in the dead of winter. Moscow long ago implanted malware in the American electric grid, and the United States has done the same to Russia as a deterrent (Sanger et al 2021).
Understanding this report and the problems that need to be solved requires a power engineering degree and calculus, so I only listed a few of the most simple-to-understand problems above, and excerpted what I could understand. Some of these issues are more understandably explained in the Pacific Northwest National Laboratory paper: “The Emerging Interdependence of the Electric Power Grid and Information and Communication Technology”
The energy consumed to keep track of the data from billions of sensors and energy producing and consuming devices every few seconds in order to balance a distributed grid is likely to be too much. After all, global production of oil probably peaked in 2018, and it is the master resource that makes all others possible, including coal, uranium, wind turbines, solar panels, microchips, transportation and more. In addition, the complexity of a distributed grid is just way to difficult to manage.
Alice Friedemann www.energyskeptic.com Author of Life After Fossil Fuels: A Reality Check on Alternative Energy; When Trucks Stop Running: Energy and the Future of Transportation”, Barriers to Making Algal Biofuels, & “Crunch! Whole Grain Artisan Chips and Crackers”. Women in ecology Podcasts: WGBH, Crazy Town, Collapse Chronicles, Derrick Jensen, Practical Prepping, Kunstler 253 &278, Peak Prosperity, Index of best energyskeptic posts
***
NRC. 2016. Analytic Research Foundations for the Next-Generation Electric Grid. Washington, DC: The National Academies Press. 160 pages. Excerpts:
Summary
The electric grid is an indispensable critical infrastructure that people rely on every day.
The next-generation electric grid must be more flexible and resilient than today’s. For example, the mix of generating sources will be more heterogeneous and will vary with time (e.g., contributions from solar and wind power will fluctuate), which in turn will require adjustments such as finer-scale scheduling and pricing. The availability of real-time data from automated distribution networks, smart metering systems, and phasor data hold out the promise of more precise tailoring of services and of control, but only to the extent that large-scale data can be analyzed nimbly.
Today, operating limits are set by off-line (i.e., non-real-time) analysis. Operators make control decisions, especially rapid ones after an untoward event, based on incomplete data.
By contrast, the next-generation grid is envisioned to offer something closer to optimized utilization of assets, optimized pricing and scheduling (analogous to, say, time-varying pricing and decision making in Internet commerce), and improved reliability and product quality. In order to design, monitor, analyze, and control such a system, advanced mathematical capabilities must be developed to ensure optimal operation and robustness; the envisioned capabilities will not come about simply from advances in information technology.
Within just one of the regional interconnects, a model may have to represent the behavior of hundreds of thousands of components and their complex interaction affecting the performance of the entire grid. While models of this size can be solved now, models where the number of components is many times larger cannot be solved with current technology.
As the generating capacity becomes more varied due to the variety of renewable sources, the number of possible states of the overall system will increase. While the vision is to treat it as a single interdependent, integrated system, the complete system is multi-scale (in both space and time) and multi-physics, is highly nonlinear, and has both discrete and continuous behaviors, putting an integrated view beyond current capabilities. In addition, the desire to better monitor and control the condition of the grid leads to large-scale flows of data that must in some cases be analyzed in real time.
Creating decision-support systems that can identify emerging problems and calculate corrective actions quickly is a nontrivial challenge. Decision-support tools for non-real-time tasks—such as pricing, load forecasting, design, and system optimization—also require new mathematical capabilities.
The future grid will rely on integrating advanced computation and massive data to create a better understanding that supports decision making. That future grid cannot be achieved simply by using the same mathematics on more powerful computers. Instead, the future will require new classes of models and algorithms, and those models must be amenable to coupling into an integrated system.
The grid itself and the conditions under which it operates are changing, and the end state is uncertain. For example, new resources, especially intermittent renewable energy such as wind and solar, are likely to become more important, and these place new demands on controlling the grid to maintain reliability.
This report contains the recommendations of the committee for new research and policies to improve the mathematical foundations for the next-generation grid. In particular
- New technologies for measurement and control of the grid are becoming available. Wide area measurement systems provide a much clearer picture of what is happening on the grid, which can be vital during disruptions, whether from equipment failure, weather conditions, or terrorist attack. Such systems send a huge amount of data to control centers, but the data are of limited use unless they can be analyzed and the results presented in a way suitable for timely decision making.
- Improved models of grid operation can also increase the efficiency of the grid, taking into account all the resources available and their characteristics; however, a systematic framework for modeling, defining performance objectives, ensuring control performance, and providing multidimensional optimization will be needed. If the grid is to operate in a stable way over many different kinds of disturbances or operating conditions, it will be necessary to introduce criteria for deploying more sensing and control in order to provide a more adaptive control strategy. These criteria include expense and extended time for replacement.
- Other mathematical and computational challenges arise from the integration of more alternative energy sources (e.g., wind and photovoltaics) into the system. Nonlinear alternating current ACOPF can be used to help reduce the risk of voltage collapse and enable lines to be used within the broader limits, and flexible ac transmission systems and storage technology can be used for eliminating stability- related line limits.
- Transmission and distribution are often planned and operated as separate systems, and there is little feedback between these separate systems beyond the transmission system operator’s knowing the amount of power to be delivered and the distribution system operator’s knowing what voltage to expect. As different types of distributed energy resources, including generation, storage, and responsive demand are embedded within the distribution network, different dynamic interactions between the transmission and distribution infrastructure may occur. One example is the synchronous and voltage stability issues of distributed generation that change the dynamic nature of the overall power system. It will be important in the future to establish more complete models that include the dynamic interactions between the transmission and distribution systems, including demand-responsive loads.
- In addition, there need to be better planning models for designing the sustainable deployment and utilization of distributed energy resources. Estimating future demand for grid electricity and the means to provide it entail uncertainty. New distributed-generation technologies move generation closer to where the electricity is consumed.
- Climate change will introduce several uncertainties affecting the grid. In addition to higher temperatures requiring increased air conditioning loads during peak hours, shifting rainfall patterns may affect the generation of hydroelectricity and the availability of cooling water for generating plants. The frequency of intense weather events may increase. Policies to reduce emissions of carbon dioxide, the main greenhouse gas, will affect generating sources. Better tools to provide more accurate forecasting are needed.
- Modeling and mitigation of high-impact, low-frequency events (including coordinated physical or cyberattack; pandemics; high-altitude electromagnetic pulses; and large-scale geomagnetic disturbances) is especially difficult because few very serious cases have been experienced. Outages from such events could affect tens of millions of people for months. Fundamental research in mathematics and computer science could yield dividends for predicting the consequences of such events and limiting their damage.
Ten years ago, few people could have predicted the current energy environment in the United States—from the concern for global warming, to the accelerated use of solar and wind power, to the country’s near energy independence [My comment: Ha!!! Guess power engineers can’t be experts in geology as well…]
Physical Structure of the Existing Grid and Current Trends
Economies of scale resulted in most electric energy being supplied by large power plants. Control of the electric grid was centralized through exclusive franchises given to utilities.
However, the grid that was developed in the 20th century, and the incremental improvements made since then, including its underlying analytic foundations, is no longer adequate to completely meet the needs of the 21st century.
The next-generation electric grid must be more flexible and resilient. While fossil fuels will have their place for decades to come, the grid of the future will need to accommodate a wider mix of more intermittent generating sources such as wind and distributed solar photovoltaics. Some customers want more flexibility to choose their electricity supplier or even generate some of their own electricity, in addition to which a digital society requires much higher reliability.
The availability of real-time data from automated distribution networks, smart metering systems, and phasor measurement units (PMUs) holds out the promise of more precise tailoring of the performance of the grid, but only to the extent that such large-scale data can be effectively utilized. Also, the electric grid is increasingly coupled to other infrastructures, including natural gas, water, transportation, and communication. In short, the greatest achievement of the 20th century needs to be reengineered to meet the needs of the 21st century. Achieving this grid of the future will require effort on several fronts.
The purpose of this report is to provide guidance on the longer-term critical areas for research in mathematical and computational sciences that is needed for the next-generation grid.
Excepting islands and some isolated systems, North America is powered by the four interconnections shown in Figure 1.1. Each operates at close to 60 Hz but runs asynchronously with the others. This means that electric energy cannot be directly transmitted between them. It can be transferred between the interconnects by using ac- dc-ac conversion, in which the ac power is first rectified to dc and then inverted back to 60 Hz.
Any electric power system has three major components: the generator that creates the electricity, the load that consumes it, and the wires that move the electricity from the generation to the load. The wires are usually subdivided into two parts: the high- voltage transmission system and the lower-voltage distribution system. A ballpark dividing line between the two is 100 kV. In North America just a handful of voltages are used for transmission (765, 500, 345, 230, 161, 138, and 115 kV). Figure 1.2 shows the U.S. transmission grid. Other countries often use different transmission voltages, such as 400 kV, with the highest commercial voltage transmitted over a 1,000-kV grid in China.
The transmission system is usually networked, so that any particular node in this system (known as a “bus”) will have at least two incident lines. The advantage of a networked system is that loss of any single line would not result in a power outage.
While ac transmission is widely used, the reactance and susceptance of the 50- or 60- Hz lines without compensation or other remediation limit their ability to transfer power long distances overhead (e.g., no farther than 400 miles) and even shorter distances in underground/undersea cables (no farther than 15 miles). The alternative is to use high- voltage dc (HVDC), which eliminates the reactance and susceptance. Operating at up to several hundred kilovolts in cables and up to 800 kV overhead, HVDC can transmit power more than 1,000 miles. One disadvantage of HVDC is the cost associated with the converters to rectify the ac to dc and then invert the dc back to ac. Also, there are challenges in integrating HVDC into the existing ac grid.
Commercial generator voltages are usually relatively low, ranging from perhaps 600 V for a wind turbine to 25 kV for a thermal power plant. Most of these generators are then connected to the high-voltage transmission system through step-up transformers. The high transmission voltages allow power to be transmitted hundreds of miles with low losses— total transmission system losses are perhaps 3 percent in the Eastern Interconnection and 5 percent in the Western Interconnection.
Large-scale interconnects have two significant advantages. The first is reliability. By interconnecting hundreds or thousands of large generators in a network of high-voltage transmission lines, the failure of a single generator or transmission line is usually inconsequential. The second is economic. By being part of an interconnected grid, electric utilities can take advantage of variations in the electric load levels and differing generation costs to buy and sell electricity across the interconnect. This provides incentive to operate the transmission grid so as to maximize the amount of electric power that can be transmitted.
However, large interconnects also have the undesirable side effect that problems in one part of the grid can rapidly propagate across a wide region, resulting in the potential for large-scale blackouts such as occurred in the Eastern Interconnection on August 14, 2003. Hence there is a need to optimally plan and operate what amounts to a giant electric circuit so as to maximize the benefits while minimizing the risks.
Power Grid Time Scales
Anyone considering the study of electric power systems needs to be aware of the wide range in time scales associated with grid modeling and the ramification of this range on the associated techniques for models and analyses. Figure 1.4 presents some of these time scales, with longer term planning extending the figure to the right, out to many years. To quote University of Wisconsin statistician George Box, “Essentially, all models are wrong, but some are useful. However, the approximate nature of the model must always be borne in mind”. Using a model that is useful for one time scale for another time scale might be either needless overkill or downright erroneous.
The actual power grid is never perfectly balanced. Most generators and some of the load are three-phase systems and can be fairly well represented using a balanced three-phase model. While most of the distribution system is three-phase, some of it is single phase, including essentially all of the residential load. While distribution system designers try to balance the number of houses on each phase, the results are never perfect since individual household electricity consumption varies. In addition, while essentially all transmission lines are three phase, there is often some phase imbalance since the inductance and capacitance between the phases are not identical. Still, the amount of phase imbalance in the high-voltage grid is usually less than 5 percent, so a balanced three-phase model is a commonly used approximation.
While an interconnected grid is just one big electric circuit, many of them, including the North American Eastern and Western Interconnections, were once divided into “groups”; at first, each group corresponded to an electric utility. These groups are now known as load-balancing areas (or just “areas”). The transmission lines that join two areas are known as tie lines.
Power transactions between different players (e.g., electric utilities, independent generators) in an interconnection can take from minutes to decades. In a large system such as the Eastern Interconnection, thousands of transactions can be taking place simultaneously, with many of them involving transaction distances of hundreds of miles, each potentially impacting the flows on a large number of transmission lines. This impact is known as loop flow, in that power transactions do not flow along a particular “contract path” but rather can loop through the entire grid.
Day-Ahead Planning and Unit Commitment
In order to operate in the steady state, a power system must have sufficient generation available to at least match the total load plus losses. Furthermore, to satisfy the N – 1 reliability requirement, there must also be sufficient generation reserves so that even if the largest generator in the system were unexpectedly lost, total available generation would still be greater than the load plus losses. However, because the power system load is varying, with strong daily, weekly, and seasonal cycles, except under the highest load conditions there is usually much more generation capacity potentially available than required to meet the load. To save money, unneeded generators are turned off. The process of determining which generators to turn on is known as unit commitment. How quickly generators can be turned on depends on their technology. Some, such as solar PV and wind, would be used provided the sun is shining or the wind blowing, and these are usually operated at their available power output. Hydro and some gas turbines can be available within minutes. Others, such as large coal, combined-cycle, or nuclear plants, can take many hours to start up or shut down and can have large start-up and shutdown costs.
Unit commitment seeks to schedule the generators to minimize the total operating costs over a period of hours to days, using as inputs the forecasted future electric load and the costs associated with operating the generators. Unit commitment constraints are a key reason why there are day-ahead electricity markets. Complications include uncertainly associated with forecasting the electric load, coupled increasingly with uncertainty associated with the availability of renewable electric energy sources such as wind and solar.
The percentage of energy actually provided by a generator relative to the amount it could supply if it were operated continuously at its rated capacity is known as its capacity factor. Capacity factors, which are usually reported monthly or annually, can vary widely, both for individual generators and for different generation technologies. Approximate annual capacity factors are 90% for nuclear, 60% for coal, 48% for natural gas combined cycle, 38% for hydro, 33% for wind, and 27 % for solar PV (EIA, 2015). For some technologies, such as wind and solar, there can be substantial variations in monthly capacity factors as well.
Planning takes place on time scales ranging from perhaps hours in a control room setting, to more than a decade in the case of high-voltage transmission additions. The germane characteristic of the planning process is uncertainty. While the future is always uncertain, recent changes in the grid have made it even more so. Planning was simpler in the days when load growth was fairly predictable and vertically integrated utilities owned and operated their own generation, transmission, and distribution. Transmission and power plant additions could be coordinated with generation additions since both were controlled by the same utility.
As a result of the open transmission access that occurred in the 1990s, there needed to be a functional separation of transmission and generation, although there are still some vertically integrated utilities. Rather than being able to unilaterally plan new generation, a generation queue process is required in which requests for generation interconnections needed to be handled in a nondiscriminatory fashion. The large percentage of generation in the queue that will never actually get built adds uncertainty, since in order to determine the incremental impact of each new generator, an existing generation portfolio needs to be assumed.
FIGURE 1.18 “Duck” curve. SOURCE: Courtesy of California Independent System Operator (California ISO, 2013). Licensed withpermission from the California ISO. Any statements, conclusions, summaries or other commentaries 1.18 expressed herein do not reflect the opinions or endorsement of the California ISO.
Also there is the question of who bears the risk associated with the construction of new generation. More recently, additional uncertainty is the growth in renewable generation such as wind and solar PV and in demand-responsive load.
Distribution Systems
As was mentioned earlier, the portion of the system that ultimately delivers electricity to most customers is known as the distribution system. This section provides a brief background on the distribution system as context for the rest of the report.
Sometimes the distribution system is directly connected to the transmission system, which operates at voltages above, say, 100 kV, and sometimes it is connected to a subtransmission system, operating at voltages of perhaps 69 or 46 kV. At the electrical substation, transformers are used to step down the voltage to the distribution level, with 12.47 kV being the most common in North America (Willis, 2004). These transformers vary greatly in size, from a few MWs in rural locations to more than 100 MW for a large urban substation.
The electricity leaves the substation on three-phase “primary trunk” feeders. While the distribution system can be networked, mostly it is radial. Hence on most feeders the flow of power has been one-way, from the substation to the customers. The number of feeders varies by substation size, from one to two up to more than a dozen. Feeder maximum power capacity can also vary widely from a few MVA to about 30 MVA. Industrial or large commercial customers may be served by dedicated feeders. In other cases smaller “laterals” branch off from the main feeder. Laterals may be either three phase or single phase (such as in rural locations). Most of the main feeders and laterals use overhead conductors on wooden poles, but in urban areas and some residential neighborhoods they are underground. At the customer location the voltage is further reduced by service transformers to the ultimate supply voltage (120/240 for residential customers). Service transformers can be either pole mounted, pad mounted on the ground, or in underground vaults. Typical sizes range from 5 to 5,000 kVA.
A key concern with the distribution system is maintaining adequate voltage levels to the customers. Because the voltage drop along a feeder varies with the power flow on the feeder, various control mechanisms are used. There include LTC transformers at the substation to change the supply voltage to all the substation feeders supplied by the transformer, voltage regulators that can be used to change the voltage for individual feeders (and sometimes even the individual phases), and switched capacitors to provide reactive power compensation.
Another key concern is protection against short circuits. For radial feeders, protection is simpler if the power is always flowing to the customers. Simple protection can be provided by fuses, but a disadvantage of a fuse is that a crew must be called in the event of it tripping. More complex designs using circuit breakers and re-closers allow for remote control, helping to reduce outage times for many customers.
With reduced costs for metering, communication, and control, the distribution system is rapidly being transformed. Distributed generation sources on the feeders, such as PV, mean that power flow may no longer be just one-way. Widely deployed advanced metering infrastructure systems are allowing near-real-time information about customer usage. Automated switching devices are now being widely deployed, allowing the distribution system to be dynamically reconfigured to reduce outage times for many customers. Advanced analytics are now being developed to utilize this information to help improve the distribution reliability and efficiency. Hence the distribution system is now an equal partner with the rest of the grid, with its challenges equally in need of the fundamental research in mathematical and computational sciences being considered in this report.
Organizations and Markets in the Electric Power Industry
Physically, a large-scale grid is ultimately an electrical circuit, joining the loads to the generators. However, it is a shared electrical circuit with many different players utilizing that circuit to meet the diverse needs of electricity consumers. This circuit has a large physical footprint, with transmission lines crisscrossing the continent and having significant economic and societal impacts. Because the grid plays a key role in powering American society, there is a long history of regulating it in the United States at both the state and federal levels. Widespread recognition that reliability of the grid is paramount led to the development of organizational structures playing major roles in how electricity is produced and delivered. Key among these structures is the Federal Energy Regulatory Commission (FERC), the North American Electric Reliability Corporation (NERC), and federal, regional, and state agencies that establish criteria, standards, and constraints.
In addition to regulatory hurdles, rapidly evolving structural elements within the industry, such as demand response, load diversity, different fuel mixes (including huge growth in the amount of renewable generation), and markets that help to determine whether new capacity is needed, all present challenges to building new transmission infrastructure. With these and many other levels of complexity affecting the planning and operation of a reliable power system, the need for strong, comprehensive, and accurate computational systems to analyze vast quantities of data has never been greater.
HISTORY OF FEDERAL AND STATE REGULATION WITH REGIONAL STANDARDS DEVELOPMENT
Since the creation of Edison’s Pearl Street Station in 1882, electric utilities have been highly regulated. This initially occurred at the municipal level, since utilities needed to use city streets to route their wires, necessitating a franchise from the city. In the late 1800s, many states within the United States formed public utility regulatory agencies to regulate railroad, steamboat, and telegraph companies. With the advent of larger electric power utility companies in the early 1900s, state regulatory organizations expanded their scopes to regulate electric power companies.
Regulatory Development
Almost from their inception, electric utilities were viewed as a natural monopoly. Because of the high cost of building distribution systems and the social impacts associated with the need to use public space for the wires, it did not make sense to have multiple companies with multiple sets of wires competing to provide electric service in the same territory. Electric utilities were franchised initially by cities and later (in the United States) by state agencies. An electric utility within a franchised service territory “did it all.” This included owning the increasingly larger generators and the transmission and distribution system wires, and continued all the way to reading the customer’s meters. Customers did not have a choice of electric supplier (many still do not). Local and state regulators were charged with keeping electric service rates just and reasonable within these franchised service territories.
Reliability Organization Development
On June 1, 1968, the electricity industry formed NERC in response to the FPC recommendation and the 1965 blackout, when 30 million people lost power in the northeastern United States and southeastern Canada. In 1973, the utility industry formed the Electric Power Research Institute to pool research and improve reliability. After another blackout occurred in New York City in July 1977, Congress reorganized the FPC into the Federal Energy Regulatory Commission and expanded the organization’s responsibilities to include the enactment of a limited liability provision in federal legislation, allowing the federal government to propose voluntary standards. In 1980, the North American Power Systems Interconnection Committee (known as NAPSIC) became the Operating Committee for NERC, putting the reliability of both planning and operation of the interconnected grid under one organization. In 1996, two major blackouts in the western United States led the members of the Western System Coordinating Council to develop the Reliability Management System. Members voluntarily entered into agreements with the council to pay fines if they violated certain reliability standards. In response to the same two western blackout events, NERC formed a blue-ribbon panel and the Department of Energy formed the Electric System Reliability Task Force. These independent investigations led the two groups to recommend separately the creation of an independent, audited self- regulatory electric reliability organization to develop and enforce reliability standards throughout North America.
Both groups concluded that federal regulation was necessary to ensure the reliability of the North American electric power grid. Following those conclusions, NERC began converting its planning policies, criteria, and guides into reliability standards.
On August 14, 2003, North America experienced its worst blackout to that date, with 50 million people losing power in the Midwestern and northeastern United States and in Ontario, Canada. On August 8, 2005, the Energy Policy Act of 2005 authorized the creation of an electric reliability organization and made reliability standards mandatory and enforceable. On July 20, 2006, FERC certified NERC as the electric reliability organization for the United States. From September through December 2006, NERC signed memoranda of understanding with Ontario, Quebec, Nova Scotia, and the National Energy Board of Canada. Following the execution of these agreements, on January 1, 2007, the North American Electric Reliability Council was renamed the North American Electric Reliability Corporation. Following the establishment of NERC as the electric reliability organization for North America, FERC approved 83 NERC Reliability Standards, representing the first set of legally enforceable standards for the bulk electric power system in the United States.
On April 19, 2007, FERC approved agreements delegating its authority to monitor and enforce compliance with NERC reliability standards in the United States to eight regional entities, with NERC continuing in an oversight role.
North American Regional Entities
There are many characteristic differences in the design and construction of electric power systems across North America that make a one-size- fits-all approach to reliability standards across all of North America difficult to achieve. A key driver for these differences is the diversity of population densities within North America, which affects the electric utility design and construction principles needed to reliably and efficiently provide electric service in each different area. There are eight regional reliability organizations covering the United States, Canada, and a portion of Baja California Norte Mexico (Figure 2.1). The members of these regional entities represent virtually all segments of the electric power industry and work together to develop and enforce reliability standards, while addressing reliability needs specific to each organization.
The largest power flow cases routinely solved now contain at most 100,000 buses…When a contingency occurs, such as a fault on a transmission line or the loss of a generator, the system experiences a “jolt” that results in a mismatch between the mechanical power delivered by the generators and the electric power consumed by the load. The phase angles of the generators relative to one another change owing to power imbalance. If the contingency is sufficiently large it can result in generators losing synchronism with the rest of the system, or in the protection system responding by removing other devices from service, perhaps starting a cascading blackout.
Stability issues have been a part of the power grid since its inception, with Edison having had to deal with hunting oscillations on his steam turbines in 1882, when he first connected them in parallel
In the case of wind farms, the dynamics of the turbine and turbine controls behind the inverter are also important. Because these technologies are developing rapidly and in some cases are manufacturers’ proprietary models, industry standard models with sufficient fidelity for TS lag behind the real-world developments. The development of inverter-based synthetic inertia and synthetic governor response from wind farms, photovoltaic farms, and grid-connected storage systems will create additional modeling complexity.
DS solutions have become more important in recent years as a result of the increased use of renewable sources, which causes concerns about system dynamic performance in terms of frequency and area control error—control area dynamic performance. DS solutions typically rely on IEEE standard models for generator dynamics and simpler models for assumed load dynamics. As with TS solutions, providing accurate models for wind farm dynamics and for proposed synthetic inertial response and governor response is a challenge.
The advent of high penetrations of inverter-based renewable generation (wind farms, solar farms) has led to a requirement for interconnection studies for each new renewable resource to ensure that the new wind farm will not create problems for the transmission system. These interconnection studies begin with load-flow analyses to ensure that the transmission system can accommodate the increased local generation, but then broaden to address issues specific to inverter-based generation, such as analyzing harmonic content and its impact on the balanced three-phase system.
HARMONIC ANALYSIS
The models described in all sections of this report are based on the 60-Hz waveform and the assumption that the waveform is “perfect,” meaning that there are no higher-order harmonics caused by nonlinearities, switching, imperfect machines and transformers, and so on. However, inverters are switching a dc voltage at high frequencies to approximate a sine wave, and this inevitably introduces third, fifth, and higher-order harmonics or non-sine waveforms into the system. The increased use of renewables and also increased inverter-based loads make harmonic analysis—study of the behavior of the higher harmonics—more and more important. While interconnection standards tightly limit the harmonic content that individual inverters may introduce into the system, the presence of multiple inverter-based resources in close proximity (as with a new transmission line to a region having many wind farms) can cause interference effects among the multiple harmonic sources.
Model predictive control (MPC) has been developed extensively in the literature for the AGC problem but has rarely been applied in the field. The minor improvements in the system which are not required by NERC standards today do not justify the increased cost and complexity of the software and the models needed. However, high penetration by renewables, decreased conventional generation available for regulation, the advent of new technologies such as fast short-term storage (flywheels, batteries), and short-term renewable production forecasting may reopen the investigation of MPC for AGC.
MODELING HIGH-IMPACT, LOW-FREQUENCY EVENTS
An emerging area for which some analytic tools and methods are now becoming available is the modeling of what are often referred to as high-impact, low-frequency (HILF) events —that is, events that are statistically unlikely but still plausible and, if they were to occur, could have catastrophic consequences. These include large-scale cyber or physical attacks, pandemics, electromagnetic pulses (EMPs), and geomagnetic disturbances (GMDs). This section focuses on GMDs since over the last several years there has been intense effort in North America to develop standards for assessing the impact of GMDs on the grid.
GMDs, which are caused by coronal mass ejections from the Sun, can impact the power grid by causing low frequency (less than 0.1 Hz) changes in Earth’s magnetic field. These magnetic field changes then cause quasi-dc electric fields, which in turn cause what are known as geo-magnetically induced currents (GICs) to flow in the high-voltage transmission system. The GICs impact the grid by causing saturation in the high-voltage transformers, leading to potentially large harmonics, which in turn result in both greater reactive power consumption and increased heating. It has been known since the 1940s that GMDs have the potential to impact the power grid; a key paper in the early 1980s showed how GMD impacts could be modeled in the power flow.
The two key concerns associated with large GMDs are that (1) the increased reactive power consumption could result in a large-scale blackout and (2) the increased heating could permanently damage a large number of hard-to-replace high-voltage transformers.
Large GMDs are quite rare but could have catastrophic impact. For example, a 500 nT/min storm blacked out Quebec in 1989. Larger storms, with values of up to 5,000 nT/min, occurred in 1859 and 1921, both before the existence of large-scale grids. Since such GMDs can be continental in size, their impact on the grid could be significant, and tools are therefore needed to predict them and to allow utilities to develop mitigation methods.
The mathematical sciences provide essential technology for the design and operation of the power grid. Viewed as an enormous electrical network, the grid’s purpose is to deliver electrical energy from producers to consumers. The physical laws of electricity yield systems of differential equations that describe the time-varying currents and voltages within the system. The North American grid is operated in regimes that maintain the system close to a balanced three-phase, 60-Hz ideal. Conservation of energy is a fundamental constraint: Loads and generation must always balance. This balance is maintained in today’s network primarily by adjusting generation. Generators are switched on and off while their output is regulated continuously to match power demand. Additional constraints come from the limited capacity of transmission lines to deliver power from one location to another.
The character, size, and scope of power flow equations are daunting, but (approximate) solutions must be found to maintain network reliability. From a mathematical perspective, the design and operation of the grid is a two-step process. The first step is to design the system so that it will operate reliably. Here, differential equations models are formulated, numerical methods are used for solving them, and geometric methods are used for interpreting the solutions. The next section, “Dynamical Systems, briefly introduces dynamical systems theory, a branch of mathematics that guides this geometric analysis. Stability is essential, and much of the engineering of the system is directed at ensuring stability and reliability in the face of fluctuating loads, equipment failures, and changing weather conditions. For example, lightning strikes create large, unavoidable disturbances with the potential to abruptly move the system state outside its desired operating regime and to permanently damage parts of the system. Control theory, introduced in a later section, “Control,” is a field that develops devices and algorithms to ensure stability of a system using feedback.
More generation capacity is needed than is required to meet demand, for two reasons: (1) loads fluctuate and can be difficult to accurately predict and (2) the network should be robust in the face of failures of network components.
“Optimization,” describes some of the mathematics and computational methods for optimization that are key aspects of this process. Because these algorithms sit at the center of wholesale electricity markets, they influence financial transactions of hundreds of millions of dollars daily.
The electrical grid operates 24/7, but its physical equipment has a finite lifetime and occasionally fails. Although occasional outages in electric service are expected, an industry goal is to minimize these and limit their extent. Cascading failures that produce widespread blackouts are disruptive and costly. Systematic approaches to risk analysis, described in the section “Risk Analysis, Reliability, Machine Learning, and Statistics,” augment physical monitoring devices to anticipate where failures are likely and to estimate the value of preventive maintenance.
The American Recovery and Reinvestment Act of 2009 funded the construction and deployment of many of the phasor measurement units (PMUs) discussed in Chapter 1, so that by 2015 there are approximately 2,000 production-grade PMUs just in North America that are sampling the grid 30 to 60 times per second . This is producing an unprecedented stream of data, reporting currents and voltages across the power system with far greater temporal resolution (once every 4 to 6 seconds) than was available previously from the existing Supervisory Control and Data Acquisition (SCADA) systems.
The final section, “Uncertainty Quantification,” introduces mathematical methods for quantifying uncertainty. This area of mathematics is largely new, and the committee thinks that it has much to contribute to electric grid operations and planning. There are several kinds of uncertainty that affect efforts to begin merging real-time simulations with real-time measurements. These include the effects of modeling errors and approximations as well as the intrinsic uncertainty inherent in the intermittency of wind and solar generation and unpredictable fluctuations of loads. Efforts to create smart grids in which loads are subject to grid control and to generation introduce additional uncertainty.
Some of the uncertainty associated with the next-generation grid is quite deep, in the sense that there is fundamental disagreement over how to characterize or parameterize uncertainty. This can be the case in situations such as predictions associated with solar or wind power, or risk assessments for high-impact, low-frequency events.
RISK ANALYSIS, RELIABILITY, MACHINE LEARNING, AND STATISTICS
Power systems are composed of physical equipment that needs to function reliably. Many different pieces of equipment could fail on the power system: Generators, transmission lines, transformers, medium-/low-voltage cables, connectors, and other pieces of equipment could each fail, leaving customers without power, increasing risk on the rest of the power system, and possibly leading to an increased risk of cascading failure. The infrastructure of our power system is aging, and it is currently handling loads that are substantially larger than it was designed for. These reliability issues are expected to persist into the foreseeable future, particularly as the power grid continues to be used beyond its design specifications.
Energy theft
One of the most important goals set by governments in the developing world is universal access to reliable energy. While energy theft is not a significant problem in the United States, some utilities cannot provide reliable energy because of rampant theft, which severely depletes their available funding to supply power. Customers steal power by threading cables from powered buildings to unpowered buildings. They also thread cables to bypass meters or tamper with the meters directly, for instance, by pouring honey into them to slow them down. Power companies need to predict which customers are likely to be stealing power and determine who should be examined by inspectors for lack of compliance. Again, each customer can be represented by a vector x that represents the household, and the label y is the result of an inspector’s visit (the customer is either in compliance or not in compliance).
UNCERTAINTY IN WHAT LIES AHEAD
The grid of today is changing with the rapid integration of renewable energy resources such as wind and solar photovoltaic (PV) and the retirement of substantial amounts of coal generation. For example, in early 2015 in the United States, there was installed capacity of about 65 GW of wind and 9 GW of solar PV (out of a total of 1,070 GW), from less than 3 GW of wind and 0.4 GW of solar just 15 years back (EIA, 2009). However, this needs to be placed in context by noting that during the natural gas boom in the early 2000s, almost 100 GW of natural gas capacity was added in just 2 years! And solar thermal, which seemed so promising in 2009, has now been mostly displaced by solar PV because of dropping prices for the PV cells.
Further uncertainty arises because of the greater coupling of the electric grid to other infrastructures such as natural gas, water, and transportation. Finally, specific events can upset the best predictions. An example is the Japanese tsunami in 2011, which (among other factors) dimmed the prospects for a nuclear renaissance in the United States and elsewhere.
Some of the uncertainty currently facing the industry is illustrated in Figure 5.1. The drivers of this uncertainty are manifold: (1) cyber technologies are maturing and are becoming available at reasonable cost—these include sensing, such as phasor measurement units (PMUs), communications, control, and computing; (2) emergence of qualitatively new resources, such as renewable distributed energy resources (DERs)—PVs, wind generation, geothermal, small hydro, biomass, and the like; (3) new quest for large-scale storage—stationary batteries, as well as low-cost storage batteries such as those for use in electric vehicles; (4) changing transmission technologies such as increased use of flexible ac transmission system (FACTS) technologies and/or increased use of high-voltage direct current (HVDC) lines and the integration of other dc technologies; (5) environmental objectives for reducing pollutants; (6) industry reorganization, from fully regulated to service-oriented markets; and (7) the need for basic electrification in developing countries, which affects the priorities of equipment suppliers. Given these drivers, it is hard to predict exactly long-term power grid scenarios.
TECHNOLOGIES THAT WILL ENHANCE THE OBSERVABILITY OF THE GRID
Since the advent of the electric power grid, measurement technologies have been a necessary component of the system for both its protection and its control. For example, measuring the currents flowing in the power system wires and the bus voltages are two key quantities of importance. The currents are measured using current transformers, which convert the magnetic field of the primary circuit to a proportionally smaller current suitable for input to instrumentation. The voltages are measured using potential transformers (PTs), which utilize traditional transformer technology of two windings coiled on a common magnetic core to similarly proportionally reduce the line voltage to a voltage suitable for instrumentation. Through the middle of the 20th century higher voltages and coupled capacitive voltage transformers used capacitors as a voltage divider as a more practical alternative to a PT for extra-high-voltage transmission. Other instruments exploiting either the electric or the magnetic fields have been developed. More recently, optical sensors can convert the voltages and currents as a directly measured quantity
Bringing these measurements to a central location has been possible for many decades. Technologies such as Supervisory Control and Data Acquisition (SCADA) use specialized protocols to transmit the information gathered in substations through analog-to-digital conversion in various sensors that are directly connected to remote terminal units (RTUs). A typical SCADA architecture exchanges both measurement and control information between the front end processor in the control center and the RTUs in the substations. Modern SCADA protocols support reporting of exceptions in addition to more traditional polling approaches. These systems are critical to providing control centers with the information necessary to operate the grid and to providing control signals to the various devices in the grid to support centralized control and optimization of the system.
SCADA systems in use today have two primary limitations. First, they are relatively slow. Most systems poll once every 4 sec, with some of the faster implementations gathering data at a 2-sec scan rate. Second, they are not time synchronized. Often, the data gathered in the substation and passed to the central computer are not timestamped until they are registered into the real-time database at the substation. And as the information is gathered through the polling cycle, sometimes there can be a difference between the pre- and post-event measurements if something happens during the polling cycle itself.
First described in the 1980s, the PMUs mentioned in earlier chapters utilize the precise time available from systems such as the Global Positioning System. The microsecond accuracy available is reasonable for the accurate calculation of phase angles of various power system quantities. More broadly, high-speed time- synchronized measurements are broadly referred to as wide area measurement systems. These underwent significant development beginning in the 1990s and can now provide better measurements of system dynamics with typical data collection rates of 30 or more samples per second. Significant advances in networking technology within the past couple of decades have enabled wide area networks by which utilities can share their high-speed telemetry with each other, enabling organizations to have better wide area situational awareness of the power system. This is addressing one of the key challenges that was identified and formed into a recommendation following the August 14, 2003, blackout
There are several benefits of wide area measurement systems. First, because of the high-speed measurements, dynamic phenomena can be measured. The 0.1- to 5-Hz oscillations that occur on the power system can be compared to simulations of the same events, leading to calibration that can improve the power system models. It is important to have access to accurate measurements corresponding to the time scales of the system. Second, by providing a direct measure of the angle, there can be a real-time correlation between observed angles and potential system stress.
The measurements from PMUs, known as synchrophasors, can be used to manage off-normal conditions such as when an interconnected system breaks into two or more isolated systems, a process known as “islanding.” For example, during Hurricane Gustav, in September 2008, system operators from Entergy (the electric utility company serving the impacted area in Louisiana) were able to keep a portion of the grid that islanded from the rest of the Eastern Interconnection operating after the storm damage took all of the transmission lines out of service, isolating a pocket of generation and load. The isolated area continued to operate by balancing generation and load. The system operators credited synchrophasor technology with allowing them to keep this island operational during the restoration process
Researchers are looking at PMU data to expedite resolution of operating events such as voltage stability and fault location and to quickly diagnose equipment problems such as failing instrument transformers and negative current imbalances. More advanced applications use PMU data as inputs to the special protection systems or remedial action schemes, mentioned in Chapter 3 for triggering preprogrammed automated response to rapidly evolving system conditions.
All telemetry is subject to multiple sources of error. These include but are not limited to measurement calibration, instrumentation problems, loss of communications, and data drop-outs. To overcome these challenges, state estimation, introduced in Chapter 3, is used to compute the real-time state of the system. This is a model-fitting exercise, whereby the available data are used to determine the coefficients of a power system model. A traditional state estimator requires iteration to fit the nonlinear with the available measurements. With an overdetermined set of measurements, the state estimation process helps to identify measurements that are suspected of being inaccurate. Because synchrophasors are time aligned, a new type of linear state estimator has been developed and is now undergoing widespread implementation (Yang and Bose, 2011). The advantage of “cleaning” the measurements through a linear state estimator is that the application is not subject to the data quality errors that can occur with the measurement and communications infrastructure. Additional advances are under way, including distributed state estimation and dynamic state estimation.
One of the more recent challenges has been converting the deluge of new measurements available to a utility, from synchrophasors and other sources, into actionable information. Owing to the many more points of measurement available to a utility from smart meters and various distribution automation technologies, all organizations involved in the operation of the electric power grid are faced with an explosion of data and are grappling with techniques to utilize this information for making better planning and/or operational decisions. Big data analytics is being called on to extract information for enhancing various planning and operational applications.
One challenge includes the improved management of uncertainty. Whether it be the uncertainty associated with estimating future load or generation availability or the uncertainty associated with risks such as extreme weather or other natural or manmade disaster scenarios that could overtake the system, more sophisticated tools for characterizing and managing this uncertainty are needed.
Better tools to provide more accurate forecasting are also needed. One promising approach is through ensemble forecasting methods, in which various forecasting methods are compared with one another and their relative merits used to determine the most likely outcome (with appropriate confidence bounds).
Finally, better decision support tools, including intelligent alarm processors and visualization, are needed to enhance the reliability and effectiveness of the power system operational environment. Better control room automation over the years has provided an unprecedented increase in the effectiveness with which human operators handle complex and rapidly evolving events. During normal and routine situations, the role of the automation is to bring to the operator’s attention events that need to be addressed. However, during emergency situations, the role of the automation is to prioritize actions that need to be taken. Nevertheless, there is still room for improving an operator’s ability to make informed decisions during off-normal and emergency situations. More effective utilization of visualization and decision-support automation is still evolving, and much can be learned by making better use of the social sciences and applying cognitive systems engineering approaches.
TECHNOLOGIES THAT WILL ENHANCE THE CONTROLABILITY OF THE GRID
The value of advanced analytics is only as good as our ability to effect change in the system based on the result of those analytics. Whether it is manual control with a human in the loop or automated control that can act quickly to resolve an issue, effective controls are essential. The power system today relies on the primary, secondary, and tertiary hierarchical control strategies to provide various levels of coordinated control. This coordination is normally achieved through temporal and spatial separation of the various controls that are simultaneously operating. For example, high-speed feedback in the form of proportional-integral- derivative controls operates at power plants to regulate the desired voltage and power output of the generators. Supervisory control in the form of set points (e.g., maintain this voltage and that power output) is received by the power plant from a centralized dispatcher. Systemwide frequency of the interconnected power system is accomplished through automatic generation control, which calculates the desired power output of the generating plants every 4 sec.
Protection schemes that are used to isolate faults rely on local measurements to make fast decisions, supplemented by remote information through communications to improve the accuracy of those decisions. Various teleprotection schemes and technologies have been developed over the past several decades to achieve improved reliability by leveraging available communications technologies. In addition, microprocessor-based protective relays have been able to improve the selectivity and reliability of fault isolation, including advanced features such as fault location. One example is the ability to leverage traveling wave phenomena that provide better accuracy than traditional impedance-based fault location methods
All of these methods described above have one thing in common: judicious use of communications. For historical reasons, when communications were relatively expensive and unreliable, more emphasis was placed on local measurements for protection and control. Communications were used to augment this local decision making. With the advent of more inexpensive (and reliable) communication technologies, such as fiber-optic links installed on transmission towers, new distributed control strategies are beginning to emerge. Additionally, classical control approaches are being challenged by the increased complexity of distribution networks, with more distributed generation, storage, demand response, automatic feeder switching, and other technologies that are dramatically changing the distribution control landscape. It will soon no longer be possible to control the power system with the control approaches that are in use today (Hawaiian Electric Company, Inc., “Issues and Challenges,” http://www.hawaiianelectric.com/heco/Clean-Energy/Issues-and-Challenges )
Perhaps the biggest challenge underlying the mathematical and computational requirements for this research is the fact that any evolution from today’s operating and control practices will require that newly proposed methods cannot be best-effort methods; instead, a guaranteed performance (theoretical and tested) will be required if any new methods unfamiliar to the system operators are to be deployed. Today there is very little theoretical foundation for mathematical and computational methods capable of meeting provable performance goals over a wide range of operating conditions. More specifically, to arrive at the new mathematical and computational methods needed for the power system, one must recognize that the power system represents a very large-scale, complex, and nonlinear dynamic system with multiple time-varying interdependencies.
EFFECTS OF CLIMATE CHANGE
Many of the assumptions associated with the long-term operation of the electricity infrastructure are based on climatic conditions that prevailed in the past century. Climate changes appear likely to change some of those basic planning assumptions. If policy changes are made to mitigate carbon emissions, parallel changes to the entire power generation infrastructure and the transmission infrastructure connecting our sources of electricity supply will be necessary. This gets into institutional issues such as the availability of capital investment to accommodate these changes, and policies associated with how to recover the costs of the investments. The traditional utility business model would need to be changed to accommodate these developments.
If the average intensity of storms increases, or if weather events become more severe (hotter summers and/or colder winders), basic assumptions about the cost effectiveness of design trade-offs underlying the electric power infrastructure would need to be revisited. Examples of this are the elements for hardening the system against wind or water damage, the degree of redundancy that is included to accommodate extreme events, and the extent to which dual-fueled power plants are required to minimize their dependency on natural gas.
MATHEMATICAL AND COMPUTATIONAL CHALLENGES IN GRID ARCHITECTURES
At present, the system is operated according to practices whose theoretical foundations require reexamination. In one such practice, industry often uses linearized modes in order to overcome nonlinear temporal dynamics. For example, local decentralized control relies on linear controls with constant gain. While these designs are simple and straightforward, they lack the ability to adapt to changing conditions and are only valid over the range of operating conditions that their designers could envision. If the grid is to operate in a stable way over large ranges of disturbances or operating conditions, it will be necessary to introduce a systematic framework for deploying more sensing and control to provide a more adaptive and nonlinear dynamics-based control strategy. Similarly, to overcome nonlinear spatial complexity, the system is often modeled assuming weak interconnections of subsystems with stable and predictable boundary conditions between each, while assuming that only fast controls are localized. Thus, system-level models used in computer applications to support various optimization and decision-support functions generally assume steady-state conditions subject to linear constraints. As power engineers know, sometimes this simplifying assumption is not valid.
Other open mathematical and computational challenges include integrating more nondispatchable generation in the system or other optimized adjustment of devices or control systems. These opportunities for advancing the state of the art for computing technologies could be thought of as “deconstraining technologies”: The nonlinear ac optimal power flow can be used to help reduce the risk of voltage collapse and enable lines to be used within the broader limits; FACTS, HVDC lines, and storage technology can be used for eliminating stability-related line limits; and so on.
The problem of unit commitment and economic dispatch subject to plant ramping rate limits needs to be revisited in light of emerging technologies. It is important to recognize that ramping rate limits result from constraints in the energy conversion process in the power plant. But these are often modeled as static predefined limits that do not take into account the real-time conditions in the actual power generating facility. This is similar to the process that establishes thermal line limits and modifies them to account for voltage and transient stability problems.
As the dynamic modeling, control, and optimization of nonlinear systems mature, it is important to model the actual dynamic process of energy conversion and to design nonlinear primary control of energy conversion for predictable input-output characteristics of the power plants.
In closing, instead of considering stand-alone computational methods for enhancing the performance of the power system, it is necessary to understand end-to-end models and the mathematical assumptions made for modeling different parts of the system and their interactions. The interactions are multi-temporal (dynamics of power plants versus dynamics of the interconnected system, and the role of control); multi-spatial (spanning local to interconnection-wide); and contextual (i.e., performance objectives). It will be necessary to develop a systematic framework for modeling and to define performance objectives and control/optimization of different system elements and their interactions.
MATHEMATICAL & COMPUTATIONAL CHALLENGES IN LOCAL DISTRIBUTION GRID ARCHITECTURES
Today transmission and distribution are often planned and operated as separate systems. The fundamental assumption is that the transmission system will provide a prescribed voltage at the substation, and the distribution system will deliver the power to the individual residential and commercial customers. Historically, there is very little feedback between these separate systems beyond the transmission system operator needing to know the amount of power that needs to be delivered and the distribution system operator knowing what voltage to expect. It has been increasingly recognized, however, that as different types of distributed energy resources, including generation, storage, and responsive demand, are embedded within the distribution network, different dynamic interactions between the transmission and distribution infrastructure may occur. One example is the transient and small-signal stability issues of distributed generation that changes the dynamic nature of the overall power system. It will be important in the future to establish more complete models that include the dynamic interactions between the transmission and distribution systems.
In addition, there is a need for better planning models for designing the sustainable deployment and utilization of distributed energy resources. It is critical to establish such models to support the deployment of nondispatchable generation, such as solar, with other types of distributed energy resources and responsive demand strategies. To illustrate the fundamental lack of modeling and design tools for these highly advanced distribution grids, consider a small, real-world, self-contained electric grid of an island. Today’s sensing and control are primarily placed on controllable conventional power plants since they are considered to be the only controllable components. Shown in Figure 5.2a is the actual grid, comprising a large diesel power plant, small controllable hydro, and wind power plant. Following today’s modeling approaches, this grid gets reduced to a power grid, shown in Figure 5.2b, in which the distributed energy resources are balanced with the load. Moreover, if renewable plants (hydro and wind) are represented as a negative predictable load with superposed disturbances, the entire island is represented as a single dynamic power plant connected to the net island load (Figure 5.2c). (a)
In contrast with today’s local grid modeling, consider the same island grid in which all components are kept 5.2 and modeled (see Figure 5.3). The use of what is known as advanced metering infrastructure (AMI) allows information about the end user electricity usage to be collected on an hourly (or more frequent) basis. Different models are needed to exploit this AMI-enabled information to benefit the operating procedures used by the distribution system operator (DSO) in charge of providing reliable uninterrupted electricity service to the island. Notably, the same grid becomes much more observable and controllable. Designing adequate SCADA architecture for integrating more PVs and wind power generation and ultimately retiring the main fossil power plants requires such new models. Similarly, communication platforms and computing for decision making and automation on the island require models that are capable of supporting provable quality of service and reliability metrics. This is particularly important for operating the island during equipment failures and/or unexpected variations in power produced by the distributed energy resources. The isolated grid must remain resilient and have enough storage or responsive demand to ride through interruptions in available power generation without major disruptions. Full distribution automation also includes reconfiguration and remote switching.
MATHEMATICAL AND COMPUTATIONAL CHALLENGES IN MANAGING INTERDEPENDENCIES BETWEEN THE TRANSMISSION AND LOCAL DISTRIBUTION GRIDS/MICROGRIDS
Based on the preceding description of representative power grid architectures, it is fairly straightforward to recognize that different grid architectures present different mathematical and computational challenges for the existing methods and practices. These new architectures include multi-scale systems that range temporally between the relatively fast transient stability–level dynamics and slower optimization objectives. They consist, as well, of nonlinear dynamical systems, where today’s practice is to utilize linear approximations, and large-scale complexity, where it is difficult to completely model or fully understand all of the nuances that could occur, if only infrequently, during off-normal system conditions but that must be robustly resisted in order to maintain reliable operations at all times.
In all these new architectures the tendency has become to embed sensing/computing/control at a component level. As a result, models of interconnected systems become critical to support communications and information exchange between different industry layers. These major challenges then become a combination of (1) sufficiently accurate models relevant for computing and decision making at different layers of such complex, interconnected grids, (2) sufficiently accurate models for capturing the interdependencies/dynamic interactions, and (3) control theories that can accommodate adaptive and robust distributed, coordinated control. Ultimately, advanced mathematics will be needed to design the computational methods to support various time scales of decision making, whether it be fast automated controls or planning design tools.
The balance between security and financial incentives to keep data confidential on the one hand and open on the other to satisfy researchers’ needs for access to data. The path proposed here is to create synthetic data sets that retain the salient characteristics of confidential data without revealing sensitive information. Because developing ways to do this is in itself a research challenge, the committee gives one example of recent work to produce synthetic networks with statistical properties that match those of the electric grid. Ideally, one would like to have real-time, high- fidelity simulations for the entire grid that could be compared to current observations. However, that hardly seems feasible any time soon. Computer and communications resources are too limited, loads and intermittent generators are unpredictable, and accurate models are lacking for many devices that are part of the grid. The section “Data-Driven Models of the Electric Grid” discusses ways to use the extensive data streams that are increasingly available to construct data-driven simulations that extrapolate recent observations into the future without a complete physical model. Not much work of this sort has yet been done: Most attempts to build data-driven models of the grid have assumed that it is a linear system. However, there are exceptions that look for warning signs of voltage collapse by the monitoring of generator reactive power reserves.
SYNTHETIC DATA FOR FACILITATING THE CREATION, DEVELOPMENT, AND VALIDATION OF NEW POWER SYSTEM TOOLS FOR PLANNING AND OPERATIONS
Data of the right type and fidelity are the bedrock of any operational assessment or long-range planning for today’s electric power system. In operations, assessment through simulation and avoidance of potentially catastrophic events by positioning a system’s steady-state operating point based on that assessment is the mantra that has always led to reliability-constrained economical operation. In the planning regime, simulation again is key to determining the amount and placement of new generation, transmission, and distribution.
The data used to achieve the power industry’s remarkable record of universal availability of electricity has been relatively simple compared to future data needs, which will be characterized by a marked increase in uncertainty, the need to represent new disruptive technologies such as wind, storage, and demand-side management, and an unprecedented diversity in policy directions and decisions marked by a tension between the rights of states and power companies versus federal authority. The future grid is likely to be characterized by a philosophy of command and control rather than assessment and avoidance, which will mean an even greater dependence on getting the data right.
The U.S. electric power system is a critical infrastructure, a term used by the U.S. government to describe assets critical to the functioning of our society and economy. The Patriot Act of 2001 defined critical infrastructure as “systems and assets, whether physical or virtual, so vital to the United States that the incapacity or destruction of such systems and assets would have a debilitating impact on security, national economic security, national public health or safety, or any combination of those matters. Although the electric grid is perhaps the most critical of all the critical infrastructures, much of the data needed by researchers to test and validate new tools, techniques, and hypotheses is not readily available to them because of concerns about revealing too much data about critical infrastructures.
The electric industry perspective is that actual electric grid data are too sensitive to freely disseminate, a claim that is clearly understandable and justifiable. Network data are especially sensitive when they reveal not only the topology (specific electrical connections and their locations) but also the electrical apparatuses present in the network along with their associated parameters. Revealing these data to knowledgeable persons reveals information an operator would need to know to ensure a network is reliable as well as the vulnerabilities an intruder would like to know in order to disrupt the network for nefarious purposes.
There is also some justifiable skepticism that synthesized data might hide important relations that a direct use of the confidential data would reveal. This makes the development of a feedback loop from the synthetic data to the confidential data essential to develop confidence in the products resulting from synthetic data and to ensure their continuous improvement. A natural question is therefore what, if anything, can be done to alter realistic data so as to obtain synthetic data that, while realistic, do not reveal sensitive details. Hesitation to reveal too much data might also indicate a view of what problems need to be solved that differs from the committee’s view.
It is clear that the availability of realistic data is pressing, critical, and central to enabling the power engineering community to rely on increasingly verifiable scientific assessments. In an age of Big Data such assessments may become ever more pressing, perhaps even mandatory, for effective decision making.
Recommendation: Given the critical infrastructure nature of the electric grid and the critical need for developing advanced mathematical and computational tools and techniques that rely on realistic data for testing and validating those tools and techniques, the power research community, with government and industry support, should vigorously address ways to create, validate, and adopt synthetic data and make them freely available to the broader research community.
Using recent advances in network analysis and graph theory, many researchers have applied centrality measures to complex networks in order to study network properties and to identify the most important elements of a network. Real-world power grids experience changes continuously. The most dramatic evolution of the electric grid in the coming 10 to 20 years will possibly be seen from both the generation side and the smart grid demand side. Evolving random topology grid models would be significantly enhanced and improved and made even more useful if, among other things, realistic generation and load settings with dynamic evolution features, which can truly reflect the generation and ongoing load changes, could be added.
As conditions vary, set points of controllable equipment are adjusted by combining an operator’s insights about the grid response and the results of optimization given an assumed forecast. If done right, system operators do not have to interfere with the automation: Their main task is to schedule set points given the forecasts. Fast dynamic transitions between new equilibria are stabilized and regulated by the primary controllers. Beyond this primary control of individual machines, there are two qualitatively different approaches to ensuring stable and acceptable dynamics in the changing power industry:
- The first approach meets this goal of ensuring stable and acceptable dynamics via coordinated action of the system operators. Planners will attempt to embed sensing, communications, and controllers sufficient to guarantee system stability for the range of operating conditions of interest. This is an ambitious goal that faces theoretical challenges. For example, maintaining controllability and observability with increased numbers of sensors and controllers is a challenge given the current state of primary control. It seems feasible that current technologies will allow meeting performance objectives, which are now constrained by requirements for synchronization and voltage stabilization/regulation. As mechanically switched transmission and distribution equipment (phase angle regulators, online tap changers, and so forth) is replaced by electronic devices—flexible ac transmission systems, high- voltage dc transmission lines, and the like—the complexity of the control infrastructure for provable performance in a top-down manner is likely to become overwhelming. In particular, variable-speed drives for efficient utilization of power are likely to interfere with the natural grid response and the existing control of generators, transmission, and distribution equipment.
- The second approach is the design of distributed intelligent Balancing Authorities (iBAs) and protocols/ standards for their interactions. As discussed in Chapter 1, automatic generation control is a powerful automated control scheme and, at the same time, one of the simplest. Each area is responsible for coordinating its resources so that its level frequency is regulated within acceptable limits and deviations from the scheduled net power exchange with the neighboring control areas are regulated accordingly. A closer look into this scheme reveals that it is intended to regulate frequency in response to relatively slow disturbances, under the assumption that primary control of power plants has done its job in stabilizing the transients.
It is possible to generalize this notion into something that may be referred to as an iBA, which has full responsibility for stabilization and regulation of its own area. Microgrids, distribution networks, portfolios (aggregates) of consumers, portfolios of renewable resources, and storage are examples of such areas. It is up to the grid users to select or form an iBA so that it meets stability and regulation objectives on behalf of its members. The operator of a microgrid is responsible for the distributed energy resources belonging to an area: The microgrid must have sufficient sensing, communications, and control so that it meets the performance standard. This is much more doable in a bottom-up way, and it would resemble the enormously successful Transmission Control Protocol/Internet Protocol (TCP/IP). Many open questions remain about creating a more streamlined approach to ensuring that the emerging grid has acceptable dynamics. For example, there is a need for algorithms to support iBAs by assessing how to change control logic and communications of the existing controllers to integrate new grid members.
The contrast between these two approaches reflects the tension between centralized and distributed control. Because experiments cannot be performed regularly on the entire grid, computer models and simulations are used to test different potential architectures. One goal is to design the system to be very, very reliable to minimize both the number and size of power outages. The problem of cascading failures looms large here. The large blackouts across the northeastern United States in 1965, 2003, and 2007 are historical reminders that this is a real problem. Since protective devices are designed to disconnect buses of the transmission network in the event of large fault currents, an event at one bus affects others, especially those connected directly to the first bus. If this disturbance is large enough, it may trigger additional faults, which in turn can trigger still more. The N – 1 stability mandate has been the main strategy to ensure that this does not happen, but it has not been sufficient as a safeguard against cascading failures. The hierarchy of control for the future grid should include barriers that limit the spread of outages to small regions.
PHYSICS-BASED SIMULATIONS FOR THE GRID
How can mathematics research best contribute to simulation technology for the grid? Data-driven models, described in “Data-Driven Models of the Electric Grid” earlier in this chapter, begin with a functioning network. Moreover, they cannot address questions of how the grid will respond when subjected to conditions that have never been encountered. What will be the effects of installing new equipment? Will the control systems be capable of maintaining stability when steam-driven generators are replaced by intermittent renewable energy resources? Simulation of physics-based models is the primary means for answering such questions, and dynamical systems theory provides a conceptual framework for understanding the time-dependent behavior of these models and the real grid. Simulation is an essential tool for grid planning, and its design requires extensive control. In normal steady-state operating conditions, these simulations may fade into the background, replaced by a focus on optimization that incorporates constraints based on the time-dependent analysis. Within power systems engineering, this type of modeling and simulation includes TS analysis.
Creating Hybrid Data/Human Expert Systems for Operations
When a serious problem occurs on the power grid, operators might be overloaded with alarms, and it is not always clear what the highest priority action items should be. For example, a major disturbance could generate thousands of alarms. Certainly much work has been done over the years in helping operators handle these alarms and more generally maintain situation awareness, with Panteli and Kirschen (2015) providing a good overview of past work and the current challenges. However, still more work needs to be done. The operators need to quickly find the root cause of the alarms. Sometimes “expert systems” are used, whereby experts write down a list of handcrafted rules for the operators to follow.
CHALLENGES IN MODELING THE ELECTRIC GRID’S COUPLING WITH OTHER INFRASTRUCTURES
A reliable electric grid is crucial to modern society in part because it is crucial to so many other critical infrastructures. These include natural gas, water, oil, telecommunications, transportation, emergency services, and banking and finance (Rinaldi et al., 2001). Without a reliable grid many of these other infrastructures would degrade, if not immediately then within hours or days as their backup generators fail or run out of fuel. However, this coupling goes both ways, with the reliable operation of the grid dependent on just about every other infrastructure, with the strength of this interdependency often increasing.
Rinaldi, S.M et al. December 2001. Identifying, understanding and analyzing critical infrastructure interdependencies. IEEE Control Systems Magazine, pp. 11-25
For example, PNNL (2015) gives a quite comprehensive coverage of the couplings between the grid and the information and communication technology (ICT) infrastructure. The coupling between the grid and natural gas systems, including requirements for joint expansion planning, is presented in Borraz-Sanchez et al. (2016). The interdependencies between the electric and water infrastructures are shown in Sanders (2014) with a case study for the Texas grid presented in Stillwell et al. (2011). While some of these couplings are quite obvious, others are not, such as interrelationships between the grid and health care systems in considering the vulnerability of the grid to pandemics (NERC, 2010). The rapidly growing coupling between electricity and electric vehicle transportation is presented in Kelly et al. (2015).
PNNL. August 2015. The Emerging Interdependence of the Electric Power Grid and Information and Communication Technology. Pacific Northwest National Laboratory PNNL-24643.
Models that represent coupling between the grid and gas, water, transportation, or communication will almost certainly include hierarchical structures characterized by a mixture of discrete and continuous variables whose behavior follows nonlinear, nonconvex functions at widely varying time scales. This implies that new approaches for effectively modeling nonlinearities, formulating nonconvex optimization problems, and defining convex subproblems would be immediately relevant when combining different infrastructures.
References
Deign J (2020) Research Finds Unknown ‘Critical Points’ in European Grids Finding from Depsys highlights need for network intelligence to speed the energy transition. Greentechmedia.com
Lovejoy B (2022) Global chip shortage: Engineer shortfall is the next big problem. https://9to5mac.com/2022/01/03/global-chip-shortage-engineer-shortfall/
Makansi J (2007) Lights Out: The Electricity Crisis, the Global Economy, and What It Means To You.
NAERC (2006) Summary of 2006 Long-Term Reliability Assessment: The Reliability of the Bulk Power Systems In North America. North American Electric Reliability Council.
Sanger DE, Perlroth N, Barnes JE (2021) As Understanding of Russian Hacking Grows, So Does Alarm. New York Times.