The Texas electric grid outage

Preface. In February of 2021, millions of Texans and Mexicans lost electric power in a hard freeze. Oxer (2021) on the March 2 Power Hungry podcast, said that if the Texas grid had blacked out, it would have taken until May to bring the grid back up. 85 power plants tripped off when the frequency dropped from the idea 60 to 59.7 and had to shed their load or the frequency imbalance could damage the entire transmission system, interconnect transformers, substations, power plants. Everything failed, even piles of coal froze solid, and gas lines dependent on electric compressors to reduce CO2 emissions failed when the grid came down. Not very smart huh, better to use compressors powered by the natural gas flowing through the pipes. He also pointed out this could have been foreseen, there were huge freezes in 1899, 1933, the 1957 Panhandle blizzard, 1960 Houston snowstorm, 1985 San Antonio snowstorm, 2015 winter storm Goliath, and 2017 North American Ice storm 2017.

As the grid fails more often from lack of maintenance, climate changed weather, and natural gas decline, I have to wonder if the rich won’t move to areas that have the most reliable electricity. During the height of this record winter storm, 4 million Texans lost power, but those who lived on grids that connected hospitals, emergency responders, or downtown commercial buildings and condos were more likely to retain their power. Wealth, income and housing inequality make it much more likely for Black and Latinx families in Texas to live away from densely populated and more expensive parts of the city — and when they do live in urban areas, to reside in places that are not deemed essential to the functioning of the electrical grid. They are more likely to live in areas lacking the robust infrastructure necessary to weather environmental and man-made catastrophes (Joseph PE (2021) What’s happening in Texas and Mississippi has to stop. CNN.)

Texas electric grid outage in the news:

2021 Minnesota gasps at the financial damage it faces from the Texas freeze When Texas’ natural gas supplies froze up, prices soared, and now Minnesota’s customers are looking at an $800 million bill. Washington Post.   “…The Texas market is so large — second only to California’s — and its natural gas industry is so predominant that when things go wrong there, the impacts can be felt across the country. And in a state that eschews regulation, driving energy producers to cut costs as deeply as they can to remain competitive, things went spectacularly wrong the week of Valentine’s Day. With its ill-equipped natural gas systems clocked by the cold, Texas’s exports across the Rio Grande froze up and 4.7 million customers in northern Mexico went without electricity — more than in Texas itself. The spot price of gas jumped 30-fold as far west as Southern California. And all the way up by the Canadian border, gas utilities in Minnesota that turned to the daily spot market to meet demand say they had to pay about $800 million more than planned over the course of just five days as the Texas freeze-up pinched off supplies. “The ineptness and disregard for common-sense utility regulation in Texas makes my blood boil and keeps me up at night,” Katie Sieben, chairwoman of the Minnesota Public Utility Commission, said in an interview. “It is maddening and outrageous and completely inexcusable that Texas’s lack of sound utility regulation is having this impact on the rest of the country.”

Alice Friedemann www.energyskeptic.com  author of “Life After Fossil Fuels: A Reality Check on Alternative Energy”, April 2021, Springer, “When Trucks Stop Running: Energy and the Future of Transportation”, 2015, Springer, Barriers to Making Algal Biofuels, and “Crunch! Whole Grain Artisan Chips and Crackers”. Podcasts: Collapse Chronicles, Derrick Jensen, Practical Prepping, KunstlerCast 253, KunstlerCast278, Peak Prosperity , XX2 report

* * *

From a post by Pedro Prieto on an energy forum:

One of the less studied things and the most ignored and covert things in the pro-renewable field is the existence of this growing problem, as we advance both to lower EROI fossil fuels to be used in electricity generation plants and at the same time, the higher penetration of renewables in a given electric network and specially when they start to look to alternatives.


The problem of a modern society relying more and more on electricity in their infrastructure functioning is not only the problems of managing an electric network to avoid collapsing for frequency or voltage deviations, as a result of sudden, unexpected variations, difficult to control. Or otherwise, the higher and higher reliance on automatism and robotic to take self-decisions to order regional or rolling blackouts to avoid the global blackout.


The elephant in the room, imo, is the ability of a given energy network to recover from a catastrophic failure in the shorter possible time, as our lives depend more and more from the umbilical cord of the electricity supply and energy security.And here is where the fossil fuel societal infrastructure and the electric network infrastructure have a totally different nature.


As we may expect more frequent and intense catastrophic events, not only due to climate unexpected variations, but also to increasing pressure of population demand or fast and sudden changes in social consumption (i.e. the ICT technologies increasing part of the electric cake), the problem is how fast (or slow) a society can recover from a complete shut down. We have seen clearly the case of Puerto Rico, with the hurricanes. They made the whole electric network to collapse. After one year, still many places had not electricity and others were abandoned forever. The infrastructure that collapsed, was mainly the electric transport and distribution grid. The wind and solar PV parks and plants were destroyed. The fossil fueled power plants were basically not affected. But they could not deliver fluid because the transport and distribution networks were down for months. 

And what type of societal system came to the rescue?  Perhaps 100% electric ships and vessels bringing spares? Perhaps 100% electric shovels and cranes and trucks removing the damaged materials and taking the new equipment to places and 100% electric pick ups transporting the O&M teams? This is the main issue. The gas wells in Texas could have been frozen, but when it comes to recover them, it will be oil and gas powered systems the ones going to rescue and erecting them again. And kerosene powered helicopters and trucks and vans equipment will also fly to deice wind turbines and check the restarts. Not the vice versa. This is the important thing. The asphalt roads are still there to be run by trucks and heavy machinery to repair themselves,when necessary. Not the other way around.fossil fuel siderurgy and metallurgy will have to work to manufacture new PV modules and wind turbines for Puerto Rico. Not the other way around.

The important thing is that energy storage with fossil fuels is much easier than with a full 100% electric world. Mountains of coal around the fired plants could power them for a full year. Huge oil and gas tanks can store energy safely and out of most of the catastrophic failures and be ready to supply. But oil and gas storage medium and small systems are also quite immune to big catastrophes up to the level of a car tank or even a 2 gallons oil canister or a gas cylinder, or a 3,000 kilos of chopped wood, able to solve a huge domestic problem for one or two weeks, if necessary. The density and versatility of stored energy in per weight and volume of fossil fuel derivatives has no rival in the disperse and low energy density renewables.


In trying to move to a 100% full electric society, we are moving fast forward to the perfect storm, unless the pro-renewables roll up their sleeves and recognize they have to start by presenting credible 100% electric, durable, workable and cheap enough storage systems. In heavy machinery, in transport (not only in BEVs), specially in heavy trucks to carry food and real essentials and ships and so on. Then, when we can see that this is possible and achievable. Then they can continue with home solar PV gadgets and wind turbines and private electric cars. Not the other way around, that is starting the house by the roof. Let’s do first the “green” hydrogen plants at scale and see if this works. Let’s build synthetic green ethanol or methanol in volume enough to store it in as many tanks and as big like those storing oil and gas in Houston and in all the present big refineries in the world. And then, we can talk, not before.  

Afternote: Pedro Prieto is one of my favorite people in the energy/ecology community discussions — original, funny, and his English is poetic perhaps because his native language is Spanish. He has built massive solar farms and co-wrote “Spain’s solar revolution” with Charles Hall. I especially like his concluding paragraph.

Posted in Alternative Energy, Grid instability, Pedro Prieto | Tagged , , , | 2 Comments

Biocoal from food waste and sewage

Preface. This probably doesn’t have a net energy gain because of the energy to move waste and sewage to a common facility, and then transport these wastes from numerous places to the factory where biomass is converted to coal using more energy to do so. Wood biocoal is not economic (Jossi 2018), and biocoal has the low energy of lignite rather than the more useful and higher energy of anthracite and bituminous.

Nor does it scale up. This article mentions 3 plants that will produce 8,000 tonnes of biocoal a year. You’d need a million more factories to match the 8.5 billion tons of coal consumed per year.

Also, when natural gas fertilizers can no longer be made, compost and sewage now must become fertilizer.  If diverted to making biocoal, then crop production will decline.  And with peak phosphorous looming, compost and sewage will be especially necessary, though we can always go back to hunting and gathering, which sounds like a better lifestyle than agriculture to me.

Alice Friedemann www.energyskeptic.com  author of “Life After Fossil Fuels: A Reality Check on Alternative Energy”, April 2021, Springer, “When Trucks Stop Running: Energy and the Future of Transportation”, 2015, Springer, Barriers to Making Algal Biofuels, and “Crunch! Whole Grain Artisan Chips and Crackers”. Podcasts: Collapse Chronicles, Derrick Jensen, Practical Prepping, KunstlerCast 253, KunstlerCast278, Peak Prosperity , XX2 report

* * *

Merrifield R (2020) Making coal from food waste, garden cuttings – and even human sewage. Horizon Magazine.

Food waste, garden cuttings, manure, and even human sewage can be turned into solid biocoal for energy generation, and, if scaled up, could help match the industrial demand for carbon with the need to get rid of organic waste and reduce greenhouse gas emissions.

Europe has a biowaste problem. Rather than using the carbon-rich material for fuel, millions of tonnes of organic waste material are dumped in landfill, where it decomposes and gives off greenhouse gases. At the same time, the EU imports millions of tonnes of coal for industrial use and energy generation.

Efforts to match those imbalances could find a solution in biocoal—a carbon-neutral commodity made from organic waste that can be used as a source of energy, industrial raw materials or even as a way to store carbon, rather than emit it into the atmosphere.

One way to make the coal substitute is a process known as hydrothermal carbonisation (HTC), which uses super-heated water under pressure to produce biocoal in a few hours. It normally takes millions of years for fossil coal to form geologically.

“It’s really a very simple and stable process, because it acts like an acceleration of the natural formation of coal,” Hernandez Latorre said.

Ingelia has developed a proprietary HTC process for three biocoal plants—in Spain, the UK and Belgium, with a total capacity of 8,000 tonnes of biocoal per year. Several more are awaiting regulatory approval and should double capacity in the next couple of years.

“HTC biocoal … not only avoids the use of hard coal in industrial processes, but also the emission of methane from landfill,” Hernandez Latorre said, adding that the technology can recover up to 95% of the carbon from organic waste.

Methane is an even more potent greenhouse gas than carbon dioxide and a notable source is rubbish dumps. Europe abandons millions of tonnes of biowaste in landfill every year, and even where sites have methane-capture systems, a substantial portion of the gas can escape.

Pressure-cooker

Several different HTC methods have been developed, but the process generally works along the lines of a pressure-cooker, though the ingredients range from residue from food or drinks processing, agricultural waste, forestry industry discards such as woodchips and sawdust, to maize cobs and sewage.

The biowaste is put into a device known as a reactor, in temperatures from 180°C-250°C under pressure of the order of 2 megapascals (MPa) or 20 atmospheres. This means the water in the system is superheated, rather than converted into steam.

The reactor converts the solids in the organic material into hard biocoal—also known as hydrochar—while the liquids can be collected separately and used as bio-fertiliser and any gases given off are captured and used to power the system.

The biocoal has similar characteristics regardless of the biowaste used, though different raw materials do influence the quality by determining the ash content. Conditions in the reactor destroy pathogens and the resulting products are sterile. The coal slurry can also be processed to remove stones or shards of glass or metal, before being compressed into briquettes or pellets.

Ingelia’s basic HTC process can use food waste, for example, to produce biocoal similar to fossil browncoal, comprising about 60% carbon. This hydrochar can then go through extra steps to make higher-value ‘designer’ biocoal, removing ash and volatiles to ensure carbon content up to 90% – able to compete with top-grade hard coal.

“We can use (further processing) to tailor the final product, to recover from the bio-material exactly what they need for the industrial processes, in a circular economy (system),” Hernandez Latorre said.

Greenhouse gases

Hernandez Latorre says that internal Ingelia research shows that between 6.5 and 8.3 tonnes of CO2 equivalent are avoided per tonne of HTC biocoal produced, compared to a landfill operation with or without a methane-recovery system.

She says biocoal can have a market value of €170 per tonne for the most basic hydrochar, to more than €400 per tonne for top-grade biocoal with the highest carbon content, depending on its intended use.

Ingelia has combined its findings from several research projects into its HTC process and is aiming its technology at industries that rely on coal, sewage processing, which has to deal with organic waste, and energy producers moving away from coal-fired power generation towards renewables.

With the fall in coal prices and demand in the economic slowdown caused by the COVID-19 pandemic, it may take time for biocoal to displace fossil fuels in industry worldwide. But it offers one solution for those obliged to deal with organic waste and to meet the EU’s plan to become carbon-neutral by 2050.

Hernandez Latorre, who on 12 June was named the EU’s Mission Innovation Champion for her work in clean energy research, sees it playing an increasingly important role in the next 10-15 years.

“The market is really prepared to accept or implement new technologies, the only thing is they need to be sufficiently developed at scale,” she added.

Industries need sufficient market availability of biocoal to plan ahead for substitution of fossil fuels. And investors want to be sure they will have enough biowaste to process—and commitment from users to take their products—before they invest in sophisticated HTC units that could cost hundreds of thousands or even millions of euros.

Low-tech

Those set-up costs are prohibitive in many developing countries, even though biowaste poses a problem worldwide.

But a low-cost, low-tech version that uses human faeces to make biocoal and fertiliser could bring a double benefit to places where people lack sanitary facilities, said South Korean researcher Dr. Jae Wook Chung.

He sees potential to both generate income for communities and address their environmental and health problems caused by untreated excrement, citing WHO estimates that 673 million people have to defecate in the open – in the street, behind bushes or into open water.

Research has shown HTC reactors can be made for less than €20,000, but Dr. Chung aims to use a project called FEET to develop an even simpler, cheaper model that can be used in poor, high-density communities such as the Kibera slum in Kenya’s capital Nairobi.

He envisages a system about the size of an oil barrel, made with stainless-steel tubing available as a building supply in many developing countries. And he wants to monitor temperature and pressure from outside the reactor, avoiding expensive probes.

Dr. Chung will also focus on ways to ensure a sustainable supply of waste for processing—perhaps through organised emptying of pit latrines or portable lavatories—and to demonstrate the economic benefits of the biocoal and liquid fertiliser.

He sees making a sanitation system profitable for the community as key to making it sustainable, and to providing toilets in regions currently lacking them.

‘(The) economic benefit would also help those who have a cultural barrier to using conventional toilets move away from open defecation,” he said.

References

Jossi F (2018) Despite promising advances, costs keep wood biocoal on backburner. Energynews.us

Posted in Biomass, Coal | Tagged , , , , , | 2 Comments

The 10 states with the most farms

Preface. Of course there are many considerations: how climate change will affect farming in each state, the cost of the farmland, and other ecological factors discussed in the book by Hall & Day’s “America’s Most Sustainable Cities and Regions: Surviving the 21st Century Megatrends”.

On top of that, you need to be somewhere you’ll fit in, avoiding red states if you are gay, Muslim, atheist, or just about anything other than a white evangelist. Xenophobia is bound to grow as times get hard, and those of the wrong religion, ethnicity, and more will be jailed, killed, evicted, or forced to migrate. Cambodia, China and others killed or forced the educated into hard labor, man’s inhumanity to man is part of every nation and tribe. As my ecologist friends lament “what a species”. But yet another thing to keep in mind…

Alice Friedemann www.energyskeptic.com  author of “Life After Fossil Fuels: A Reality Check on Alternative Energy”, April 2021, Springer, “When Trucks Stop Running: Energy and the Future of Transportation”, 2015, Springer, Barriers to Making Algal Biofuels, and “Crunch! Whole Grain Artisan Chips and Crackers”. Podcasts: Collapse Chronicles, Derrick Jensen, Practical Prepping, KunstlerCast 253, KunstlerCast278, Peak Prosperity , XX2 report

* * *

WorldAtlas. 10 US States With The Highest Number Of Farms.

The US has a large agricultural industry and a large population that relies on it for sustenance. This country is also a net exporter of food. According to the 2007 agricultural census, the country had over 2.2 million farms that covered approximately 922 million acres combined. These statistics mean that by that year, on average, each farm covered 418 acres. Almost all states have farming activities, however, some states have more farms than others according to 2017 data. Texas leads with 240,000 farms and Missouri comes second with 97,300 farms. The other states with the most farms are Iowa (86,900), Oklahoma (77,200), California (77,100), Kentucky (76,800), Ohio (73,600), Minnesota (73,200), Illinois (71,000), and Wisconsin (68,500).

Texas

“Everything is bigger in Texas,” is a common saying that reflects also the size and number of farms in this state. One in every seven Texan has an agricultural-related job. Texas has over 130 million acres of land under farming, approximately 99% of which are family owned. Texas’ farming sector accounts for $115 billion annually. This state mostly produces animal products, cotton, and dairy which it sells across the state, the US, and worldwide. Other farming activities include commercial feedlots and artificial insemination. Although the state leads in the number of farms, the current number is a decrease from 420,000 in the 1940s. Mechanization of farms, pest and disease control, precision agriculture, use of improved agricultural and plant engineering, and commercial and science-oriented educated farmers continue to improve Texan farms thus making it the breadbasket of the country.

Missouri

The “show-me” state of Missouri has more than 28 million acres dedicated to farming, mainly for soybeans, corn, broiler chickens, hogs, and cattle. In 2014, the state exported agricultural commodities worth $4.35 billion. Missouri has a “one agriculture” policy where the state and farmers encourage collaboration in terms of research, techniques, and marketing. Just like in Texas, families own most of the farms in this state.

[my comment: I have a cousin who married a Mormon and converted. She told me in 2020 that Mormons are being asked to move to Missouri if they can, and many of her in-laws have done so. Mormons see Missouri as the birthplace of the human race, according to Joseph Smith, and the place where Christ will first step down in the second coming. And from a quick internet search, it appears that Mormons have been moving there for many years. ]

Iowa

In Iowa, it’s mostly families that control the farming industry. Approximately 85% of land in Iowa is dedicated to farming. Barns and buildings for cattle, hogs, dairy cows, poultry, turkeys, and sheep dot the Iowa countryside. 30,622,731 acres of land in Iowa is under farming, 26,256,347 of which is cropland while 1,294,425 acres is pastureland. The average farmland is 345 acres. The main farm products in the state are soybeans, corn, pork, and eggs among others. Farming has always been the dominant livelihood activity for the people of Iowa, and has a lengthy past dating back several years.

Posted in Real Estate | Tagged , | 2 Comments

Wanted: Math geniuses and power engineers to make a renewable grid possible

OPF solution of original seven-bus system with generator at bus 4 offering highFigure 1. OPF solution of original seven-bus system with generator at bus 4

Preface. The U.S. electric grid produced 64% of electricity in 2019 with finite fossil fuels, and another 20% from nuclear power. Since fossil fuels and uranium are finite, and biomass doesn’t scale up, the electric grid needs to evolve to 100% renewables from the 9% of renewables powering the U.S. grid today, with the majority of the new power from wind and solar, since sites for hydropower (and pumped), geothermal, utility scale batteries, and Compressed Air energy storage are limited and don’t scale up (the only utility scale battery with enough materials on earth to store just ONE day of U.S. electricity generation is Sodium Sulfur, and would cost $41 trillion and take up 945 square miles of land — calculations and citations in When Trucks Stop Running: Energy and the Future of Transportation

If supply and demand aren’t kept in exact balance, the grid can crash. So increasing penetration of wind and solar will make the grid less stable since they are unreliable, variable, and intermittent.  Power engineers need to solve this increasing instability. Right now, the only solution is natural gas (and limited hydropower) to dispatch quick enough to balance wind and solar.  Coal and nuclear plants can’t ramp up or down quickly enough without causing damage.

Just as difficult is to completely redesign the grid, which now is mainly a “one-way” grid where power flows from about 6,000 very large, centralized power plants outwards and existing systems can keep good track of it.  As millions of home and industrial solar panels and wind turbine farms push electricity the “wrong way” increase, the potential for a blackout grows, because this power is invisible to the operators who keep supply and demand in balance.

Distribution grids around the world tend to operate in relative darkness, in terms of lacking sensors and monitors to reveal their point-to-point and moment-to-moment condition to grid operators. That will have to change as distributed energy resources take up an increasing role. Solar PV in particular can cause problems on distribution systems designed for one-way power flows by causing voltage disruptions or tripping protective equipment. Electric vehicle chargers can add significant loads to circuits not designed to handle them, as can electrifying loads that now run on fossil fuels. To manage this shift, network investments will need to increase substantially over the next decade, covering not only traditional grid reinforcement but also “smart solutions,” such as demand-side flexibility (Deign 2020).

Control center room PJM


New models, new algorithms, new mathematics, and higher-powered computers than we have now will be needed to be invented to cope with tens of millions of future rooftop solar panels, wind turbines, machinery and appliances, energy storage devices, automated distribution networks, smart metering systems, and phasor measurement units (PMUs) sending trillions of bits of data every few seconds.  

This paper proposes that new institutes staffed with power and other engineers be created.  Which is easier said than done. Solar panels and wind turbines may be “sexy”, but becoming a power engineer isn’t.  Anyone smart enough to become a power engineer can make far more money in other fields, which is why most universities have dropped their power engineering department.

This can be seen in the coming expertise crisis — for every two electric sector employees about to retire, the industry has less than one to replace them (the nuclear power sector alone needs 90,000 trained workers and engineers soon).  A lack of specialized workers to maintain and operate the infrastructure will greatly impact affordable, reliable service since new employees don’t have a lifetime of knowledge. They’re bound to make catastrophic errors, which will increase rates for consumers and blackouts (Makansi 2007, NAERC 2006).

And if a new car has hundreds of microchips, imagine how many billions would be needed for a smart grid.  Yet there is an enormous shortage of engineers to design and create them. Each chip fabrication plant requires thousands of engineers to operate (Lovejoy 2022).

Renewable power needs genius engineers to also solve these issues:

  • The electric grid is interdependent on other systems (transportation, water, natural gas and more). These systems also need to be modeled to make sure there is no impact on them as the grid evolves.
  • As wind and solar grow, placing new unpredictable demands on the grid, better forecasting tools are needed.
  • Better climate change forecasting tools are also needed since climate change will introduce several uncertainties affecting the grid. In addition to higher temperatures requiring increased air conditioning loads during peak hours, shifting rainfall patterns may affect the generation of hydroelectricity and the availability of cooling water for generating plants. The frequency of intense weather events may increase.
  • Modeling and mitigation of high-impact events such as coordinated physical or cyberattack; pandemics; high-altitude electromagnetic pulses; and large-scale geomagnetic disturbances, and so on are especially difficult because few very serious cases have been experienced. Outages from such events could affect tens of millions of people for months.

This report anticipated the need to create fake data in order to hide real data from terrorists that might enable them to find weak points and how/where to attack them.  Well oops, too late! The Russian attack of up to 18,000 government and private networks via SolarWind likely snagged the Black start plans of how to restore the electric grid after a cataclysmic blackout.  The plans would give Russia a hit list of systems to target to keep power from being restored in an attack like the one it pulled off in Ukraine in 2015, shutting off power for six hours in the dead of winter. Moscow long ago implanted malware in the American electric grid, and the United States has done the same to Russia as a deterrent  (Sanger et al 2021).

Understanding this report and the problems that need to be solved requires a power engineering degree and  calculus, so I only listed a few of the most simple-to-understand problems above, and excerpted what I could understand.  Some of these issues are more understandably explained in the Pacific Northwest National Laboratory paper:  “The Emerging Interdependence of the Electric Power Grid and Information and Communication Technology”

The energy consumed to keep track of the data from billions of sensors and energy producing and consuming devices every few seconds in order to balance a distributed grid is likely to be too much. After all, global production of oil probably peaked in 2018, and it is the master resource that makes all others possible, including coal, uranium, wind turbines, solar panels, microchips, transportation and more.  In addition, the complexity of a distributed grid is just way to difficult to manage.

Alice Friedemann  www.energyskeptic.com  Author of Life After Fossil Fuels: A Reality Check on Alternative Energy; When Trucks Stop Running: Energy and the Future of Transportation”, Barriers to Making Algal Biofuels, & “Crunch! Whole Grain Artisan Chips and Crackers”.  Women in ecology  Podcasts: WGBH, Crazy Town, Collapse Chronicles, Derrick Jensen, Practical Prepping, Kunstler 253 &278, Peak Prosperity,  Index of best energyskeptic posts

***

NRC. 2016. Analytic Research Foundations for the Next-Generation Electric Grid. Washington, DC: The National Academies Press.  160 pages. Excerpts:

Summary

The electric grid is an indispensable critical infrastructure that people rely on every day.

The next-generation electric grid must be more flexible and resilient than today’s. For example, the mix of generating sources will be more heterogeneous and will vary with time (e.g., contributions from solar and wind power will fluctuate), which in turn will require adjustments such as finer-scale scheduling and pricing. The availability of real-time data from automated distribution networks, smart metering systems, and phasor data hold out the promise of more precise tailoring of services and of control, but only to the extent that large-scale data can be analyzed nimbly.

Today, operating limits are set by off-line (i.e., non-real-time) analysis. Operators make control decisions, especially rapid ones after an untoward event, based on incomplete data.

By contrast, the next-generation grid is envisioned to offer something closer to optimized utilization of assets, optimized pricing and scheduling (analogous to, say, time-varying pricing and decision making in Internet commerce), and improved reliability and product quality. In order to design, monitor, analyze, and control such a system, advanced mathematical capabilities must be developed to ensure optimal operation and robustness; the envisioned capabilities will not come about simply from advances in information technology.

Within just one of the regional interconnects, a model may have to represent the behavior of hundreds of thousands of components and their complex interaction affecting the performance of the entire grid. While models of this size can be solved now, models where the number of components is many times larger cannot be solved with current technology.

As the generating capacity becomes more varied due to the variety of renewable sources, the number of possible states of the overall system will increase. While the vision is to treat it as a single interdependent, integrated system, the complete system is multi-scale (in both space and time) and multi-physics, is highly nonlinear, and has both discrete and continuous behaviors, putting an integrated view beyond current capabilities. In addition, the desire to better monitor and control the condition of the grid leads to large-scale flows of data that must in some cases be analyzed in real time.

Creating decision-support systems that can identify emerging problems and calculate corrective actions quickly is a nontrivial challenge. Decision-support tools for non-real-time tasks—such as pricing, load forecasting, design, and system optimization—also require new mathematical capabilities.

The future grid will rely on integrating advanced computation and massive data to create a better understanding that supports decision making. That future grid cannot be achieved simply by using the same mathematics on more powerful computers. Instead, the future will require new classes of models and algorithms, and those models must be amenable to coupling into an integrated system.

The grid itself and the conditions under which it operates are changing, and the end state is uncertain. For example, new resources, especially intermittent renewable energy such as wind and solar, are likely to become more important, and these place new demands on controlling the grid to maintain reliability.

This report contains the recommendations of the committee for new research and policies to improve the mathematical foundations for the next-generation grid. In particular

  • New technologies for measurement and control of the grid are becoming available. Wide area measurement systems provide a much clearer picture of what is happening on the grid, which can be vital during disruptions, whether from equipment failure, weather conditions, or terrorist attack. Such systems send a huge amount of data to control centers, but the data are of limited use unless they can be analyzed and the results presented in a way suitable for timely decision making.
  • Improved models of grid operation can also increase the efficiency of the grid, taking into account all the resources available and their characteristics; however, a systematic framework for modeling, defining performance objectives, ensuring control performance, and providing multidimensional optimization will be needed. If the grid is to operate in a stable way over many different kinds of disturbances or operating conditions, it will be necessary to introduce criteria for deploying more sensing and control in order to provide a more adaptive control strategy. These criteria include expense and extended time for replacement.
  • Other mathematical and computational challenges arise from the integration of more alternative energy sources (e.g., wind and photovoltaics) into the system. Nonlinear alternating current ACOPF can be used to help reduce the risk of voltage collapse and enable lines to be used within the broader limits, and flexible ac transmission systems and storage technology can be used for eliminating stability- related line limits.
  • Transmission and distribution are often planned and operated as separate systems, and there is little feedback between these separate systems beyond the transmission system operator’s knowing the amount of power to be delivered and the distribution system operator’s knowing what voltage to expect. As different types of distributed energy resources, including generation, storage, and responsive demand are embedded within the distribution network, different dynamic interactions between the transmission and distribution infrastructure may occur. One example is the synchronous and voltage stability issues of distributed generation that change the dynamic nature of the overall power system. It will be important in the future to establish more complete models that include the dynamic interactions between the transmission and distribution systems, including demand-responsive loads.
  • In addition, there need to be better planning models for designing the sustainable deployment and utilization of distributed energy resources. Estimating future demand for grid electricity and the means to provide it entail uncertainty. New distributed-generation technologies move generation closer to where the electricity is consumed.
  • Climate change will introduce several uncertainties affecting the grid. In addition to higher temperatures requiring increased air conditioning loads during peak hours, shifting rainfall patterns may affect the generation of hydroelectricity and the availability of cooling water for generating plants. The frequency of intense weather events may increase. Policies to reduce emissions of carbon dioxide, the main greenhouse gas, will affect generating sources. Better tools to provide more accurate forecasting are needed.
  • Modeling and mitigation of high-impact, low-frequency events (including coordinated physical or cyberattack; pandemics; high-altitude electromagnetic pulses; and large-scale geomagnetic disturbances) is especially difficult because few very serious cases have been experienced. Outages from such events could affect tens of millions of people for months. Fundamental research in mathematics and computer science could yield dividends for predicting the consequences of such events and limiting their damage.

Ten years ago, few people could have predicted the current energy environment in the United States—from the concern for global warming, to the accelerated use of solar and wind power, to the country’s near energy independence [My comment: Ha!!!  Guess power engineers can’t be experts in geology as well…]

Physical Structure of the Existing Grid and Current Trends

Economies of scale resulted in most electric energy being supplied by large power plants. Control of the electric grid was centralized through exclusive franchises given to utilities.

However, the grid that was developed in the 20th century, and the incremental improvements made since then, including its underlying analytic foundations, is no longer adequate to completely meet the needs of the 21st century.

The next-generation electric grid must be more flexible and resilient. While fossil fuels will have their place for decades to come, the grid of the future will need to accommodate a wider mix of more intermittent generating sources such as wind and distributed solar photovoltaics. Some customers want more flexibility to choose their electricity supplier or even generate some of their own electricity, in addition to which a digital society requires much higher reliability.

The availability of real-time data from automated distribution networks, smart metering systems, and phasor measurement units (PMUs) holds out the promise of more precise tailoring of the performance of the grid, but only to the extent that such large-scale data can be effectively utilized. Also, the electric grid is increasingly coupled to other infrastructures, including natural gas, water, transportation, and communication. In short, the greatest achievement of the 20th century needs to be reengineered to meet the needs of the 21st century. Achieving this grid of the future will require effort on several fronts.

The purpose of this report is to provide guidance on the longer-term critical areas for research in mathematical and computational sciences that is needed for the next-generation grid.

Excepting islands and some isolated systems, North America is powered by the four interconnections shown in Figure 1.1. Each operates at close to 60 Hz but runs asynchronously with the others. This means that electric energy cannot be directly transmitted between them. It can be transferred between the interconnects by using ac- dc-ac conversion, in which the ac power is first rectified to dc and then inverted back to 60 Hz.

Any electric power system has three major components: the generator that creates the electricity, the load that consumes it, and the wires that move the electricity from the generation to the load. The wires are usually subdivided into two parts: the high- voltage transmission system and the lower-voltage distribution system. A ballpark dividing line between the two is 100 kV. In North America just a handful of voltages are used for transmission (765, 500, 345, 230, 161, 138, and 115 kV). Figure 1.2 shows the U.S. transmission grid. Other countries often use different transmission voltages, such as 400 kV, with the highest commercial voltage transmitted over a 1,000-kV grid in China.

The transmission system is usually networked, so that any particular node in this system (known as a “bus”) will have at least two incident lines. The advantage of a networked system is that loss of any single line would not result in a power outage.

While ac transmission is widely used, the reactance and susceptance of the 50- or 60- Hz lines without compensation or other remediation limit their ability to transfer power long distances overhead (e.g., no farther than 400 miles) and even shorter distances in underground/undersea cables (no farther than 15 miles). The alternative is to use high- voltage dc (HVDC), which eliminates the reactance and susceptance. Operating at up to several hundred kilovolts in cables and up to 800 kV overhead, HVDC can transmit power more than 1,000 miles. One disadvantage of HVDC is the cost associated with the converters to rectify the ac to dc and then invert the dc back to ac. Also, there are challenges in integrating HVDC into the existing ac grid.

Commercial generator voltages are usually relatively low, ranging from perhaps 600 V for a wind turbine to 25 kV for a thermal power plant. Most of these generators are then connected to the high-voltage transmission system through step-up transformers. The high transmission voltages allow power to be transmitted hundreds of miles with low losses— total transmission system losses are perhaps 3 percent in the Eastern Interconnection and 5 percent in the Western Interconnection.

Large-scale interconnects have two significant advantages. The first is reliability. By interconnecting hundreds or thousands of large generators in a network of high-voltage transmission lines, the failure of a single generator or transmission line is usually inconsequential. The second is economic. By being part of an interconnected grid, electric utilities can take advantage of variations in the electric load levels and differing generation costs to buy and sell electricity across the interconnect. This provides incentive to operate the transmission grid so as to maximize the amount of electric power that can be transmitted.

However, large interconnects also have the undesirable side effect that problems in one part of the grid can rapidly propagate across a wide region, resulting in the potential for large-scale blackouts such as occurred in the Eastern Interconnection on August 14, 2003. Hence there is a need to optimally plan and operate what amounts to a giant electric circuit so as to maximize the benefits while minimizing the risks.

Power Grid Time Scales

Anyone considering the study of electric power systems needs to be aware of the wide range in time scales associated with grid modeling and the ramification of this range on the associated techniques for models and analyses. Figure 1.4 presents some of these time scales, with longer term planning extending the figure to the right, out to many years. To quote University of Wisconsin statistician George Box, “Essentially, all models are wrong, but some are useful. However, the approximate nature of the model must always be borne in mind”. Using a model that is useful for one time scale for another time scale might be either needless overkill or downright erroneous.

The actual power grid is never perfectly balanced. Most generators and some of the load are three-phase systems and can be fairly well represented using a balanced three-phase model. While most of the distribution system is three-phase, some of it is single phase, including essentially all of the residential load. While distribution system designers try to balance the number of houses on each phase, the results are never perfect since individual household electricity consumption varies. In addition, while essentially all transmission lines are three phase, there is often some phase imbalance since the inductance and capacitance between the phases are not identical. Still, the amount of phase imbalance in the high-voltage grid is usually less than 5 percent, so a balanced three-phase model is a commonly used approximation.

While an interconnected grid is just one big electric circuit, many of them, including the North American Eastern and Western Interconnections, were once divided into “groups”; at first, each group corresponded to an electric utility. These groups are now known as load-balancing areas (or just “areas”). The transmission lines that join two areas are known as tie lines.

Power transactions between different players (e.g., electric utilities, independent generators) in an interconnection can take from minutes to decades. In a large system such as the Eastern Interconnection, thousands of transactions can be taking place simultaneously, with many of them involving transaction distances of hundreds of miles, each potentially impacting the flows on a large number of transmission lines. This impact is known as loop flow, in that power transactions do not flow along a particular “contract path” but rather can loop through the entire grid.

Day-Ahead Planning and Unit Commitment

In order to operate in the steady state, a power system must have sufficient generation available to at least match the total load plus losses. Furthermore, to satisfy the N – 1 reliability requirement, there must also be sufficient generation reserves so that even if the largest generator in the system were unexpectedly lost, total available generation would still be greater than the load plus losses. However, because the power system load is varying, with strong daily, weekly, and seasonal cycles, except under the highest load conditions there is usually much more generation capacity potentially available than required to meet the load. To save money, unneeded generators are turned off. The process of determining which generators to turn on is known as unit commitment. How quickly generators can be turned on depends on their technology. Some, such as solar PV and wind, would be used provided the sun is shining or the wind blowing, and these are usually operated at their available power output. Hydro and some gas turbines can be available within minutes. Others, such as large coal, combined-cycle, or nuclear plants, can take many hours to start up or shut down and can have large start-up and shutdown costs.

Unit commitment seeks to schedule the generators to minimize the total operating costs over a period of hours to days, using as inputs the forecasted future electric load and the costs associated with operating the generators. Unit commitment constraints are a key reason why there are day-ahead electricity markets. Complications include uncertainly associated with forecasting the electric load, coupled increasingly with uncertainty associated with the availability of renewable electric energy sources such as wind and solar.

The percentage of energy actually provided by a generator relative to the amount it could supply if it were operated continuously at its rated capacity is known as its capacity factor. Capacity factors, which are usually reported monthly or annually, can vary widely, both for individual generators and for different generation technologies. Approximate annual capacity factors are 90% for nuclear, 60% for coal, 48% for natural gas combined cycle, 38% for hydro, 33% for wind, and 27 % for solar PV (EIA, 2015). For some technologies, such as wind and solar, there can be substantial variations in monthly capacity factors as well.

Planning takes place on time scales ranging from perhaps hours in a control room setting, to more than a decade in the case of high-voltage transmission additions. The germane characteristic of the planning process is uncertainty. While the future is always uncertain, recent changes in the grid have made it even more so. Planning was simpler in the days when load growth was fairly predictable and vertically integrated utilities owned and operated their own generation, transmission, and distribution. Transmission and power plant additions could be coordinated with generation additions since both were controlled by the same utility.

As a result of the open transmission access that occurred in the 1990s, there needed to be a functional separation of transmission and generation, although there are still some vertically integrated utilities. Rather than being able to unilaterally plan new generation, a generation queue process is required in which requests for generation interconnections needed to be handled in a nondiscriminatory fashion. The large percentage of generation in the queue that will never actually get built adds uncertainty, since in order to determine the incremental impact of each new generator, an existing generation portfolio needs to be assumed.

FIGURE 1.18 “Duck” curve. SOURCE: Courtesy of California Independent System Operator (California ISO, 2013). Licensed withpermission from the California ISO. Any statements, conclusions, summaries or other commentaries 1.18 expressed herein do not reflect the opinions or endorsement of the California ISO.

Also there is the question of who bears the risk associated with the construction of new generation. More recently, additional uncertainty is the growth in renewable generation such as wind and solar PV and in demand-responsive load.

Distribution Systems

As was mentioned earlier, the portion of the system that ultimately delivers electricity to most customers is known as the distribution system. This section provides a brief background on the distribution system as context for the rest of the report.

Sometimes the distribution system is directly connected to the transmission system, which operates at voltages above, say, 100 kV, and sometimes it is connected to a subtransmission system, operating at voltages of perhaps 69 or 46 kV. At the electrical substation, transformers are used to step down the voltage to the distribution level, with 12.47 kV being the most common in North America (Willis, 2004). These transformers vary greatly in size, from a few MWs in rural locations to more than 100 MW for a large urban substation.

The electricity leaves the substation on three-phase “primary trunk” feeders. While the distribution system can be networked, mostly it is radial. Hence on most feeders the flow of power has been one-way, from the substation to the customers. The number of feeders varies by substation size, from one to two up to more than a dozen. Feeder maximum power capacity can also vary widely from a few MVA to about 30 MVA. Industrial or large commercial customers may be served by dedicated feeders. In other cases smaller “laterals” branch off from the main feeder. Laterals may be either three phase or single phase (such as in rural locations). Most of the main feeders and laterals use overhead conductors on wooden poles, but in urban areas and some residential neighborhoods they are underground. At the customer location the voltage is further reduced by service transformers to the ultimate supply voltage (120/240 for residential customers). Service transformers can be either pole mounted, pad mounted on the ground, or in underground vaults. Typical sizes range from 5 to 5,000 kVA.

A key concern with the distribution system is maintaining adequate voltage levels to the customers. Because the voltage drop along a feeder varies with the power flow on the feeder, various control mechanisms are used. There include LTC transformers at the substation to change the supply voltage to all the substation feeders supplied by the transformer, voltage regulators that can be used to change the voltage for individual feeders (and sometimes even the individual phases), and switched capacitors to provide reactive power compensation.

Another key concern is protection against short circuits. For radial feeders, protection is simpler if the power is always flowing to the customers. Simple protection can be provided by fuses, but a disadvantage of a fuse is that a crew must be called in the event of it tripping. More complex designs using circuit breakers and re-closers allow for remote control, helping to reduce outage times for many customers.

With reduced costs for metering, communication, and control, the distribution system is rapidly being transformed. Distributed generation sources on the feeders, such as PV, mean that power flow may no longer be just one-way. Widely deployed advanced metering infrastructure systems are allowing near-real-time information about customer usage. Automated switching devices are now being widely deployed, allowing the distribution system to be dynamically reconfigured to reduce outage times for many customers. Advanced analytics are now being developed to utilize this information to help improve the distribution reliability and efficiency. Hence the distribution system is now an equal partner with the rest of the grid, with its challenges equally in need of the fundamental research in mathematical and computational sciences being considered in this report.

Organizations and Markets in the Electric Power Industry

Physically, a large-scale grid is ultimately an electrical circuit, joining the loads to the generators. However, it is a shared electrical circuit with many different players utilizing that circuit to meet the diverse needs of electricity consumers. This circuit has a large physical footprint, with transmission lines crisscrossing the continent and having significant economic and societal impacts. Because the grid plays a key role in powering American society, there is a long history of regulating it in the United States at both the state and federal levels. Widespread recognition that reliability of the grid is paramount led to the development of organizational structures playing major roles in how electricity is produced and delivered. Key among these structures is the Federal Energy Regulatory Commission (FERC), the North American Electric Reliability Corporation (NERC), and federal, regional, and state agencies that establish criteria, standards, and constraints.

In addition to regulatory hurdles, rapidly evolving structural elements within the industry, such as demand response, load diversity, different fuel mixes (including huge growth in the amount of renewable generation), and markets that help to determine whether new capacity is needed, all present challenges to building new transmission infrastructure. With these and many other levels of complexity affecting the planning and operation of a reliable power system, the need for strong, comprehensive, and accurate computational systems to analyze vast quantities of data has never been greater.

HISTORY OF FEDERAL AND STATE REGULATION WITH REGIONAL STANDARDS DEVELOPMENT

Since the creation of Edison’s Pearl Street Station in 1882, electric utilities have been highly regulated. This initially occurred at the municipal level, since utilities needed to use city streets to route their wires, necessitating a franchise from the city. In the late 1800s, many states within the United States formed public utility regulatory agencies to regulate railroad, steamboat, and telegraph companies. With the advent of larger electric power utility companies in the early 1900s, state regulatory organizations expanded their scopes to regulate electric power companies.

Regulatory Development

Almost from their inception, electric utilities were viewed as a natural monopoly. Because of the high cost of building distribution systems and the social impacts associated with the need to use public space for the wires, it did not make sense to have multiple companies with multiple sets of wires competing to provide electric service in the same territory. Electric utilities were franchised initially by cities and later (in the United States) by state agencies. An electric utility within a franchised service territory “did it all.” This included owning the increasingly larger generators and the transmission and distribution system wires, and continued all the way to reading the customer’s meters. Customers did not have a choice of electric supplier (many still do not). Local and state regulators were charged with keeping electric service rates just and reasonable within these franchised service territories.

Reliability Organization Development

On June 1, 1968, the electricity industry formed NERC in response to the FPC recommendation and the 1965 blackout, when 30 million people lost power in the northeastern United States and southeastern Canada. In 1973, the utility industry formed the Electric Power Research Institute to pool research and improve reliability. After another blackout occurred in New York City in July 1977, Congress reorganized the FPC into the Federal Energy Regulatory Commission and expanded the organization’s responsibilities to include the enactment of a limited liability provision in federal legislation, allowing the federal government to propose voluntary standards. In 1980, the North American Power Systems Interconnection Committee (known as NAPSIC) became the Operating Committee for NERC, putting the reliability of both planning and operation of the interconnected grid under one organization. In 1996, two major blackouts in the western United States led the members of the Western System Coordinating Council to develop the Reliability Management System. Members voluntarily entered into agreements with the council to pay fines if they violated certain reliability standards. In response to the same two western blackout events, NERC formed a blue-ribbon panel and the Department of Energy formed the Electric System Reliability Task Force. These independent investigations led the two groups to recommend separately the creation of an independent, audited self- regulatory electric reliability organization to develop and enforce reliability standards throughout North America.

Both groups concluded that federal regulation was necessary to ensure the reliability of the North American electric power grid. Following those conclusions, NERC began converting its planning policies, criteria, and guides into reliability standards.

On August 14, 2003, North America experienced its worst blackout to that date, with 50 million people losing power in the Midwestern and northeastern United States and in Ontario, Canada. On August 8, 2005, the Energy Policy Act of 2005 authorized the creation of an electric reliability organization and made reliability standards mandatory and enforceable. On July 20, 2006, FERC certified NERC as the electric reliability organization for the United States. From September through December 2006, NERC signed memoranda of understanding with Ontario, Quebec, Nova Scotia, and the National Energy Board of Canada. Following the execution of these agreements, on January 1, 2007, the North American Electric Reliability Council was renamed the North American Electric Reliability Corporation. Following the establishment of NERC as the electric reliability organization for North America, FERC approved 83 NERC Reliability Standards, representing the first set of legally enforceable standards for the bulk electric power system in the United States.

On April 19, 2007, FERC approved agreements delegating its authority to monitor and enforce compliance with NERC reliability standards in the United States to eight regional entities, with NERC continuing in an oversight role.

North American Regional Entities

There are many characteristic differences in the design and construction of electric power systems across North America that make a one-size- fits-all approach to reliability standards across all of North America difficult to achieve. A key driver for these differences is the diversity of population densities within North America, which affects the electric utility design and construction principles needed to reliably and efficiently provide electric service in each different area. There are eight regional reliability organizations covering the United States, Canada, and a portion of Baja California Norte Mexico (Figure 2.1). The members of these regional entities represent virtually all segments of the electric power industry and work together to develop and enforce reliability standards, while addressing reliability needs specific to each organization.

The largest power flow cases routinely solved now contain at most 100,000 buses…When a contingency occurs, such as a fault on a transmission line or the loss of a generator, the system experiences a “jolt” that results in a mismatch between the mechanical power delivered by the generators and the electric power consumed by the load. The phase angles of the generators relative to one another change owing to power imbalance. If the contingency is sufficiently large it can result in generators losing synchronism with the rest of the system, or in the protection system responding by removing other devices from service, perhaps starting a cascading blackout.

Stability issues have been a part of the power grid since its inception, with Edison having had to deal with hunting oscillations on his steam turbines in 1882, when he first connected them in parallel

In the case of wind farms, the dynamics of the turbine and turbine controls behind the inverter are also important. Because these technologies are developing rapidly and in some cases are manufacturers’ proprietary models, industry standard models with sufficient fidelity for TS lag behind the real-world developments. The development of inverter-based synthetic inertia and synthetic governor response from wind farms, photovoltaic farms, and grid-connected storage systems will create additional modeling complexity.

DS solutions have become more important in recent years as a result of the increased use of renewable sources, which causes concerns about system dynamic performance in terms of frequency and area control error—control area dynamic performance. DS solutions typically rely on IEEE standard models for generator dynamics and simpler models for assumed load dynamics. As with TS solutions, providing accurate models for wind farm dynamics and for proposed synthetic inertial response and governor response is a challenge.

The advent of high penetrations of inverter-based renewable generation (wind farms, solar farms) has led to a requirement for interconnection studies for each new renewable resource to ensure that the new wind farm will not create problems for the transmission system. These interconnection studies begin with load-flow analyses to ensure that the transmission system can accommodate the increased local generation, but then broaden to address issues specific to inverter-based generation, such as analyzing harmonic content and its impact on the balanced three-phase system.

HARMONIC ANALYSIS

The models described in all sections of this report are based on the 60-Hz waveform and the assumption that the waveform is “perfect,” meaning that there are no higher-order harmonics caused by nonlinearities, switching, imperfect machines and transformers, and so on. However, inverters are switching a dc voltage at high frequencies to approximate a sine wave, and this inevitably introduces third, fifth, and higher-order harmonics or non-sine waveforms into the system. The increased use of renewables and also increased inverter-based loads make harmonic analysis—study of the behavior of the higher harmonics—more and more important. While interconnection standards tightly limit the harmonic content that individual inverters may introduce into the system, the presence of multiple inverter-based resources in close proximity (as with a new transmission line to a region having many wind farms) can cause interference effects among the multiple harmonic sources.

Model predictive control (MPC) has been developed extensively in the literature for the AGC problem but has rarely been applied in the field. The minor improvements in the system which are not required by NERC standards today do not justify the increased cost and complexity of the software and the models needed. However, high penetration by renewables, decreased conventional generation available for regulation, the advent of new technologies such as fast short-term storage (flywheels, batteries), and short-term renewable production forecasting may reopen the investigation of MPC for AGC.

MODELING HIGH-IMPACT, LOW-FREQUENCY EVENTS

An emerging area for which some analytic tools and methods are now becoming available is the modeling of what are often referred to as high-impact, low-frequency (HILF) events —that is, events that are statistically unlikely but still plausible and, if they were to occur, could have catastrophic consequences. These include large-scale cyber or physical attacks, pandemics, electromagnetic pulses (EMPs), and geomagnetic disturbances (GMDs). This section focuses on GMDs since over the last several years there has been intense effort in North America to develop standards for assessing the impact of GMDs on the grid.

GMDs, which are caused by coronal mass ejections from the Sun, can impact the power grid by causing low frequency (less than 0.1 Hz) changes in Earth’s magnetic field. These magnetic field changes then cause quasi-dc electric fields, which in turn cause what are known as geo-magnetically induced currents (GICs) to flow in the high-voltage transmission system. The GICs impact the grid by causing saturation in the high-voltage transformers, leading to potentially large harmonics, which in turn result in both greater reactive power consumption and increased heating. It has been known since the 1940s that GMDs have the potential to impact the power grid; a key paper in the early 1980s showed how GMD impacts could be modeled in the power flow.

The two key concerns associated with large GMDs are that (1) the increased reactive power consumption could result in a large-scale blackout and (2) the increased heating could permanently damage a large number of hard-to-replace high-voltage transformers.

Large GMDs are quite rare but could have catastrophic impact. For example, a 500 nT/min storm blacked out Quebec in 1989. Larger storms, with values of up to 5,000 nT/min, occurred in 1859 and 1921, both before the existence of large-scale grids. Since such GMDs can be continental in size, their impact on the grid could be significant, and tools are therefore needed to predict them and to allow utilities to develop mitigation methods.

The mathematical sciences provide essential technology for the design and operation of the power grid. Viewed as an enormous electrical network, the grid’s purpose is to deliver electrical energy from producers to consumers. The physical laws of electricity yield systems of differential equations that describe the time-varying currents and voltages within the system. The North American grid is operated in regimes that maintain the system close to a balanced three-phase, 60-Hz ideal. Conservation of energy is a fundamental constraint: Loads and generation must always balance. This balance is maintained in today’s network primarily by adjusting generation. Generators are switched on and off while their output is regulated continuously to match power demand. Additional constraints come from the limited capacity of transmission lines to deliver power from one location to another.

The character, size, and scope of power flow equations are daunting, but (approximate) solutions must be found to maintain network reliability. From a mathematical perspective, the design and operation of the grid is a two-step process. The first step is to design the system so that it will operate reliably. Here, differential equations models are formulated, numerical methods are used for solving them, and geometric methods are used for interpreting the solutions. The next section, “Dynamical Systems, briefly introduces dynamical systems theory, a branch of mathematics that guides this geometric analysis. Stability is essential, and much of the engineering of the system is directed at ensuring stability and reliability in the face of fluctuating loads, equipment failures, and changing weather conditions. For example, lightning strikes create large, unavoidable disturbances with the potential to abruptly move the system state outside its desired operating regime and to permanently damage parts of the system. Control theory, introduced in a later section, “Control,” is a field that develops devices and algorithms to ensure stability of a system using feedback.

More generation capacity is needed than is required to meet demand, for two reasons: (1) loads fluctuate and can be difficult to accurately predict and (2) the network should be robust in the face of failures of network components.

“Optimization,” describes some of the mathematics and computational methods for optimization that are key aspects of this process. Because these algorithms sit at the center of wholesale electricity markets, they influence financial transactions of hundreds of millions of dollars daily.

The electrical grid operates 24/7, but its physical equipment has a finite lifetime and occasionally fails. Although occasional outages in electric service are expected, an industry goal is to minimize these and limit their extent. Cascading failures that produce widespread blackouts are disruptive and costly. Systematic approaches to risk analysis, described in the section “Risk Analysis, Reliability, Machine Learning, and Statistics,” augment physical monitoring devices to anticipate where failures are likely and to estimate the value of preventive maintenance.

The American Recovery and Reinvestment Act of 2009 funded the construction and deployment of many of the phasor measurement units (PMUs) discussed in Chapter 1, so that by 2015 there are approximately 2,000 production-grade PMUs just in North America that are sampling the grid 30 to 60 times per second . This is producing an unprecedented stream of data, reporting currents and voltages across the power system with far greater temporal resolution (once every 4 to 6 seconds) than was available previously from the existing Supervisory Control and Data Acquisition (SCADA) systems.

The final section, “Uncertainty Quantification,” introduces mathematical methods for quantifying uncertainty. This area of mathematics is largely new, and the committee thinks that it has much to contribute to electric grid operations and planning. There are several kinds of uncertainty that affect efforts to begin merging real-time simulations with real-time measurements. These include the effects of modeling errors and approximations as well as the intrinsic uncertainty inherent in the intermittency of wind and solar generation and unpredictable fluctuations of loads. Efforts to create smart grids in which loads are subject to grid control and to generation introduce additional uncertainty.

Some of the uncertainty associated with the next-generation grid is quite deep, in the sense that there is fundamental disagreement over how to characterize or parameterize uncertainty. This can be the case in situations such as predictions associated with solar or wind power, or risk assessments for high-impact, low-frequency events.

RISK ANALYSIS, RELIABILITY, MACHINE LEARNING, AND STATISTICS

Power systems are composed of physical equipment that needs to function reliably. Many different pieces of equipment could fail on the power system: Generators, transmission lines, transformers, medium-/low-voltage cables, connectors, and other pieces of equipment could each fail, leaving customers without power, increasing risk on the rest of the power system, and possibly leading to an increased risk of cascading failure. The infrastructure of our power system is aging, and it is currently handling loads that are substantially larger than it was designed for. These reliability issues are expected to persist into the foreseeable future, particularly as the power grid continues to be used beyond its design specifications.

Energy theft

One of the most important goals set by governments in the developing world is universal access to reliable energy. While energy theft is not a significant problem in the United States, some utilities cannot provide reliable energy because of rampant theft, which severely depletes their available funding to supply power. Customers steal power by threading cables from powered buildings to unpowered buildings. They also thread cables to bypass meters or tamper with the meters directly, for instance, by pouring honey into them to slow them down. Power companies need to predict which customers are likely to be stealing power and determine who should be examined by inspectors for lack of compliance. Again, each customer can be represented by a vector x that represents the household, and the label y is the result of an inspector’s visit (the customer is either in compliance or not in compliance).

UNCERTAINTY IN WHAT LIES AHEAD

The grid of today is changing with the rapid integration of renewable energy resources such as wind and solar photovoltaic (PV) and the retirement of substantial amounts of coal generation. For example, in early 2015 in the United States, there was installed capacity of about 65 GW of wind and 9 GW of solar PV (out of a total of 1,070 GW), from less than 3 GW of wind and 0.4 GW of solar just 15 years back (EIA, 2009). However, this needs to be placed in context by noting that during the natural gas boom in the early 2000s, almost 100 GW of natural gas capacity was added in just 2 years! And solar thermal, which seemed so promising in 2009, has now been mostly displaced by solar PV because of dropping prices for the PV cells.

Further uncertainty arises because of the greater coupling of the electric grid to other infrastructures such as natural gas, water, and transportation. Finally, specific events can upset the best predictions. An example is the Japanese tsunami in 2011, which (among other factors) dimmed the prospects for a nuclear renaissance in the United States and elsewhere.

Some of the uncertainty currently facing the industry is illustrated in Figure 5.1. The drivers of this uncertainty are manifold: (1) cyber technologies are maturing and are becoming available at reasonable cost—these include sensing, such as phasor measurement units (PMUs), communications, control, and computing; (2) emergence of qualitatively new resources, such as renewable distributed energy resources (DERs)—PVs, wind generation, geothermal, small hydro, biomass, and the like; (3) new quest for large-scale storage—stationary batteries, as well as low-cost storage batteries such as those for use in electric vehicles; (4) changing transmission technologies such as increased use of flexible ac transmission system (FACTS) technologies and/or increased use of high-voltage direct current (HVDC) lines and the integration of other dc technologies; (5) environmental objectives for reducing pollutants; (6) industry reorganization, from fully regulated to service-oriented markets; and (7) the need for basic electrification in developing countries, which affects the priorities of equipment suppliers. Given these drivers, it is hard to predict exactly long-term power grid scenarios.

TECHNOLOGIES THAT WILL ENHANCE THE OBSERVABILITY OF THE GRID

Since the advent of the electric power grid, measurement technologies have been a necessary component of the system for both its protection and its control. For example, measuring the currents flowing in the power system wires and the bus voltages are two key quantities of importance. The currents are measured using current transformers, which convert the magnetic field of the primary circuit to a proportionally smaller current suitable for input to instrumentation. The voltages are measured using potential transformers (PTs), which utilize traditional transformer technology of two windings coiled on a common magnetic core to similarly proportionally reduce the line voltage to a voltage suitable for instrumentation. Through the middle of the 20th century higher voltages and coupled capacitive voltage transformers used capacitors as a voltage divider as a more practical alternative to a PT for extra-high-voltage transmission. Other instruments exploiting either the electric or the magnetic fields have been developed. More recently, optical sensors can convert the voltages and currents as a directly measured quantity

Bringing these measurements to a central location has been possible for many decades. Technologies such as Supervisory Control and Data Acquisition (SCADA) use specialized protocols to transmit the information gathered in substations through analog-to-digital conversion in various sensors that are directly connected to remote terminal units (RTUs). A typical SCADA architecture exchanges both measurement and control information between the front end processor in the control center and the RTUs in the substations. Modern SCADA protocols support reporting of exceptions in addition to more traditional polling approaches. These systems are critical to providing control centers with the information necessary to operate the grid and to providing control signals to the various devices in the grid to support centralized control and optimization of the system.

SCADA systems in use today have two primary limitations. First, they are relatively slow. Most systems poll once every 4 sec, with some of the faster implementations gathering data at a 2-sec scan rate. Second, they are not time synchronized. Often, the data gathered in the substation and passed to the central computer are not timestamped until they are registered into the real-time database at the substation. And as the information is gathered through the polling cycle, sometimes there can be a difference between the pre- and post-event measurements if something happens during the polling cycle itself.

First described in the 1980s, the PMUs mentioned in earlier chapters utilize the precise time available from systems such as the Global Positioning System. The microsecond accuracy available is reasonable for the accurate calculation of phase angles of various power system quantities. More broadly, high-speed time- synchronized measurements are broadly referred to as wide area measurement systems. These underwent significant development beginning in the 1990s and can now provide better measurements of system dynamics with typical data collection rates of 30 or more samples per second. Significant advances in networking technology within the past couple of decades have enabled wide area networks by which utilities can share their high-speed telemetry with each other, enabling organizations to have better wide area situational awareness of the power system. This is addressing one of the key challenges that was identified and formed into a recommendation following the August 14, 2003, blackout

There are several benefits of wide area measurement systems. First, because of the high-speed measurements, dynamic phenomena can be measured. The 0.1- to 5-Hz oscillations that occur on the power system can be compared to simulations of the same events, leading to calibration that can improve the power system models. It is important to have access to accurate measurements corresponding to the time scales of the system. Second, by providing a direct measure of the angle, there can be a real-time correlation between observed angles and potential system stress.

The measurements from PMUs, known as synchrophasors, can be used to manage off-normal conditions such as when an interconnected system breaks into two or more isolated systems, a process known as “islanding.” For example, during Hurricane Gustav, in September 2008, system operators from Entergy (the electric utility company serving the impacted area in Louisiana) were able to keep a portion of the grid that islanded from the rest of the Eastern Interconnection operating after the storm damage took all of the transmission lines out of service, isolating a pocket of generation and load. The isolated area continued to operate by balancing generation and load. The system operators credited synchrophasor technology with allowing them to keep this island operational during the restoration process

Researchers are looking at PMU data to expedite resolution of operating events such as voltage stability and fault location and to quickly diagnose equipment problems such as failing instrument transformers and negative current imbalances. More advanced applications use PMU data as inputs to the special protection systems or remedial action schemes, mentioned in Chapter 3 for triggering preprogrammed automated response to rapidly evolving system conditions.

All telemetry is subject to multiple sources of error. These include but are not limited to measurement calibration, instrumentation problems, loss of communications, and data drop-outs. To overcome these challenges, state estimation, introduced in Chapter 3, is used to compute the real-time state of the system. This is a model-fitting exercise, whereby the available data are used to determine the coefficients of a power system model. A traditional state estimator requires iteration to fit the nonlinear with the available measurements. With an overdetermined set of measurements, the state estimation process helps to identify measurements that are suspected of being inaccurate. Because synchrophasors are time aligned, a new type of linear state estimator has been developed and is now undergoing widespread implementation (Yang and Bose, 2011). The advantage of “cleaning” the measurements through a linear state estimator is that the application is not subject to the data quality errors that can occur with the measurement and communications infrastructure. Additional advances are under way, including distributed state estimation and dynamic state estimation.

One of the more recent challenges has been converting the deluge of new measurements available to a utility, from synchrophasors and other sources, into actionable information. Owing to the many more points of measurement available to a utility from smart meters and various distribution automation technologies, all organizations involved in the operation of the electric power grid are faced with an explosion of data and are grappling with techniques to utilize this information for making better planning and/or operational decisions. Big data analytics is being called on to extract information for enhancing various planning and operational applications.

One challenge includes the improved management of uncertainty. Whether it be the uncertainty associated with estimating future load or generation availability or the uncertainty associated with risks such as extreme weather or other natural or manmade disaster scenarios that could overtake the system, more sophisticated tools for characterizing and managing this uncertainty are needed.

Better tools to provide more accurate forecasting are also needed. One promising approach is through ensemble forecasting methods, in which various forecasting methods are compared with one another and their relative merits used to determine the most likely outcome (with appropriate confidence bounds).

Finally, better decision support tools, including intelligent alarm processors and visualization, are needed to enhance the reliability and effectiveness of the power system operational environment. Better control room automation over the years has provided an unprecedented increase in the effectiveness with which human operators handle complex and rapidly evolving events. During normal and routine situations, the role of the automation is to bring to the operator’s attention events that need to be addressed. However, during emergency situations, the role of the automation is to prioritize actions that need to be taken. Nevertheless, there is still room for improving an operator’s ability to make informed decisions during off-normal and emergency situations. More effective utilization of visualization and decision-support automation is still evolving, and much can be learned by making better use of the social sciences and applying cognitive systems engineering approaches.

TECHNOLOGIES THAT WILL ENHANCE THE CONTROLABILITY OF THE GRID

The value of advanced analytics is only as good as our ability to effect change in the system based on the result of those analytics. Whether it is manual control with a human in the loop or automated control that can act quickly to resolve an issue, effective controls are essential. The power system today relies on the primary, secondary, and tertiary hierarchical control strategies to provide various levels of coordinated control. This coordination is normally achieved through temporal and spatial separation of the various controls that are simultaneously operating. For example, high-speed feedback in the form of proportional-integral- derivative controls operates at power plants to regulate the desired voltage and power output of the generators. Supervisory control in the form of set points (e.g., maintain this voltage and that power output) is received by the power plant from a centralized dispatcher. Systemwide frequency of the interconnected power system is accomplished through automatic generation control, which calculates the desired power output of the generating plants every 4 sec.

Protection schemes that are used to isolate faults rely on local measurements to make fast decisions, supplemented by remote information through communications to improve the accuracy of those decisions. Various teleprotection schemes and technologies have been developed over the past several decades to achieve improved reliability by leveraging available communications technologies. In addition, microprocessor-based protective relays have been able to improve the selectivity and reliability of fault isolation, including advanced features such as fault location. One example is the ability to leverage traveling wave phenomena that provide better accuracy than traditional impedance-based fault location methods

All of these methods described above have one thing in common: judicious use of communications. For historical reasons, when communications were relatively expensive and unreliable, more emphasis was placed on local measurements for protection and control. Communications were used to augment this local decision making. With the advent of more inexpensive (and reliable) communication technologies, such as fiber-optic links installed on transmission towers, new distributed control strategies are beginning to emerge. Additionally, classical control approaches are being challenged by the increased complexity of distribution networks, with more distributed generation, storage, demand response, automatic feeder switching, and other technologies that are dramatically changing the distribution control landscape.  It will soon no longer be possible to control the power system with the control approaches that are in use today (Hawaiian Electric Company, Inc., “Issues and Challenges,” http://www.hawaiianelectric.com/heco/Clean-Energy/Issues-and-Challenges )

Perhaps the biggest challenge underlying the mathematical and computational requirements for this research is the fact that any evolution from today’s operating and control practices will require that newly proposed methods cannot be best-effort methods; instead, a guaranteed performance (theoretical and tested) will be required if any new methods unfamiliar to the system operators are to be deployed. Today there is very little theoretical foundation for mathematical and computational methods capable of meeting provable performance goals over a wide range of operating conditions. More specifically, to arrive at the new mathematical and computational methods needed for the power system, one must recognize that the power system represents a very large-scale, complex, and nonlinear dynamic system with multiple time-varying interdependencies.

EFFECTS OF CLIMATE CHANGE

Many of the assumptions associated with the long-term operation of the electricity infrastructure are based on climatic conditions that prevailed in the past century. Climate changes appear likely to change some of those basic planning assumptions. If policy changes are made to mitigate carbon emissions, parallel changes to the entire power generation infrastructure and the transmission infrastructure connecting our sources of electricity supply will be necessary. This gets into institutional issues such as the availability of capital investment to accommodate these changes, and policies associated with how to recover the costs of the investments. The traditional utility business model would need to be changed to accommodate these developments.

If the average intensity of storms increases, or if weather events become more severe (hotter summers and/or colder winders), basic assumptions about the cost effectiveness of design trade-offs underlying the electric power infrastructure would need to be revisited. Examples of this are the elements for hardening the system against wind or water damage, the degree of redundancy that is included to accommodate extreme events, and the extent to which dual-fueled power plants are required to minimize their dependency on natural gas.

MATHEMATICAL AND COMPUTATIONAL CHALLENGES IN GRID ARCHITECTURES

At present, the system is operated according to practices whose theoretical foundations require reexamination. In one such practice, industry often uses linearized modes in order to overcome nonlinear temporal dynamics. For example, local decentralized control relies on linear controls with constant gain. While these designs are simple and straightforward, they lack the ability to adapt to changing conditions and are only valid over the range of operating conditions that their designers could envision. If the grid is to operate in a stable way over large ranges of disturbances or operating conditions, it will be necessary to introduce a systematic framework for deploying more sensing and control to provide a more adaptive and nonlinear dynamics-based control strategy. Similarly, to overcome nonlinear spatial complexity, the system is often modeled assuming weak interconnections of subsystems with stable and predictable boundary conditions between each, while assuming that only fast controls are localized. Thus, system-level models used in computer applications to support various optimization and decision-support functions generally assume steady-state conditions subject to linear constraints. As power engineers know, sometimes this simplifying assumption is not valid.

Other open mathematical and computational challenges include integrating more nondispatchable generation in the system or other optimized adjustment of devices or control systems. These opportunities for advancing the state of the art for computing technologies could be thought of as “deconstraining technologies”: The nonlinear ac optimal power flow can be used to help reduce the risk of voltage collapse and enable lines to be used within the broader limits; FACTS, HVDC lines, and storage technology can be used for eliminating stability-related line limits; and so on.

The problem of unit commitment and economic dispatch subject to plant ramping rate limits needs to be revisited in light of emerging technologies. It is important to recognize that ramping rate limits result from constraints in the energy conversion process in the power plant. But these are often modeled as static predefined limits that do not take into account the real-time conditions in the actual power generating facility. This is similar to the process that establishes thermal line limits and modifies them to account for voltage and transient stability problems.

As the dynamic modeling, control, and optimization of nonlinear systems mature, it is important to model the actual dynamic process of energy conversion and to design nonlinear primary control of energy conversion for predictable input-output characteristics of the power plants.

In closing, instead of considering stand-alone computational methods for enhancing the performance of the power system, it is necessary to understand end-to-end models and the mathematical assumptions made for modeling different parts of the system and their interactions. The interactions are multi-temporal (dynamics of power plants versus dynamics of the interconnected system, and the role of control); multi-spatial (spanning local to interconnection-wide); and contextual (i.e., performance objectives). It will be necessary to develop a systematic framework for modeling and to define performance objectives and control/optimization of different system elements and their interactions.

MATHEMATICAL & COMPUTATIONAL CHALLENGES IN LOCAL DISTRIBUTION GRID ARCHITECTURES

Today transmission and distribution are often planned and operated as separate systems. The fundamental assumption is that the transmission system will provide a prescribed voltage at the substation, and the distribution system will deliver the power to the individual residential and commercial customers. Historically, there is very little feedback between these separate systems beyond the transmission system operator needing to know the amount of power that needs to be delivered and the distribution system operator knowing what voltage to expect. It has been increasingly recognized, however, that as different types of distributed energy resources, including generation, storage, and responsive demand, are embedded within the distribution network, different dynamic interactions between the transmission and distribution infrastructure may occur. One example is the transient and small-signal stability issues of distributed generation that changes the dynamic nature of the overall power system. It will be important in the future to establish more complete models that include the dynamic interactions between the transmission and distribution systems.

In addition, there is a need for better planning models for designing the sustainable deployment and utilization of distributed energy resources. It is critical to establish such models to support the deployment of nondispatchable generation, such as solar, with other types of distributed energy resources and responsive demand strategies. To illustrate the fundamental lack of modeling and design tools for these highly advanced distribution grids, consider a small, real-world, self-contained electric grid of an island. Today’s sensing and control are primarily placed on controllable conventional power plants since they are considered to be the only controllable components. Shown in Figure 5.2a is the actual grid, comprising a large diesel power plant, small controllable hydro, and wind power plant. Following today’s modeling approaches, this grid gets reduced to a power grid, shown in Figure 5.2b, in which the distributed energy resources are balanced with the load. Moreover, if renewable plants (hydro and wind) are represented as a negative predictable load with superposed disturbances, the entire island is represented as a single dynamic power plant connected to the net island load (Figure 5.2c). (a)

In contrast with today’s local grid modeling, consider the same island grid in which all components are kept 5.2 and modeled (see Figure 5.3). The use of what is known as advanced metering infrastructure (AMI) allows information about the end user electricity usage to be collected on an hourly (or more frequent) basis. Different models are needed to exploit this AMI-enabled information to benefit the operating procedures used by the distribution system operator (DSO) in charge of providing reliable uninterrupted electricity service to the island. Notably, the same grid becomes much more observable and controllable. Designing adequate SCADA architecture for integrating more PVs and wind power generation and ultimately retiring the main fossil power plants requires such new models. Similarly, communication platforms and computing for decision making and automation on the island require models that are capable of supporting provable quality of service and reliability metrics. This is particularly important for operating the island during equipment failures and/or unexpected variations in power produced by the distributed energy resources. The isolated grid must remain resilient and have enough storage or responsive demand to ride through interruptions in available power generation without major disruptions. Full distribution automation also includes reconfiguration and remote switching.

MATHEMATICAL AND COMPUTATIONAL CHALLENGES IN MANAGING INTERDEPENDENCIES BETWEEN THE TRANSMISSION AND LOCAL DISTRIBUTION GRIDS/MICROGRIDS

Based on the preceding description of representative power grid architectures, it is fairly straightforward to recognize that different grid architectures present different mathematical and computational challenges for the existing methods and practices. These new architectures include multi-scale systems that range temporally between the relatively fast transient stability–level dynamics and slower optimization objectives. They consist, as well, of nonlinear dynamical systems, where today’s practice is to utilize linear approximations, and large-scale complexity, where it is difficult to completely model or fully understand all of the nuances that could occur, if only infrequently, during off-normal system conditions but that must be robustly resisted in order to maintain reliable operations at all times.

In all these new architectures the tendency has become to embed sensing/computing/control at a component level. As a result, models of interconnected systems become critical to support communications and information exchange between different industry layers. These major challenges then become a combination of (1) sufficiently accurate models relevant for computing and decision making at different layers of such complex, interconnected grids, (2) sufficiently accurate models for capturing the interdependencies/dynamic interactions, and (3) control theories that can accommodate adaptive and robust distributed, coordinated control. Ultimately, advanced mathematics will be needed to design the computational methods to support various time scales of decision making, whether it be fast automated controls or planning design tools.

The balance between security and financial incentives to keep data confidential on the one hand and open on the other to satisfy researchers’ needs for access to data. The path proposed here is to create synthetic data sets that retain the salient characteristics of confidential data without revealing sensitive information. Because developing ways to do this is in itself a research challenge, the committee gives one example of recent work to produce synthetic networks with statistical properties that match those of the electric grid. Ideally, one would like to have real-time, high- fidelity simulations for the entire grid that could be compared to current observations. However, that hardly seems feasible any time soon. Computer and communications resources are too limited, loads and intermittent generators are unpredictable, and accurate models are lacking for many devices that are part of the grid. The section “Data-Driven Models of the Electric Grid” discusses ways to use the extensive data streams that are increasingly available to construct data-driven simulations that extrapolate recent observations into the future without a complete physical model. Not much work of this sort has yet been done: Most attempts to build data-driven models of the grid have assumed that it is a linear system. However, there are exceptions that look for warning signs of voltage collapse by the monitoring of generator reactive power reserves.

SYNTHETIC DATA FOR FACILITATING THE CREATION, DEVELOPMENT, AND VALIDATION OF NEW POWER SYSTEM TOOLS FOR PLANNING AND OPERATIONS

Data of the right type and fidelity are the bedrock of any operational assessment or long-range planning for today’s electric power system. In operations, assessment through simulation and avoidance of potentially catastrophic events by positioning a system’s steady-state operating point based on that assessment is the mantra that has always led to reliability-constrained economical operation. In the planning regime, simulation again is key to determining the amount and placement of new generation, transmission, and distribution.

The data used to achieve the power industry’s remarkable record of universal availability of electricity has been relatively simple compared to future data needs, which will be characterized by a marked increase in uncertainty, the need to represent new disruptive technologies such as wind, storage, and demand-side management, and an unprecedented diversity in policy directions and decisions marked by a tension between the rights of states and power companies versus federal authority. The future grid is likely to be characterized by a philosophy of command and control rather than assessment and avoidance, which will mean an even greater dependence on getting the data right.

The U.S. electric power system is a critical infrastructure, a term used by the U.S. government to describe assets critical to the functioning of our society and economy. The Patriot Act of 2001 defined critical infrastructure as “systems and assets, whether physical or virtual, so vital to the United States that the incapacity or destruction of such systems and assets would have a debilitating impact on security, national economic security, national public health or safety, or any combination of those matters. Although the electric grid is perhaps the most critical of all the critical infrastructures, much of the data needed by researchers to test and validate new tools, techniques, and hypotheses is not readily available to them because of concerns about revealing too much data about critical infrastructures.

The electric industry perspective is that actual electric grid data are too sensitive to freely disseminate, a claim that is clearly understandable and justifiable. Network data are especially sensitive when they reveal not only the topology (specific electrical connections and their locations) but also the electrical apparatuses present in the network along with their associated parameters. Revealing these data to knowledgeable persons reveals information an operator would need to know to ensure a network is reliable as well as the vulnerabilities an intruder would like to know in order to disrupt the network for nefarious purposes.

There is also some justifiable skepticism that synthesized data might hide important relations that a direct use of the confidential data would reveal. This makes the development of a feedback loop from the synthetic data to the confidential data essential to develop confidence in the products resulting from synthetic data and to ensure their continuous improvement. A natural question is therefore what, if anything, can be done to alter realistic data so as to obtain synthetic data that, while realistic, do not reveal sensitive details.  Hesitation to reveal too much data might also indicate a view of what problems need to be solved that differs from the committee’s view.

It is clear that the availability of realistic data is pressing, critical, and central to enabling the power engineering community to rely on increasingly verifiable scientific assessments. In an age of Big Data such assessments may become ever more pressing, perhaps even mandatory, for effective decision making.

Recommendation: Given the critical infrastructure nature of the electric grid and the critical need for developing advanced mathematical and computational tools and techniques that rely on realistic data for testing and validating those tools and techniques, the power research community, with government and industry support, should vigorously address ways to create, validate, and adopt synthetic data and make them freely available to the broader research community.

Using recent advances in network analysis and graph theory, many researchers have applied centrality measures to complex networks in order to study network properties and to identify the most important elements of a network. Real-world power grids experience changes continuously. The most dramatic evolution of the electric grid in the coming 10 to 20 years will possibly be seen from both the generation side and the smart grid demand side. Evolving random topology grid models would be significantly enhanced and improved and made even more useful if, among other things, realistic generation and load settings with dynamic evolution features, which can truly reflect the generation and ongoing load changes, could be added.

As conditions vary, set points of controllable equipment are adjusted by combining an operator’s insights about the grid response and the results of optimization given an assumed forecast. If done right, system operators do not have to interfere with the automation: Their main task is to schedule set points given the forecasts. Fast dynamic transitions between new equilibria are stabilized and regulated by the primary controllers. Beyond this primary control of individual machines, there are two qualitatively different approaches to ensuring stable and acceptable dynamics in the changing power industry:

  • The first approach meets this goal of ensuring stable and acceptable dynamics via coordinated action of the system operators. Planners will attempt to embed sensing, communications, and controllers sufficient to guarantee system stability for the range of operating conditions of interest. This is an ambitious goal that faces theoretical challenges. For example, maintaining controllability and observability with increased numbers of sensors and controllers is a challenge given the current state of primary control. It seems feasible that current technologies will allow meeting performance objectives, which are now constrained by requirements for synchronization and voltage stabilization/regulation. As mechanically switched transmission and distribution equipment (phase angle regulators, online tap changers, and so forth) is replaced by electronic devices—flexible ac transmission systems, high- voltage dc transmission lines, and the like—the complexity of the control infrastructure for provable performance in a top-down manner is likely to become overwhelming. In particular, variable-speed drives for efficient utilization of power are likely to interfere with the natural grid response and the existing control of generators, transmission, and distribution equipment.
  • The second approach is the design of distributed intelligent Balancing Authorities (iBAs) and protocols/ standards for their interactions. As discussed in Chapter 1, automatic generation control is a powerful automated control scheme and, at the same time, one of the simplest. Each area is responsible for coordinating its resources so that its level frequency is regulated within acceptable limits and deviations from the scheduled net power exchange with the neighboring control areas are regulated accordingly. A closer look into this scheme reveals that it is intended to regulate frequency in response to relatively slow disturbances, under the assumption that primary control of power plants has done its job in stabilizing the transients.

It is possible to generalize this notion into something that may be referred to as an iBA, which has full responsibility for stabilization and regulation of its own area. Microgrids, distribution networks, portfolios (aggregates) of consumers, portfolios of renewable resources, and storage are examples of such areas. It is up to the grid users to select or form an iBA so that it meets stability and regulation objectives on behalf of its members. The operator of a microgrid is responsible for the distributed energy resources belonging to an area: The microgrid must have sufficient sensing, communications, and control so that it meets the performance standard. This is much more doable in a bottom-up way, and it would resemble the enormously successful Transmission Control Protocol/Internet Protocol (TCP/IP). Many open questions remain about creating a more streamlined approach to ensuring that the emerging grid has acceptable dynamics. For example, there is a need for algorithms to support iBAs by assessing how to change control logic and communications of the existing controllers to integrate new grid members.

The contrast between these two approaches reflects the tension between centralized and distributed control. Because experiments cannot be performed regularly on the entire grid, computer models and simulations are used to test different potential architectures. One goal is to design the system to be very, very reliable to minimize both the number and size of power outages. The problem of cascading failures looms large here. The large blackouts across the northeastern United States in 1965, 2003, and 2007 are historical reminders that this is a real problem. Since protective devices are designed to disconnect buses of the transmission network in the event of large fault currents, an event at one bus affects others, especially those connected directly to the first bus. If this disturbance is large enough, it may trigger additional faults, which in turn can trigger still more. The N – 1 stability mandate has been the main strategy to ensure that this does not happen, but it has not been sufficient as a safeguard against cascading failures. The hierarchy of control for the future grid should include barriers that limit the spread of outages to small regions.

PHYSICS-BASED SIMULATIONS FOR THE GRID

How can mathematics research best contribute to simulation technology for the grid? Data-driven models, described in “Data-Driven Models of the Electric Grid” earlier in this chapter, begin with a functioning network. Moreover, they cannot address questions of how the grid will respond when subjected to conditions that have never been encountered. What will be the effects of installing new equipment? Will the control systems be capable of maintaining stability when steam-driven generators are replaced by intermittent renewable energy resources? Simulation of physics-based models is the primary means for answering such questions, and dynamical systems theory provides a conceptual framework for understanding the time-dependent behavior of these models and the real grid. Simulation is an essential tool for grid planning, and its design requires extensive control. In normal steady-state operating conditions, these simulations may fade into the background, replaced by a focus on optimization that incorporates constraints based on the time-dependent analysis. Within power systems engineering, this type of modeling and simulation includes TS analysis.

Creating Hybrid Data/Human Expert Systems for Operations

When a serious problem occurs on the power grid, operators might be overloaded with alarms, and it is not always clear what the highest priority action items should be. For example, a major disturbance could generate thousands of alarms. Certainly much work has been done over the years in helping operators handle these alarms and more generally maintain situation awareness, with Panteli and Kirschen (2015) providing a good overview of past work and the current challenges. However, still more work needs to be done. The operators need to quickly find the root cause of the alarms. Sometimes “expert systems” are used, whereby experts write down a list of handcrafted rules for the operators to follow.

CHALLENGES IN MODELING THE ELECTRIC GRID’S COUPLING WITH OTHER INFRASTRUCTURES

A reliable electric grid is crucial to modern society in part because it is crucial to so many other critical infrastructures. These include natural gas, water, oil, telecommunications, transportation, emergency services, and banking and finance (Rinaldi et al., 2001). Without a reliable grid many of these other infrastructures would degrade, if not immediately then within hours or days as their backup generators fail or run out of fuel. However, this coupling goes both ways, with the reliable operation of the grid dependent on just about every other infrastructure, with the strength of this interdependency often increasing.

Rinaldi, S.M et al. December 2001. Identifying, understanding and analyzing critical infrastructure interdependencies. IEEE Control Systems Magazine, pp. 11-25

For example, PNNL (2015) gives a quite comprehensive coverage of the couplings between the grid and the information and communication technology (ICT) infrastructure. The coupling between the grid and natural gas systems, including requirements for joint expansion planning, is presented in Borraz-Sanchez et al. (2016). The interdependencies between the electric and water infrastructures are shown in Sanders (2014) with a case study for the Texas grid presented in Stillwell et al. (2011). While some of these couplings are quite obvious, others are not, such as interrelationships between the grid and health care systems in considering the vulnerability of the grid to pandemics (NERC, 2010). The rapidly growing coupling between electricity and electric vehicle transportation is presented in Kelly et al. (2015).

PNNL. August 2015. The Emerging Interdependence of the Electric Power Grid and Information and Communication Technology. Pacific Northwest National Laboratory PNNL-24643.

Models that represent coupling between the grid and gas, water, transportation, or communication will almost certainly include hierarchical structures characterized by a mixture of discrete and continuous variables whose behavior follows nonlinear, nonconvex functions at widely varying time scales. This implies that new approaches for effectively modeling nonlinearities, formulating nonconvex optimization problems, and defining convex subproblems would be immediately relevant when combining different infrastructures.

References

Deign J (2020) Research Finds Unknown ‘Critical Points’ in European Grids Finding from Depsys highlights need for network intelligence to speed the energy transition. Greentechmedia.com

Lovejoy B (2022) Global chip shortage: Engineer shortfall is the next big problem.  https://9to5mac.com/2022/01/03/global-chip-shortage-engineer-shortfall/

Makansi J (2007) Lights Out: The Electricity Crisis, the Global Economy, and What It Means To You.

NAERC (2006) Summary of 2006 Long-Term Reliability Assessment: The Reliability of the Bulk Power Systems In North America. North American Electric Reliability Council.

Sanger DE, Perlroth N, Barnes JE (2021) As Understanding of Russian Hacking Grows, So Does Alarm. New York Times.

Posted in Electric Grid & EMP Electromagnetic Pulse, Grid instability, Renewable Integration, Smart Grid | Tagged , , , , , , | Comments Off on Wanted: Math geniuses and power engineers to make a renewable grid possible

Reducing pesticides with crop diversity

Preface. Pesticides are the main cause of the insect apocalypse, which reverberates up the food chain, leading to loss of biodiversity and extinction. And pesticides are made out of oil, which probably peaked globally in 2018, and pesticides only last 5 years on average before pests develop resistance.  So we have to get rid of them — it’s past time we looked for alternatives, especially since they will inevitably stop working or being manufactured as petroleum grows scarce.  And yet Rachel Carson warned us in 1962 in her book Silent Spring about this, and six decades later we’ve done little to solve it.

About 400 different pesticides are being used in the U.S., and 150 of them are considered hazardous to human health according to the World Health Organization. The U.S. Geological Survey data showed estimated that at least one billion pounds of agricultural pesticides were used in 2017. Of that, about 60%—or more than 645 million pounds—of the pesticides were hazardous to human health, according to the WHO’s data (Acharya 2020).

Another method of reducing pesticides, fertilizer, and water is intercropping — the simultaneous cultivation of multiple crops on a single plot of land, which can significantly increase the yield. Farmers have applied intercropping for as long as we can remember. Intercropping appears to give a 16-29% larger yield per unit area than monocultures in  under the same circumstances, while using 19-36% less fertilizer (Li et al 2020).

Alice Friedemann  www.energyskeptic.com  Author of Life After Fossil Fuels: A Reality Check on Alternative Energy; When Trucks Stop Running: Energy and the Future of Transportation”, Barriers to Making Algal Biofuels, & “Crunch! Whole Grain Artisan Chips and Crackers”.  Women in ecology  Podcasts: WGBH, Crazy Town, Collapse Chronicles, Derrick Jensen, Practical Prepping, Kunstler 253 &278, Peak Prosperity,  Index of best energyskeptic posts

***

Larsen AE et al (2020) Impact of local and landscape complexity on the stability of field-level pest control. Nature Sustainability.

Larsen and Noack scoured Kern county records from 2005 through 2017 focusing on factors such as field size, as well as the amount and diversity of croplands. What they found was that increasing cropland with larger fields generally increases the amount and variety of pesticides applied, while crop diversity has the opposite effect.

As field size increases, the area gets larger more quickly than the perimeter, while smaller fields have proportionally larger perimeters. And a larger perimeter may mean more spillover from nearby predators like birds, spiders and ladybugs that eat agricultural pests.

Smaller fields also create more peripheral habitat for predators and competitors that can keep pest populations under control. And since the center of a smaller field is closer to the edge, the benefits of peripheral land in reducing pests extends proportionally farther into the small fields.

Landscapes with diverse crops and land covers also correlated with reduced pesticide variability and overall use. Different crops in close proximity foster a variety of different pests. Though this may sound bad, it actually means that no single species will be able to multiply unimpeded.

When crops are grown over a wide area, it’s hard to stop a large outbreak of a pest in an area of almost unlimited food resources.

References

Acharya P (2020) The United States still uses many pesticides banned in other countries. The Counter

Larsen AE et al (2017) Identifying the landscape drivers of agricultural insecticide use leveraging evidence from 100,000 fields. PNAS.  www.pnas.org/cgi/doi/10.1073/pnas.1620674114

Li C et al (2020) Syndromes of production in intercropping impact yield gains. Nature Plants.  Simpler explanation in phys.org here

Posted in Biodiversity Loss, Farming & Ranching, Pesticides | Tagged , , | Comments Off on Reducing pesticides with crop diversity

Coming Food Crises from Drought

Preface. As climate change heats the planet, and groundwater depletes from aquifers that won’t be recharged until after the next ice age, it’s clear that food crises from drought (and many other problems) will be upon us soon. As long as we have diesel fuel, food supplies can be brought in from other parts of the country and world, but at some point of oil decline and localization, drought will be much more of a problem than it is now.

Alice Friedemann   www.energyskeptic.com  author of “Life After Fossil Fuels: A Reality Check on Alternative Energy”, 2021, Springer; “When Trucks Stop Running: Energy and the Future of Transportation”, 2015, Springer, Barriers to Making Algal Biofuels, and “Crunch! Whole Grain Artisan Chips and Crackers”. Podcasts: Collapse Chronicles, Derrick Jensen, Practical Prepping, KunstlerCast 253, KunstlerCast278, Peak Prosperity , XX2 report

***

Huning LS, AghaKouchak A (2020) Global snow drought hot spots and characteristics. PNAS 117: 19753-19759.

Researchers studied the effects of snow draughts on water supplies world-wide from 1980 to 2018. Snowmelt provides freshwater to more than a billion people, one sixth of the world’s population. Water from melting snow irrigates the crops of farming regions including areas that seldom if ever receive any snow during the winter, such as California’s Central Valley. Snow-water deficits have increased 28% in the Western U.S. during the second half of the study period, and to a lesser extent, Eastern Russia & Europe.

Lobell DB, Deines JM, Di Tommaso S (2020) Changes in the drought sensitivity of US maize yields. Nature Food.

The U.S. Corn Belt’s high crop yields conceal a growing vulnerability. Although yields have increased overall due to new technologies and management approaches, crops are becoming significantly more sensitive to drought conditions.

When corn crops succumb to drought, this not only affects food prices and availability, but also ethanol production. One of the reasons crops are becoming more susceptible to drought is that soils are able to hold less water than in the past.

Nabhan GP (2013) Our Coming Food Crisis. New York Times.

Long stretches of triple-digit days out West are getting more common and that will threaten our food supply.  2012 was the hottest year in American history. Half of all counties in the United States were declared national drought disaster areas. 90% of these counties were doubly devastated by heat waves as well.

The 17 Western states account for nearly 40% of farm income, and current and future heat waves will reduce the amount of food produced. On cause is that overheated crops need a lot more water.  After several years of drought both surface and groundwater supplies have diminished and the energy costs have gone way up because water needs to be pumped up from much deeper levels.

This means food costs are going to go up at a time when 1 in 6 people are already on food stamps and having a hard time making ends meet.

Strategies to cope have been blocked from being added to the current farm bill, such as promoting locally produced compost to hold moisture in the soil of row crops and orchards.  This also adds carbon and increases yields. Increasing organic matter from 1 to 5% can increase water storage in rot zones from 33 pounds to 195 pounds per cubic meter.  Cities could provide enormous amounts of compost, but most green waste ends up in landfill and generates the greenhouse gas methane.

Posted in Drought | Tagged , | Comments Off on Coming Food Crises from Drought

Riskiest counties in the U.S.

Preface. I suppose that if you’re trying to figure out where to survive peak oil, the hazards might be something to consider. This isn’t the greatest tool in the world. To use it, select a county in the Counties tab to see what the risks are, they include Avalanche, Coastal Flooding, Cold Wave, Drought, Earthquake, Hail, Heat wave, Hurricane, Ice Storm, Landslide, Lightning, Riverine flooding, Strong wind, Tornado, Tsunami, Volcanic Activity, Wildfire, Winter Weather.

Alice Friedemann   www.energyskeptic.com  author of “Life After Fossil Fuels: A Reality Check on Alternative Energy”, 2021, Springer; “When Trucks Stop Running: Energy and the Future of Transportation”, 2015, Springer, Barriers to Making Algal Biofuels, and “Crunch! Whole Grain Artisan Chips and Crackers”. Podcasts: Collapse Chronicles, Derrick Jensen, Practical Prepping, KunstlerCast 253, KunstlerCast278, Peak Prosperity , XX2 report

***

The National Risk Index.

The Federal Emergency Management Agency has calculated the risk for every county in America for 18 types of natural disasters, such as earthquakes, hurricanes, tornadoes, floods, volcanoes and even tsunamis. And of the more than 3,000 counties, Los Angeles County has the highest ranking in the National Risk Index.

FEMA’s other 10 riskiest places are three counties in the New York City area — Bronx, New York County (Manhattan) and Kings County (Brooklyn) — along with Miami, Philadelphia, Dallas, St. Louis and Riverside and San Bernardino counties in California.

Loudoun County, a Washington, D.C. outer suburb, has the lowest risk of any county, according to FEMA. 

FEMA’s index scores how often disasters strike, how many people and how much property are in harm’s way, how vulnerable the population is socially and how well the area is able to bounce back. And that results in a high risk assessment for big cities with lots of poor people and expensive property that are ill-prepared to be hit by once-in-a-generation disasters.

While the rankings may seem “counterintuitive,” the degree of risk isn’t just how often a type of natural disaster strikes a place, but how bad the toll would be, according to FEMA’s Mike Grimm.

Oklahoma is twice as likely to get tornadoes as New York City, but the damage potential is much higher in New York because there are 20 times the people and nearly 20 times the property value at risk, FEMA officials said.

“It’s that risk perception that it won’t happen to me,” Grimm said. “Just because I haven’t seen it in my lifetime doesn’t mean it won’t happen.”

That sort of denial is especially true with frequent and costly flooding, he said, and is the reason only 4% of the population has federal flood insurance when about one-third may need it.

Disaster experts say people have to think about the big disaster that happens only a few times a lifetime at most, but is devastating when it hits — Hurricane KatrinaSuperstorm Sandy, the 2011 super outbreak of tornadoes, the 1906 San Francisco earthquake or a pandemic.

Posted in Where to Be or Not to Be | Tagged , | Comments Off on Riskiest counties in the U.S.

Material and other limits to scaling wind up to 24 GW by 2050

Preface. Here are just a few of the many important points made in this excellent paper:

  1. Research showing no constraints on the materials needed to build wind turbines “dismiss potential physical constraints and issues with natural resource supply, and do not consider the growth rates of the individual technologies needed or how the energy systems are to be sustained over longer time frames”
  2. Wind turbines and solar panels depend on scarce minerals (i.e. rare earth)
  3. A fast growth of renewables would add new fossil fuel demand to current demand during a transition period

And ramping up wind turbines given their 25 year lifespan is fraught with difficulties:

“This study investigates the implications of fulfilling these growth patterns by letting wind energy grow exponentially reaching 19 TW by 2030 and 24 TW by 2050. These capacities are then assumed to be sustained to the year 2100. Laxson et al. (2006) describes a sustained manufacturing model, where installed capacity of wind energy grows to reach 1%, 20% and 30% of U.S. electricity demand by 2020 or 2030. After 25 years the capacity installed 25 years earlier are replaced (repowered). The need to replace the capacity after the end of the service life of the wind turbines affects the desired manufacturing capacity of the wind industry. If the installed capacity of wind is to be sustained over a longer time frame, an industry capable of replacing the capacity taken out of use must exist. If the growth trajectory is too slow to reach a manufacturing capacity large enough to replace the old turbines in the future, the actual wind capacity in use can in fact see a drop after the initial goal is reached. On the other hand, if the manufacturing capacity is expanded too fast, the demand for new turbines will drop and leave manufacturing capacity idle.

And then the authors offer evidence that in real life, wind turbine lifespan is 20 years, not 25 or 30 as some scientists have assumed.”

Hoffs C (2022) How are Wind Turbines made? Cleantechnica.com (see videos, illustrations)

Land: Once developers select a site for a land-based turbine tower, they level the ground and lay down a concrete foundation, which can use as much as 600–1000 tons of concrete and 165 tons of steel. The average US tower height (or “hub” height, measured from the base to the center of the blades) in 2021 was 300 feet, 66% higher than in 1999. By 2035, the average onshore American wind turbine tower is projected to reach about 500 feet. When ready to be erected, a crane pulls the tower upright.

OFFSHORE:  Installing an offshore wind turbine foundation, on the other hand, is a different story. Honestly, it is nothing short of epic. Huge ships leave port and arrive at a site that’s up to 200 feet deep. The ships then plant down legs to root it to the seabed and elevate the ship out of the water. Next, an onboard crane lowers a steel tower “monopile” (or, depending on the site, a different anchoring structure such as a jacket, tripod, or gravity base) into the water and drills it into the sea floor. A crane places a transition piece above the monopile or anchored foundation, on which the tower will be secured with cables. For deeper floating offshore wind turbines, extending down 200 feet or more, wind turbines are placed atop buoyant substructures at port facilities and towed to their location where mooring lines connect the structure to anchors rooted into the seabed. For offshore wind, large boats transport the pre-assembled steel tower to the foundation. Crane operators on the ship’s deck remotely guide the towers into position on top of the transition piece.

Related posts: https://energyskeptic.com/category/energy/wind/


Alice Friedemann  www.energyskeptic.com  Author of Life After Fossil Fuels: A Reality Check on Alternative Energy; When Trucks Stop Running: Energy and the Future of Transportation”, Barriers to Making Algal Biofuels, & “Crunch! Whole Grain Artisan Chips and Crackers”.  Women in ecology  Podcasts: WGBH, Planet: Critical, Crazy Town, Collapse Chronicles, Derrick Jensen, Practical Prepping, Kunstler 253 &278, Peak Prosperity,  Index of best energyskeptic posts

***

Davidsson S, Grandell L, Wachtmeister H, et al (2014) Growth curves and sustained commissioning modelling of renewable energy: Investigating resource constraints for wind energy. Energy Policy 73: 767–776 http://dx.doi.org/10.1016/j.enpol.2014.05.003

Although the wind itself is a type of renewable energy, the wind turbines converting the kinetic energy in the wind into electrical energy are not renewable and are built using a wide range of non-renewable resources.

Several recent studies have proposed fast transitions to energy systems based on renewable energy technology. Many of them dismiss potential physical constraints and issues with natural resource supply, and do not consider the growth rates of the individual technologies needed or how the energy systems are to be sustained over longer time frames. A case study is presented modelling potential growth rates of the wind energy required to reach installed capacities proposed in other studies, taking into account the expected service life of wind turbines.

The annual installation and related resource requirements to reach proposed wind capacity are quantified and it is concluded that these factors should be considered when assessing the feasibility, and even the sustainability, of fast energy transitions. Even a sustained commissioning scenario would require significant resource flows, for the transition as well as for sustaining the system, indefinitely. Recent studies that claim there are no potential natural resource barriers or other physical constraints to fast transitions to renewable energy appear inadequate in ruling out these concerns.

A few recent peer reviewed studies stand out by proposing future energy systems almost completely based on energy from the wind and the sun, claimed to be achievable as soon as the year 2050, or even more rapidly by 2030 (García-Olivares et al., 2012; Jacobson and Delucchi, 2009; Kleijn and van der Voet, 2010).

Substituting the entire current energy system based on fossil fuels with renewable energy technologies involves up-scaling a disparate set of small scale industries, and the timeframe to do this within only a couple of decades, can appear optimistic. The implications of the fast growth of the renewable energy technologies needed to do this are often not adequately addressed in the studies proposing future energy systems based on renewable energy. The question of how these energy systems are then to be sustained over a longer time scale are usually not considered.

This study aims to add the perspectives of time and scale to evaluating the feasibility of fast energy transitions by taking account of annual growth rates needed to reach proposed future energy systems as well as investigating how an energy system based on renewable energy technologies could be sustained in the long run. This is mainly done by modelling growth patterns needed to reach the installed capacities of wind energy proposed in other studies, taking account of the life expectancies and need for replacement of technology, using wind energy as an example. The requirement of natural resources for the construction of wind energy is quantified on an annual basis to examine the impact on views of potential material constraints.

The growth of renewable energy technologies needed for an energy transition must inevitably come with the growth of an industry capable of manufacturing and installing that technology, capital to finance these investments, as well as an increased demand for certain natural resources.

Renewable energy technologies such as wind and solar energy are more metal intensive than current energy sources and a transition to renewable energy would increase demand for many different metals (Kleijn et al., 2011). Several different critical metals have been identified as potential bottlenecks in the deployment of “low-carbon energy technologies” (Moss et al., 2011). It has also been argued that a shift to an energy system based on renewable energy would inevitably be largely driven by fossil fuels, and a fast growth of renewables would actually add new fossil fuel demand to current demand during a transition period (Moriarty and Honnery, 2009).

The concept of “energy return on investment” (EROI) appears lower for renewable energy technologies than many conventional fossil fuels we currently rely on for our energy supply (Hall et al., 2013). Concerning solar photovoltaics (PV), it has been suggested that high energy input for the production of crystalline silicon solar cells could be a constraint for the growth of this technology, while current thin film technologies could never reach significant production levels due to the use of scarce materials (Tao et al., 2011). Dale and Benson (2013) even claim that the solar PV industry has not yet paid back any net energy to society, partly due to its high relative growth rates, and concludes that both the timing and magnitude of energy inputs and outputs are important factors in determining an energy balance for the solar industry.

Others raise issues with the variable production of electrical energy from wind and solar energy as well as the large amount of capital needed for investment in new energy production as potential constraints on this development (Trainer, 2013, 2012).

Installed wind capacity Jacobson and Delucchi (2009) describe an energy system consisting of 51% wind energy and 40% solar energy that is “technically possible” to achieve before 2030. This scenario is further elaborated on in Jacobson and Delucchi (2011) and Delucchi and Jacobson (2011), where the time frame is postponed due to difficulties in implementing the necessary policies by 2030, but it is still said to be technically feasible to achieve by 2030. Kleijn and Van der Voet (2010) present a similar scenario, with slightly more wind energy but many times more solar PV, since the total energy demand is assumed to be much larger. García-Olivares et al. (2012) propose an energy mix similar to the Jacobson and Delucchi (2009) scenario, but state that solar PV is unlikely to be able to reach these levels due to constraints induced by scarce materials used for solar PV technology and propose using concentrating solar power (CSP) instead. Table 1 summarizes the main features of these three studies as well as the current situation as of 2012.

The studies described in Table 1 all propose energy systems completely based on renewable energy technology, with wind and solar energy making up almost the entire global energy supply by 2030 or 2050. Although important differences occur between the different studies, some interesting similarities exist. While the solar energy contributions vary greatly both in size and technologies chosen, the assumed contribution from wind is very similar between the studies, with suggested installed capacities ranging from 18 to 24 TW. All three studies discuss potential constraints caused by natural resources and conclude that this factor will likely not constrain the development towards the proposed energy future. The growth patterns needed for the individual technologies is not given much attention, and when growth rates of technologies are mentioned it appears as if exponential growth rates are assumed, or at least deemed feasible.

This study investigates the implications of fulfilling these growth patterns by letting wind energy grow exponentially reaching 19 TW by 2030 and 24 TW by 2050. Although not specified in the studies, these capacities are then assumed to be sustained to the year 2100, to be able to investigate the implications of sustaining this capacity.

Laxson et al. (2006) describes a sustained manufacturing model, where installed capacity of wind energy grows to reach 1%, 20% and 30% of U.S. electricity demand by 2020 or 2030. After 25 years the capacity installed 25 years earlier are replaced (repowered). The need to replace the capacity after the end of the service life of the wind turbines affects the desired manufacturing capacity of the wind industry. If the installed capacity of wind is to be sustained over a longer time frame, an industry capable of replacing the capacity taken out of use must exist. If the growth trajectory is too slow to reach a manufacturing capacity large enough to replace the old turbines in the future, the actual wind capacity in use can in fact see a drop after the initial goal is reached. On the other hand, if the manufacturing capacity is expanded too fast, the demand for new turbines will drop and leave manufacturing capacity idle.

The sustained commissioning model in this study builds upon the ideas proposed by Laxson et al. (2006), with some modifications. The use of the word commissioning instead of manufacturing is proposed to highlight the fact that taking wind capacity into use is not only about physically producing wind turbines, but requires an entire industry of getting the right materials, manufacturing parts, permission to install wind farms, assembling and installing turbines, as well as getting the wind farms connected to an electrical grid capable of transporting the power to consumers.

Höök et al. (2012) reviewed historical growth rates of energy output from the six energy resources considered as global energy systems, defined as energy sources contributing over 100 Mtoe, or supplying about 1% of global annual primary energy. These include oil, gas, coal, biomass, hydropower and nuclear power. Generic growth behavior for these six energy systems was found, with growth rates decreasing as the energy output increased. It is stated that none of the fossil fuels have grown at more than 10% over longer time periods, and not even the “oil boom” showed sustained growth rates of more than around 7%. The growth rates for nuclear and hydropower show similar behavior as those seen for fossil fuels, despite fundamental differences in technology, suggesting that similar growth patterns could be expected for other energy technologies as well.

Technology can be taken out of use for several different reasons, making the assumption of expected service life somewhat difficult to estimate. However, it must be considered certain that they will not last forever. In the case of wind turbines, the end-of-life can be reached due to technical failure or fatigue, or when the turbine no longer satisfies the need or expectations of the user, when a wind farm is either decommissioned or repowered, where the individual turbines are replaced with new ones (Ortegon et al., 2013). The assumed service life will have a significant impact on annual installations needed in the models in this study.

The question then is what a reasonable estimate of service life for a wind turbine is. Ortegon et al. (2013) state that the designed life expectancy for a wind turbine is 20-30 years, but assumes a service life of 20 years. Laxson et al. (2006) state that the design service life of a wind farm is 20 to 30 years but use a 25 year service life in the models. Within the life cycle assessment (LCA) community it appears to be somewhat of a standard to assume a 20 year service life. Kubiszewski et al. (2010) presents a meta-analysis of 119 different turbines from 50 different analyses between 1977 and 2006, where a vast majority assumed a 20-year life span. Davidsson et al. (2012) looked at ten more recent LCAs of wind turbines and found similar tendencies. Dolan and Heath (2012) reviewed and harmonized 72 LCAs on wind turbines and concluded that 20 years was the most commonly cited lifetime estimate as well as a common design life for modern wind turbines. Basically, a 20 year service life appears to be the most reasonable assumption based on current literature.

One of the first countries to build large quantities of wind energy was Denmark, and data on both commissioned and decommissioned facilities exist all the way back to 1977 (Energistyrelsen, 2014). Using the assumption that the wind turbines will be in use for 20 years it is then possible to compare how much capacity that should be decommissioned 20 years after its construction with the actual numbers on decommissioning. Figure 1 shows these theoretical numbers on decommissioning as well as actual historical decommissioned capacity. Although they do not correlate exactly, especially since a large amount of turbines was taken out of use in the year 2002, they appear to follow a similar pattern, and the total cumulative decommissioned capacity of 431 MW comes remarkably close to the theoretical number of 468 MW.

Including an assumption on service life for a technology can have large impacts on the annual installation need for the growth period, but also for the energy system in a longer time frame. Looking at a scenario for 2050, assuming a 20 year service live of wind turbines, only turbines built after 2030 will even be in use at that time. Turbines built between now and 2030 will only be in service during the transition and for scaling up the industry. After 2050 the old turbines will need to be replaced, so an industry capable of sustaining this level of production needs to be in place.

Wind turbines can roughly be divided into two categories: geared turbines and gearless turbines. The turbines can operate with either a fixed speed or limited variable speed concept, both cases using a three-stage gearbox. Turbines operating with variable speed can use either a gearbox or a direct drive train concept. Some concepts use significant amounts of scarce materials in their design. For instance, permanent magnet synchronous generators (PMSG), which is a widely used generator concept with a direct drive train, uses significant amounts of rare earth elements (REEs). These generators often operate without gears, which can be beneficial since the gearbox often needs maintenance. There are other direct drive concepts that do not use these materials, such as induction generators and exited synchronous generators (EESG). The need for rare earth elements is estimated to be 160-200 kg/MW for generators used in direct drive concepts, while PMSG designs used in combination with a gearbox the need for REE is reduced to about 30 kg/MW (Buchert, 2011).

As a constraint for a total expansion of wind energy on a global scale the significance of these materials are often dismissed since designs not relying on them would likely arise if the supply of these materials becomes increasingly limited.

Wind turbines require large amounts of other materials, such as steel and copper as well, and these materials are quantified in the case study as an example of resource requirements. This study uses the assumption that 1 MW of wind capacity requires 140 tons of iron and steel and 2 tons of copper, as described by Kleijn and Van der Voet (2010).

Figure 2a presents the cumulative growth curves of wind capacity enabling 19 TW by 2030 and 24 TW by 2050 with exponential growth profiles. Figure 2b shows the resulting annual commissioning required to reach 19 TW wind capacity by 2030, as well as what is required to sustain this capacity in the future. It can be seen that not only the cumulative installations, but also the annual installations grow exponentially, leading to quite extreme annual installations at the end of the growth period. Reaching 19 TW by 2030 with exponential growth means that 21 % of all installed capacity would be installed in the final year, and 68 % would be installed in the last 5 years. Reaching 24 TW by 2050 with exponential growth means that 11% of all the capacity would be installed in the final year, and 45% would be installed in the last 5 years (Figure 2c). Sustaining these capacities will require an annual commissioning growing exponentially in a kind of cyclic behavior.

Similar results were found by Honnery and Moriarty (2011) who used 3 different exponential growth rates reaching 2 different installed capacities of wind power and found that these growth rates leads to “boom and bust cycles” in equipment manufacture as well as net energy output from the system.

Assuming double digit exponential growth of energy technologies for decades after reaching significant contributions to the global energy system can simply not be considered realistic since the pure arithmetic of such growth patterns leads to unreasonable expectations on annual installation rates. Further discussions on the nature of exponential growth can be found in other studies (Bartlett, 1993; Meadows et al., 1972).

Figure 2. a) Cumulative installed capacity of wind power reaching 19 TW by 2030 and 24 TW by 2050 with exponential growth. b) Annual commissioning of wind capacity required for reaching 19 TW by 2030 and sustaining this capacity. c) Annual commissioning of wind capacity required for reaching 24 TW by 2050 and sustaining this capacity.

Reaching 24 TW by 2050 alone is modelled using a logistic function. Figure 3a describes a logistic growth curve fitted to the historic data and constrained at 24 TW wind capacity. This appears to be a more realistic growth pattern than exponential growth, but what is not always considered is that the annual additions needed will not only be installing new turbines, but also replacing old turbines at the end of their service life. Assuming a 20 year service life for a wind turbine, the annual requirements of replacing old turbines can be modelled with a second logistic curve with a 20 year time lag. Figure 3b shows the annual commissioned capacity needed both for the net growth as well as replacing old capacity taken out of use.

Figure 3. a) Cumulative installed capacity of wind energy described by a logistic curve fitted to historical data reaching 24TW by 2050. b) Annually commissioned wind capacity required to reach 24TW by 2050 taking account for replacing decommissioned turbines.

The maximum annual installations needed for logistic growth is much lower than the exponential case, but reaching 24 TW still requires significant numbers. Also, as can be seen in Figure 3b, assuming logistic growth of cumulative installed capacity in this case means that the total annual installations needed when taking account for replacing old turbines creates a dip in annual installation need before rising again. This type of pulsing behavior is commonly seen in nature (Odum, 2007), and might not be an unrealistic scenario. However, it might not be optimal, since this would create an industry capable of installing more wind capacity in a year than is needed to sustain this in the long run.

Less scarce materials are commonly ruled out as constraints based on quite simple arguments, but for a complete transition to a renewable energy system even common materials have been mentioned as potentially problematic. Kleijn and van der Voet (2010) suggest that the sheer size of the proposed transition would challenge production even for “bulk materials” such as steel and copper.

Constructing the wind capacity of 24 TW would only demand a few per cent of global iron ore and copper reserves. However, using the growth patterns from the case study, this total resource requirement can be spread out over the time period leading up to the proposed realization year and be translated into annual requirements for the different resources. These annual quantities can then be compared with projections for future production of these resources. It could also be useful to take account for competing demand from other uses for a more complete systems view.

The quantities presented in Table 2 could give an indication of the size of the annual resource requirements for building these quantities of wind capacity. Table 2 describes the resulting maximum annual installations

Even in the sustained commissioning model, the annual installation of 1.2 TW needed to sustain the 24 TW wind capacity leads to significant annual requirements for copper and steel.

Under these assumptions, only sustaining the 24 TW of wind energy, assumed to provide 15% of global energy demand by Kleijn and Van der Voet (2010), would need the equivalent of 11% of total global steel production and 14% of global copper production (based on 2012 rates of production).

This means that reaching and sustaining this installed wind capacity would require quantities of steel that is similar to the current automotive industry, that used 12% of the steel produced in 2011, while the entire sector of electrical equipment used only around 3% (World Steel Association, 2012). The amount of copper needed for the turbines is comparable to what is used for making electric motors, of around 12% of the global copper production, while the electric energy transmission sector use about 26% (Achzet et al., 2011).

This study makes no attempt to project what the future energy systems might look like, neither on the demand nor the supply side. Instead, the assumptions of future installed capacity of wind energy for the case study is taken directly from these other studies, and translated into possible growth patterns. It should be mentioned that the works used in this case study are quite extreme when it comes to proposed installed capacities of wind and solar energy compared to most other studies proposing similar energy transitions. However, they are still considered relevant since they are widely cited in peer reviewed scientific journal articles.

During the growth phase this demand would be additional to current demand and must be assumed to come from supplementary production, and even if the replacement of turbines in the future would be based on recycling old turbines, a similar sized commissioning industry would be needed, as well as an industry capable of recycling the materials and making them available for new turbines. The pure scale of creating and sustaining this type of energy system is simply massive.

In the case of wind energy, metals considered somewhat scarce, such as neodymium, are sometimes mentioned as a potential issue, but “bulk” materials such as steel and copper are usually dismissed as potential constraints. However, none of them pay much attention to assumed growth rates or what resource flows that would be needed to sustain the growth or to sustain the proposed energy system in the future.

Three common ways to evaluate natural resource constraints in other studies have been found. First, the “Reserve-to-production ratio” (R/P ratio), comparing the current annual production to reserve estimates is a very common method. Secondly, simply comparing the total demand incurred by the proposed energy system to reserve estimates is a frequently used method. Thirdly, simply stating that the materials used are theoretically recyclable is sometimes used as an argument that no natural resource constraints will occur. All three of these arguments have their merits and can be used to make fast and easy estimates of natural resource constraints, but using any of them to completely dismiss potential problems with natural resource supply appears questionable.

An example of R/P ratio being used to disregard natural resource constraints can be found in Jacobson and Delucchi (2011), where it is stated that the world have “somewhat limited reserves” of iron ore, which is claimed to last for 100-200 years at current production. However, this assumes that annual production remains constant and global steel production is currently increasing rapidly, and realizing the Jacobson and Delucchi (2009) scenario would mean a significant increase of an already expanding demand for steel. Comparing current production to reserve estimates could give a first indication of potential constraints, but it appears insufficient to motivate a total dismissal of problems that might occur. Bartlett (2006) describes several problems with using the R/P ratio for a resource under growing production, and states that it gives rise to unwarranted optimism.

The method of comparing the total requirements of a resource for reaching a future energy system to estimated reserves can be found in García-Olivares et al. (2012), where it is stated that the complete power system needed for the energy system described would need 40% of total estimated copper reserves. Adding assumptions of the copper needed from the demand side of the transport sector García-Olivares et al. (2012) reach a total of 60% of global copper reserves. This method has the potential of indicating if the quantities needed could be a problem. For instance, the claim that realizing the energy system proposed in García-Olivares et al. (2012) could demand 60% of the current copper reserves appear like extraordinary quantities, although reserve estimates can change with time.

This method does not say anything about what resource flows would be needed and how fast the materials could be brought to market.

The third common argument to dismiss potential resource constraints is using the simple fact that some materials are recyclable. Jacobson and Delucchi (2011) argue that some rare resources, such as neodymium for electric motors and generators, platinum for fuel cells and lithium will have to be recycled or replaced with less scarce materials to reach a 100% renewable energy system, unless additional resources are located. Jacobson and Delucchi (2009) claim that there are indications that there are not enough economically recoverable lithium to build “anyway near the number of batteries needed in a global electric- vehicle economy”, but at the same time state that recycling could change this equation. There is no doubt that recycling would be important for sustaining a “sustainable” energy system in the future, but this does not mean that recycling will change the total amount of materials needed in the system at a given moment in time. The same atoms simply cannot both be in use and recycled to build other technology at the same time. The minimum amount of a resource needed to sustain the system simply does not change because of recycling. A more comprehensive discussion on recycling using the case of lithium is available in Vikström et al. (2013).

The end of life recycling rate (EOL-RR) appears to be around 70-90% for iron and steel, but since the steel demand is growing and is commonly used for long lived uses, the recycled content (RC) in new material is lower at around 32-52%, while the same factors for copper has been estimated to be between 43-53% and 22-37% respectively (Graedel et al., 2011).

While some expect that the recycling rates for metals used in electricity generation technologies will be higher due to expected high collection rates (Elshkaki and Graedel, 2013), others mentions different situations that could lead to materials not being recycled (Davidsson et al., 2012).

For some materials, recycling can even be technically problematic. In the case of REEs, such as neodymium, recycling is commonly mentioned as being important for a sustainable energy system, but at the moment no infrastructure for recycling of REEs from the permanent magnets exists and the end-of-life recycling rate is estimated to be less than 1% (Buchert, 2011).

One important problem with recycling rare earth elements is the fact that the metals oxidize quickly and disappear in the slag (Buchert et al., 2009). However, it could be technically possible to reach recycling rates of more than 90% for both neodymium and dysprosium (Schüler et al., 2011). A sustainable energy system would have to recycle as much as possible of the materials after the end of the service life, but even if recycling rates would eventually come close to 100%, the industry for replacing old technologies would still demand large resource flows indefinitely. The case study culminating in 24 TW of installed wind capacity demands an equivalent of over 10% of current (2012) global annual demand of bulk materials such as copper and steel. Even if these turbines were to be recycled at the end of their life and built using only recycled materials, it would still mean large material flows.

Another important perspective is the fact that this study only includes the material demands for constructing wind energy,

An energy system completely based on renewable energy technology would likely need more of these technologies, but also energy storage and transmission capable of creating a functioning energy system. For instance, Barnhart and Benson (2013) investigates energy and material requirements for different energy storage technologies and concludes that building an energy storage capacity that could be required in the future require amounts of materials and energy that are comparable to current annual production values.

An industry growing too fast can mean that the industry consumes more energy than it produces on an annual basis (Honnery).

There are many other examples of potential constraints on the growth of renewable energy technology, many of which are discussed by others. IEA (2013b) mentions costs, grid integration issues and permit issues as obstacles to a goal of 18% of global electricity from wind energy by 2050.

For wind energy, constructing the wind turbine and the connected capital costs constitute the majority of the total cost, with 76 – 85% of the total cost being capital cost (Timilsina et al., 2013). Financing for this cost needs to be in place before the wind capacity can be commissioned. Jacobson and Delucchi (2009) state that the construction of the proposed energy system would cost around 100 trillion USD over 20 years (not including transmission), which will be paid back by the sale of electricity and energy. Trainer (2012) interprets this as an investment of 5 trillion USD annually would be needed, which is said to be around 11 times the early 2000s annual investments in energy of around 450 billion USD. However, as discussed in this paper, this type of growth pattern is not very realistic.

The variability of production and grid integration is commonly suggested as the main barriers for implementation of renewable energy and it has even been suggested that this factor limits penetration rates of wind energy to 2 % of electricity production (Lenzen, 2010). These factors are discussed in more detail in other studies (Trainer, 2013, 2012).

The fact that energy production from renewable energy technologies is intermittent and non-dispatchable can also be argued to add to the total costs due to the need for backup power (Larsson et al., 2014).

The grid improvements and backup power requirements have to be in place before the variable energy production is taken into use, so the estimated growth curves can prove important for these aspects as well.

Although these technologies are likely more sustainable than fossil fuels, they are not without environmental impacts and are built using non-renewable resources. They should therefore not automatically be considered sustainable. A rapid growth in these technologies will even increase demand for a variety of different resources. Suitable growth rates of energy technologies, as well as how an energy system can be sustained over a longer time frame, should be considered when discussing sustainable energy systems for the future.

References

Achzet B., Reller A., Zepf V., University of Augsburg, Rennie C., BP, Ashfield M. and Simmons J., ON Communication, 2011. Materials critical to the energy industry. An introduction. http://www.bp.com/content/dam/bp/pdf/sustainability/group- reports/Materials_March2012.pdf Ang, B.W., Ng, T.T., 1992. The use

Bartlett, A.A., 2006. A Depletion Protocol for Non-Renewable Natural Resources:

Australia as an Example. Natural Resources Research 15, 151–164.

Buchert, M., 2011. Rare Earths – a Bottleneck for future Wind Turbine Technologies? Presented at Wind Turbine Supply Chain & Logistics, Berlin, 29 August 2011. Available from: http://www.oeko.de/oekodoc/1296/2011-421-en.pdf

Dale, M., Benson, S.M., 2013. Energy Balance of the Global Photovoltaic (PV) Industry – Is the PV Industry a Net Electricity Producer? Environ. Sci. Technol. 47, 3482–3489. Davidsson, S., Höök, M., Wall, G., 2012. A review

Elshkaki, A., Graedel, T.E., 2013. Dynamic analysis of the global metals flows and stocks in electricity generation technologies. Journal of Cleaner Production, 59, 260-273.

Graedel TE et al (2011) What Do We Know About Metal Recycling Rates? U.S. Geological Survey. https://digitalcommons.unl.edu/cgi/viewcontent.cgi?article=1605&context=usgsstaffpub

K., Sibley, S. F., Sonnemann, G., 2011. Recycling rates of metals: A status report. Journal of Industrial Ecology. 15(3), 355-366.

Larsson, S., Fantazzini, D., Davidsson, S., Kullander, S., Höök, M., 2014. Reviewing electricity production cost assessments. Renewable and Sustainable Energy Reviews 30, 170–183.

Laxson, A., Hand, M.M., Blair, N., 2006. High Wind Penetration Impact on U.S. Wind Manufacturing Capacity and Critical Resources. National Renewable Energy Laboratory. Report No. NREL/TP 500-40482.

Lenzen, M., 2010. Current State of Development of Electricity-Generating Technologies: A Literature Review. Energies 3, 462–591. Lund, H., 2007. Renewable energy strategies for sustainable development. Energy 32, 912–919. Meadows, D.H., Meadows, D.L., Randers, J., Behrens III, W.W., 1972. The Limits to Growth. Earth Island Limited, London.

Tao, C.S., Jiang, J., Tao, M., 2011. Natural resource limitations to terawatt- scale solar cells. Solar Energy Materials and Solar Cells 95, 3176–3180.

Trainer, T., 2012. A critique of Jacobson and Delucchi’s proposals for a world renewable energy supply. Energy Policy 44, 476–481. Trainer, T., 2013. 100% Renewable supply? Comments on the reply by Jacobson and Delucchi to the critique by Trainer. Energy Policy 57, 634–640. USGS, 2013. 2011 Mineral Yearbook: Rare Earths [Advanced Release]. Available from:

http://minerals.usgs.gov/minerals/pubs/commodity/rare_earths/myb1-2011-raree.pdf

Vikström, H., Davidsson, S., Höök, M., 2013. Lithium availability and future production outlooks. Applied Energy 110, 252–266. Wilson, C., Grubler, A., Bauer, N., Krey, V., Riahi, K., 2013. Future capacity growth of energy technologies: are scenarios consistent with historical evidence? Climatic Change 118, 381–395. 395. 67-8

Posted in Wind | Tagged , , | 4 Comments

Book Review: Rule Makers, Rule Breakers: How Tight & Loose Cultures Wire Our World

Preface.  A must-read book for those who want to understand themselves, their family and friends, their culture and the world.  A new framework that gives clearer vision, rather than muddying it up by giving false understandings like astrology or seeing the world from economic and political rather than ecological and resource awareness.

Gelfand’s book about loose versus tight cultures has real world, life and death consequences.  She wrote an article in The Guardian about covid-19,  Why countries with ‘loose’, rule-breaking cultures have been hit harder by Covid, that says: “Back in March, I started to worry that loose cultures, with their rule-breaking spirit, would take longer to abide by public health measures, with potentially tragic consequences. I was hopeful that they would eventually tighten. All of our computer models prior to Covid suggested they would. But they didn’t. In research that tracked more than 50 countries, published this week in the Lancet Planetary Health, my team and I show that, taking into account other factors, loose cultures had five times the number of cases that tight cultures did, and more than eight times as many deaths.  Our  analysis of data from the UK revealed that people in loose cultures had far less fear of the Covid-19 virus throughout 2020, even as cases skyrocketed. In tight nations, 70% of people were very scared of catching the virus. In loose cultures, only 49% were.  Reality never bit in these populations in part because people in cultures that are adapted to low levels of danger didn’t respond as swiftly to the “threat signal” embodied by the pandemic when it came. This can happen in nature too. The most infamous case is the fearless dodo bird of Mauritius, which, having evolved without predators, became extinct within a century of its first contact with humans.”

In this book, Gelfand points out that “Singapore’s response to the 2003 SARS outbreak is a case in point. Soon after SARS hit, the Singaporean government quickly implemented strict rules and restrictions on people’s movement and somewhat intrusive early-detection measures, such as monitoring people’s temperature at schools, work, and households (thermometers were distributed to over a million people). Webcams were even installed in the homes of quarantined citizens, who were phoned at random points during the day and required to present themselves in front of the camera to ensure they didn’t leave home” and Singapore is among the best at reducing covid-19 deaths.

In light of the treasonous violent insurrection Trump set off in the Capitol in 2021, Gelfand is also prescient about Trump and how he manipulated the tight, conservative portion of the American population:  “…While Trump isn’t a cultural psychologist, he possessed an intuitive grasp of how threat tightens citizens’ minds and leads them to yearn for strong leaders who’ll combat these threats. He masterfully created a climate of threat: At campaign rallies throughout 2015 and 2016, Trump warned his ever-growing crowds that the United States was a nation on the brink of disaster. He cited mounting threats from Mexicans bringing violence across the border, global trade agreements and immigrants taking away jobs, radicalized Muslims plotting terror on American soil, and China “raping” the country. Throughout his campaign, he sent a clear message—that he was capable of restoring social order. “I alone can fix it”.   Perceptions of threat have led some in the working class to prefer populist leaders who promise to dismantle the social structures that have left them behind and restore traditional order. These leaders run on promises of delivering more tightness. Trump vowed to “restore law and order” to the American political system, tighten borders, keep out immigrants, and crack down on crime.

Months before the 2016 election a nationwide survey was conducted to peer into the minds of Trump supporters.  They answered questions about how fearful they felt about various external threats to the United States, such as ISIS and North Korea. They also responded to statements aimed at gauging their desire for cultural tightness. Those who felt the country was facing greater threats desired greater tightness. This desire, in turn, correctly predicted their support for Trump. In fact, desired tightness predicted support for Trump far better than other measures. For example, a desire for tightness predicted a vote for Trump with 44 times more accuracy than other popular measures of authoritarianism. Concern about external threats also predicted support for many of the issues that Trump has championed, such as monitoring mosques, creating a registry of Muslim Americans, and deporting all undocumented immigrants. Perhaps unsurprisingly, Trump had the most support in tight states—where citizens felt the most threatened.  Threats lead to desire for stronger rules, obedience to autocratic leaders, and—at worst—intolerance.

What follows are notes from my Kindle.

Alice Friedemann  www.energyskeptic.com  Author of Life After Fossil Fuels: A Reality Check on Alternative Energy; When Trucks Stop Running: Energy and the Future of Transportation”, Barriers to Making Algal Biofuels, & “Crunch! Whole Grain Artisan Chips and Crackers”.  Women in ecology  Podcasts: WGBH, Jore, Planet: Critical, Crazy Town, Collapse Chronicles, Derrick Jensen, Practical Prepping, Kunstler 253 &278, Peak Prosperity,  Index of best energyskeptic posts

***

Gelfand M (2018) Rule Makers, Rule Breakers: How Tight and Loose Cultures Wire Our World. Scribner.  

We may tease Germans for being excessively orderly or Brazilians for showing too much skin, but we rarely consider how these differences came about. Far beyond dress codes and pedestrian patterns, people’s social differences run deep and broad—from politics to parenting, management to worship, and vocations to vacations.

The diversity of human behavior is astonishing, especially since 96% of the human genome is identical to that of chimpanzees, whose lifestyles, unlike humans, are far more similar across communities.

Behavior, it turns out, largely depends on whether we live in a tight or loose culture. The side of the divide that a culture exists on reflects the strength of its social norms and the strictness with which it enforces them. All cultures have social norms—rules for acceptable behavior—that we regularly take for granted. As children, we learn hundreds of social norms—to not grab things out of other people’s hands; to walk on the right side of the sidewalk (or the left, depending on where you live); to put on clothes each day. We continue to absorb new social norms throughout our lives: what to wear to a funeral; how to behave at a rock concert versus a symphony; and the proper way to perform rituals—from weddings to worship. Social norms are the glue that holds groups together; they give us our identity, and they help us coordinate in unprecedented ways. Yet cultures vary in the strength of their social glue, with profound consequences for our worldviews

Tight cultures have strong social norms and little tolerance for deviance, while loose cultures have weak social norms and are highly permissive. The former are rule makers; the latter, rule breakers. In the United States, a relatively loose culture, a person can’t get far down their street without witnessing a slew of casual norm violations, from littering to jaywalking to dog waste. By contrast, in Singapore, where norm violations are rare, pavements are pristine, and jaywalkers are nowhere to be found.

In Japan, a tight country, there’s a huge emphasis on punctuality—trains almost never arrive late. On the rare days that delays do occur, some train companies will hand out cards to passengers that they can submit to their bosses to excuse a tardy arrival at work.

We’re a super-normative species: Without even realizing it, we spend a huge amount of our lives following social rules and conventions. Studies show that even babies follow norms and are willing to punish norm violators even before they have formal language.

After being taught a certain arbitrary behavior and then witnessing a puppet incorrectly imitating it, three-year-olds vigorously protested. Quite clearly, children learn not only to interpret social norms from their environment, but also to actively shape and enforce them.

There’s no evidence so far that animals copy others for social reasons such as simply fitting in and belonging.

Social norms are far from random. Rather, they evolve for a highly functional reason: They’ve shaped us into one of the most cooperative species on the planet. Countless studies have shown that social norms are critical for uniting communities into cooperative, well-coordinated groups that can accomplish great feats. Social norms are, in effect, the ties that bind us together, and scientists have collected evidence to prove it.

Unable to control their employees’ behaviors, companies would quickly go out of business. Without these shared standards of behavior, families would splinter apart. Clearly, it’s in our interest to adhere to social norms.

Ignoring social norms not only can damage our reputations, but also may result in ostracism, even death. From an evolutionary perspective, people who developed keen abilities to follow social norms may have been more likely to survive and thrive. This powerful fact has made us a remarkably cooperative species—but only so long as the interactions are between people who share the same basic norms. When groups with fundamentally different cultural mind-sets meet, conflict abounds. Thus the paradox: While norms have been the secret to our success, they’re also the source of massive conflict all around the world.

In New Zealand, people can drive with open bottles of alcohol in their cars as long as they remain within the legal blood alcohol limit. Women have the highest number of sexual partners in the world—an average of 20.4 during their lifetime (the global average is 7.3). Prostitution has long been decriminalized; according to the unique “New Zealand Model,” anyone over age eighteen can engage in it, complete with workplace protections and health-care benefits.

Over one-third of popular music videos portray at least one incident of violence, whether it be fighting, gunshots, battles, suicides, murders, or bomb explosions, and at least one-fifth include examples of antisocial behavior, from vandalism to littering

“Kiwis,” as New Zealanders playfully call themselves (after the flightless bird), tend to become acquainted very quickly, and they eschew formal titles. People are known to walk barefoot on city streets, in grocery stores, and in banks. Public dissent and protests are frequent.

Tightt nations: Pakistan, Malaysia, India, Singapore, South Korea, Norway, Turkey, Japan, China, Portugal, and Germany (formerly East).  Tightness is highest in South and East Asian nations, followed by Middle Eastern nations and European countries of Nordic and Germanic origin.

Loose nations:  Spain, the United States, Australia, New Zealand, Greece, Venezuela, Brazil, the Netherlands, Israel, Hungary, Estonia, and the Ukraine.  Latin-European, English-speaking, and Latin American cultures are much less tight, with Eastern European and former Communist nations the loosest.

Figuratively speaking, in the tightest of cultures, people feel as though they’re in a library for a greater portion of their lives. But in the loosest of cultures, people feel as though they’re often at a park, with much more freedom to do as they wish. Of course, nations tend to fall between these two extremes. And where they fall, they don’t necessarily stay. Though cultural psyches run deep, cultures can and do change on the continuum.

The looseness of these contexts tends to be carefully designated. Take Takeshita Street in Tokyo. Within the confines of this narrow pedestrian shopping street, Japan’s cultural demands for uniformity and order are completely suspended. On Takeshita Street, people stroll and preen in zany costumes, ranging from anime characters to sexy maids to punk musicians.

There is no linear relationship between nations’ scores on tightness-looseness and their economic development. Singapore and Germany, both tight, enjoy significant economic success, but Pakistan and India, also tight, still struggle. The United States and Australia, both loose, are wealthy, but the Ukraine and Brazil, also loose, have comparatively lower gross domestic products. Tightness-looseness is also distinct from previous ways that scholars have compared cultures, such as whether they’re collectivist or individualist (collectivist cultures emphasize family ties; individualist cultures stress self-reliance). There are plenty of nations in each of the four quadrants: collectivist and tight (Japan and Singapore), collectivist and loose (Brazil and Spain), individualist and loose (the United States and New Zealand), and individualist and tight (Austria and Germany).

The daily life of Spartans likewise resembled life in a military camp. In addition to following highly regulated diets, men and women were expected to frequently exercise to maintain a fit physique. The Spartans found obesity grotesque, so those who were overweight were banished from the city-state. Men and women who failed to pass physical exams (along with those who engaged in illegal activity or didn’t marry) were shunned, lost their citizenship, or had to wear special clothing as signs of societal disgrace. Sparta’s cutthroat physical standards even applied to newborn babies: If an infant was deemed weak or deformed, it was left at the foot of a mountain to die. Spartans abided by clear-cut mannerisms taught in childhood. They were trained to wear solemn expressions and speak concisely. Children were disciplined to never cry, speak in public, or express fear.

Total uniformity in dress, hairstyle, and behavior was demanded. Foreigners and foreign influence were prohibited, and Spartan citizens were forbidden to travel abroad. While the tight lifestyle might sound rather austere, Sparta was a proud culture, and its practices paid off: The radical discipline of Sparta’s citizens enabled it to achieve military predominance across Greece.

Athens had permissive norms, with frequent gorging and drinking. Strolling the streets of Athens, you would have noticed a wide range of fashion styles, accessorized with jewelry pieces from the bustling Athenian marketplace, the agora. There you’d witness unbridled self-expression by artists, pastry chefs, actors, writers, and public intellectuals from different schools of thought.

Nahua, indigenous tribe of Mexico and Guatemala

From early childhood, the Nahua taught their sons and daughters to be obedient and abide by norms. By age six, children completed many of the family’s daily tasks, such as taking care of siblings, helping in the fields and around the house, and going to the market. By age 15, girls did all the housework of grown women, while boys drove plows, planted and harvested crops, and raised cattle. The Nahua placed a great emphasis on “good” behavior in children. Sexuality was discouraged from childhood on, and curiosity about bodily functions was forbidden. Parents in Nahua strongly believed that children lacking self-discipline would grow up to become poor workers and bring great shame to their families. To ward off this fate, children who fell short of their parents’ expectations were severely punished—whipped, beaten, kicked, ridiculed, or denied food or sleep for offenses such as losing things or grumbling. Later, marriageability depended on one’s willingness to follow the rules. If a young man’s mother learned that his intended was known for being lazy or disobedient, she would object to the union. In public, women and girls were expected to be demure and unassuming at all times, lest their behavior be labeled shamelessly flirtatious. Since women were expected to remain virgins before marriage, any appearance of a sexual drive could damage their reputations and was severely punished by their parents. Once married, wives were expected to be compliant and faithful. To ensure nothing could destabilize the new family structure, they were discouraged from keeping female friends, who might act as a go-between for a wife and her prospective lover. Men also discontinued their friendships with other men, lest intimacy develop between these men and their wives. Divorce was highly frowned upon. Community members reported on the wrongdoings of others, and appropriate conduct was maintained through unrelenting gossip, accusations of sorcery, and, in severe cases, expulsion from the community.

Copper Inuit children enjoyed an unstructured and informal lifestyle. The parenting style was laissez-faire to say the least. Diamond Jenness, a pioneer of Canadian anthropology, described children growing up like “wild plants” until puberty, roaming about on their own, roughhousing with peers, and not hesitating to interrupt or correct their parents. Children had total autonomy over their schedules, including whether to attend school. Parents rarely used any form of physical punishment with their kids; they mostly ignored misbehavior or briefly teased children who acted out of line.

Intercourse was fairly common among adolescents, who had sex even in their parents’ house. If and when couples eventually did get married, the process was rather informal: They established a separate home, but returned to their respective families’ homes if things didn’t work out. Open marriages were tolerated, including wife-swapping in some cases, which promoted alliances with members of unrelated families. Men and women had their own roles within the home, but these roles were flexible: women sometimes went hunting, and men learned how to cook and sew. Within the broader community, only “rudimentary law” existed, according to the legal anthropologist E. Adamson Hoebel; there was no centralized power to resolve conflicts between community members. The fact that individuals were left to manage conflict on their own undoubtedly contributed to the high rates of homicide and blood feuds among the Copper Inuit.

Crime rates in Japan have fallen so low in the last 13 years that police officers are literally looking for things to occupy their time. According to the Economist, as of 2014, Japan had one of the lowest murder rates in the world, just 0.3 per 100,000 people. The streets of Japan are so safe that some police officers have resorted to prodding individuals to steal: Policemen in the southern city of Kagoshima started leaving cases of beer in unlocked cars just to see if passersby would grab them. But even this sting was underwhelming; it took a week before they could revel in the opportunity to punish a hapless offender.

Crime rates per hundred thousand people are all significantly lower in tight countries.

In looser countries, like New Zealand, the Netherlands, and the United States, crime is much more common.

At least 16 crimes can result in a death sentence in Saudi Arabia, including drug possession, burglary, rape, adultery, and gay sex. Get caught drinking alcohol, and you may face jail time and even a public flogging.

Tight cultures tend to have more police per capita and employ more security personnel to check for inappropriate behavior in public spaces. Surveillance cameras are rampant in tight countries, reminding the public to behave themselves. In Saudi Arabia, high-tech cameras called saher, which translates to “one who remains awake,” dot highways, exit roads, and intersections. They capture images of drivers talking on the phone, texting, not wearing seat belts, and driving over the speed limit, as well as tailgating and changing lanes excessively. Similarly, Japan has millions of surveillance cameras on streets, buildings, store entrances, taxis, and train stations.

Tight cultures also tend to rank higher on religiosity, cleanliness, and organization.  Even after factoring in national wealth, they found that tighter countries tend to have more cleaning personnel on city streets.

Japan’s obsession with cleanliness made international headlines after the nation’s defeat in the 2014 World Cup, when Japanese fans swarmed over Brazil’s Arena Pernambuco stadium with bright blue trash bags, gathering up litter to discard—a post-game tradition in their home country that they’d taken on the road.

By contrast, in an extreme show of loose behavior, when the Vancouver Canucks lost the Stanley Cup in 2011, the city transformed into a “drunken vomity hellhole” that cost around $4 million to repair, blogger Isha Aran reported. Slovenly behavior like this is generally more widespread in loose cultures.

In addition to generally being cleaner, tight cultures tend to have less noise pollution. Germany has mandated quiet hours on Sundays and holiday evenings. During these quiet hours, you’re forbidden to mow your lawn, play loud music, or run washing machines. Even libraries, which are supposed to be the quintessential haven for quiet, are rated as being much noisier in looser cultures.

If you live in a tighter culture, you’re more likely to be able to depend on the preset schedules of public transport.

People are more likely to dress the same, buy the same things, and generally downplay their uniqueness. Why? Because if everybody acts like everybody else, order and coordination become much easier. Take something as seemingly benign as which hand you use for writing. One of my studies found that there are far fewer “lefties” in tight cultures.

The tighter a country is, the more likely it is to require school uniforms. This uniformity even extends to the cars people drive. I had my team of research assistants also venture into parking lots around the world. We found less variation in the make and color of cars in tight cultures as compared with loose ones.

In the Middle East, the adhan, or Islamic call to prayer, resonates through the streets five times a day, synchronizing individuals throughout the region.  The more people have to attune their conduct to others’, he argued, the stronger their ability to regulate their impulses. My research supports this argument: People in tight cultures do indeed show higher self-control. For example, people in the United States, New Zealand, Greece, and Venezuela weigh much more than people in tight countries like India, Japan, Pakistan, and Singapore, even taking into account a country’s wealth and people’s average height.

Some of the highest scores for alcohol consumption in liters per capita also came from loose countries such as Spain, Estonia, and New Zealand. Residents of tight nations such as Singapore, India, and China score low on alcohol consumption rates.

Residents of loose countries such as the United States, Hungary, and Estonia are more likely to gamble than residents of tight countries such as South Korea and Singapore. Loose nations also have lower gross national savings—a country’s gross national income minus public and private consumption—even when taking into account wealth and income distribution, suggesting that economies in loose cultures are spending more income than they produce.

Loose cultures have a significant edge when it comes to being open—to new ideas, different people, and change—qualities that tight cultures sorely lack.

“If one were to order all mankind to choose the best set of rules in the world, each group would, after due consideration, choose its own customs; each group regards its own as being by far the best.” Herodotus illustrates his point with a story in which King Darius, the ruler of Persia, asks a group of Greeks who were cremating their dead fathers how much money it would take for them to eat their fathers’ corpses. The Greeks, shocked, reply that they’d never agree to do such a thing.  The king then asks the Callatiae, an Indian tribe, who were known to eat their parents, how much money it would take for them to cremate their corpses. The Callatiae cry out in horror and tell Darius not to suggest such appalling acts.

Generally, people in tight cultures are more likely to believe their culture is superior and needs to be protected from foreign influences.

China

  • China ranks in the 90th percentile of countries with the most negative attitudes toward foreigners. And in Japan, where foreigners make up only 2% of the population, many landlords have a “no foreigners” policy, and certain bathhouses, shops, restaurants, and hotels deny entry to foreign customers
  • In China, unmarried or divorced women in their late twenties are referred to as “leftover women,” or sheng nu, by the government and are mocked as being “a used cotton jacket” on state-sponsored TV programs.

Tight nations are more likely to have autocratic governments that don’t hesitate to forcefully crack down on any dissent or censor the media.

Population density

  • People live in small spaces in close proximity to their neighbors, contending with packed streets and cheek-to-jowl buses and trains. Compare Singapore, with its astonishing population density of over 20,000 people per square mile as of 2016, with Iceland, which has only eight people per square mile.
  • High population density is a basic human threat. In societies where personal space is hard to come by, there’s great potential for chaos and conflict.

Groups with many ecological & historical threats or depleted resources are tighter to create order in the face of chaos

  • Though they were separated by miles and, in some cases, decades or centuries, the tight cultures of Sparta, the Nahua, and Singapore faced a common fate: Each had (or has) to deal with a high degree of threat, whether from Mother Nature and her constant fury of disasters, diseases, and food scarcity, or from human nature and the chaos caused by invasions and internal conflicts. And when we look at the loose cultures of New Zealand, Athens, and the Copper Inuit, we see the opposite pattern: These groups had (or have) the luxury of facing far fewer threats.
  • In his book The Revenge of Geography, Robert Kaplan reminds us that the United States—with its safe separation from other continents by two large oceans—has felt few threats from outsiders throughout its history. The same is also true of New Zealand and Australia.
  • Conflict has been particularly prevalent in Asia. China has experienced massive conflict throughout its history, with an exceedingly long list of battles
  • China’s location makes territorial threat a constant source of anxiety. It borders 14 countries, and has had disputes with each of them.
  • Korea also has been repeatedly clobbered by its neighbors
  • When nations face the possibility of invasion, they must strengthen internal order to ensure a united, coordinated front against the enemy. Tight social norms are essential to this defense.
  • China, for example, has lost nearly 450,000 lives in the past fifty years to natural disasters (twenty-five times more than the United States), in part due to the typhoons that torment its long coastline.
  • Japan has also been one of Mother Nature’s favorite targets throughout its history. A combination of cold weather and volcanic activity led to the Kangi Famine from 1229 to 1232. During the Edo Period (1603–1868), more than 150 famines hit Japan, leaving at least hundreds of thousands dead. In the modern era, Japan has suffered from several devastating earthquakes,
  • Nations like Japan need stronger norms to provide the order and coordination required to recover from chronic natural disasters. Without strong norms, people would be tempted to go rogue in such dire circumstances—looking out only for themselves or their immediate family, for example, by engaging in looting—causing total chaos. But with strong norms and punishments for deviance, such nations are in a much better position to cope and survive.
  • They often deplete natural resources, including arable land and drinking water supplies. Our data suggest that cultures that lack such resources are tighter than cultures that have them in abundance. The reason is simple: When cultures have few natural resources, managing them in a controlled, coordinated way is a matter of survival.  Of the nations I surveyed, Pakistan, India, and China, all tight, had the fewest natural resources within their territories, with high levels of food deprivation and low access to safe water.

Religion

  • Religion tends to breed tightness, both today and in ancient history,
  • Beyond the codification of right and wrong, the belief in the Almighty inculcates the same tight accountability that security cameras bring to public spaces.

Threatening events

  • I set up a field study in Boston to test whether the city’s cultural norms had tightened in response to the event. People who reported being the most affected by the bombings were indeed more likely to report that the United States needed to have stronger social norms. They also reported that the American way of life needs to be protected against foreign influence, there should be more restrictions over people entering the country, and the United States is superior to other countries. These are all attitudes we see in nations that face chronic invasions.
  • As threats crop up, groups tighten. As threats subside, groups loosen.
  • Threats don’t even need to be real. As long as people perceive a threat, the perception can be as powerful as objective reality. In fact, long before Donald Trump, Marine Le Pen, or Viktor Orbán, politicians have been hyping up threats to tighten groups for centuries.

Diversity can make a society looser: Israel

  • When Israel was founded, its settlers faced rampant malaria, typhus, and cholera. The country has fought numerous wars, mostly due to territorial issues and the long-held animosity between Arabs and Israelis, which continues to this day. Yet Israel is relatively loose, with its high levels of informality and chronic attempts to circumvent rules. Why?
  • One reason that stands out as especially compelling: Israel is highly diverse; 75% of the nation is Jewish, 20% Arab, and the remaining 5% a mix of non-Arab Christian and Baha’i, among other groups. The country has high levels of ethnic diversity, with significant percentages of the citizenry hailing from Eastern Europe, Africa, and the Middle East. With so many different groups with different coexisting norms, it is hard to agree on any one standard for behavior.
  • Another possible explanation for Israel’s relative looseness is its fierce tradition of debate. Debate and dissent, which mandate the exploration of multiple perspectives, promote looseness and the rejection of dogma. 
  • In addition, Israel is a young, exploratory “start-up nation” made up of settlers who had the chutzpah to dive into something new, risky, and unknown.
  • Israelis are notably leery of being told what to do; they prefer challenging rules and guidelines over obeying them. “An outsider would see chutzpah everywhere in Israel,” explain Dan Senor and Saul Singer, authors of Start-Up Nation: The Story of Israel’s Economic Miracle, “in the way university students speak with their professors, employees challenge their bosses, sergeants question their generals, and clerks second-guess government ministers. To Israelis, however, this isn’t chutzpah, it’s the normal mode of being.

Too much diversity can lead to tightness though.  When diversity gets to be extreme, as it is in Pakistan, which has at least six major ethnic groups and over 20 spoken languages, and India, with its 22 official languages and hundreds of dialects, diversity can cause conflict, which, as we know, requires strict norms to manage. When diversity gets to be very high, tightness begins to increase markedly.

Tightness and looseness in the Netherlands And the United States

  • Thanks in large part to its location and trading activity, the Netherlands has become home to an eclectic mix of ethnic, racial, and religious groups, which may have contributed to its looseness. For centuries, the Netherlands welcomed refugees from all over Europe, including French Protestants, Portuguese and German Jews, and English separatists, among many others. Today, over 20% of the population comes from abroad
  • To quantify levels of tight-loose across the 50 states, Jesse Harrington and I scoured research institutes and the Smithsonian archives for data on each state going back to the early 1800s, including records on punishment methods, state restrictions, cultural practices, and ecological and historical events. The patterns we discovered were illuminating. Take, for example, differences in the harshness of punishments across states. Compared with Alaska and Maine, Indiana and Texas spank far more students, execute more criminals, and punish marijuana possession more harshly. In 2011 alone, over 28,000 students were paddled or spanked in Texas schools.  
  • In states where children are more likely to be hit in school, there are higher rates of executions, more restrictions on alcohol, sterner views of marriage, fewer foreigners, and so on. These states are stricter—they’re tight, rule makers. Meanwhile, states with more lenient punishments also have fewer restrictions on alcohol and marriage and have more foreigners. These states have more latitude—they’re loose, rule breakers.
  • Some of the tightest states in the country include Mississippi, Alabama, Arkansas, Oklahoma, Tennessee, and Texas. At the looser end of the spectrum are California, Oregon, Washington, Nevada, Maine, and Massachusetts. Delaware, Iowa, Idaho, Nebraska, Florida, and Minnesota fall in the middle. From these rankings, regional patterns emerge: The South is tightest, the West and Northeast are loosest, and the Midwest is in the middle.

Conservativism, liberalism, religion and personality in the United States

  • Conservatism reflects individuals’ emphasis on traditional values and often manifests as resistance to change, whereas tightness is a state of culture that reflects the strength of social norms in one’s environment. While tight states and countries have more conservatives and loose states and countries have more liberals, there are plenty of conservatives in loose regions and plenty of liberals in tight ones.
  • People in tight states are more likely to have a personality trait that psychologists call “conscientiousness,” which entails self-discipline, rule following, and the desire for structure. These people report being more organized, careful, and dependable, and agree with statements such as “I see myself as someone who is a reliable worker,” as someone who “makes plans and follows through with them,” and as someone who “does things efficiently.” By contrast, people in loose states report having less conscientiousness. More disorderly and less reliable (and honest enough to be self-critical!), they’re more likely to agree that they can be “somewhat careless,” “disorganized,” and “easily distracted.” It’s true: If you spend time in states like North Carolina, Georgia, Utah, and Kansas, you’ll generally find people who are more cautious, thorough, and orderly relative to people in loose states like Alaska, Maine, Hawaii, and Rhode Island.
  • In the South, home to the tightest U.S. states, strong rules about etiquette, hospitality, formality, and, above all, respect prevail. Children learn to say “yes, ma’am” and “yes, sir” to adults and not to interrupt them.  Southerners reacted with a higher rise in cortisol, a hormone that indexes stress, as well as testosterone, a hormone that primes aggression in response to threat. It’s no small wonder that people in the South try to avoid this kind of rude behavior in the first place.
  • Recreational marijuana use is now legal in nine states, all of them loose: Alaska, California, Colorado, Maine, Massachusetts, Oregon, Washington, Vermont, and Nevada.
  • More rurality and less mobility produce an interesting cultural cocktail: You can bet that outside your home, neighbors and acquaintances know what you’re doing, and they may have strong opinions about it. In these small, tight-knit communities, the neighborhood watch is on full alert. According to Southern Living, people in small towns often know whom every teenager is dating, which neighbors just made a large purchase, and even when the town mechanic has hired a new guy. The gossip mill, it turns out, has important social functions.  In towns where negative reputations can spread overnight, the fear of being bad-mouthed can help to deter bad behavior and promote cooperation.
  • We’ve found that tight states tend to have more police and law enforcement officials, and citizens generally agree that the police should use strict punishment—including force—to keep the social order. Tight states also incarcerate a greater percentage of their populations. By contrast, in the urban and highly mobile areas common to loose states, you might pass thousands of strangers on your daily commute and find yourself living in relative anonymity, with little neighborly supervision. Other indicators of social disorder—such as higher divorce, single-parent households, and even homelessness—are higher in loose states.
  • Among Americans in tight states there is a remarkably high percentage of religious believers—80% in Kansas, for example. In Mississippi and South Carolina, among the most religious states in America, 83% and 78% of adults, respectively, are Christian. “Megachurches” with huge congregations of over 2,000 people are found throughout the South. Christian doctrine often leaks into public schools as well. In Texas, public school students can enroll in elective courses that teach morality lessons directly from the Bible. 
  • In Utah, over 60% of the population are Mormon, and strict regulations abound in their daily lives. Tea and coffee are banned at all times. Premarital sex is forbidden, as are pornography, masturbation, and homosexual acts. Sabbath Sunday is reserved for worship; working, shopping, eating out, playing sports, or other activities that may involve worldly temptations are not permitted. Bishops privately interview every adult Mormon to assess how well they’ve been adhering to the Mormon way of life and whether they’re worthy of entering the temple. Much like an intelligence-gathering agency, the Mormon Church’s Strengthening Church Members Committee (SCMC) keeps tabs on local Mormons to identify those who may be publicly criticizing the faith or its leadership. When it does, the SCMC promptly notifies the dissenter’s bishop, who may charge the member with apostasy—the abandonment of religious faith.
  • People in loose states are more likely to view themselves as original, curious, deep thinkers, and imaginative—all indications of what is called “trait openness,” as seen below.
  • Not only are loose states more fun, but they’re also more tolerant. Moral codes in loose states emphasize preventing harm to others—a universalistic code that applies to anyone, regardless of their race, language, religion, or creed. 

The Deep South of the United States

  • Differences in tightness-looseness across the 50 states were set in motion by the cultural characteristics of those who settled in different parts of the New World. In the 1700s, when large waves of migrants from northern Ireland and lowland Scotland began arriving in America. These migrants established an early presence around Pennsylvania and then moved southward, settling in states like West Virginia, the Carolinas, Georgia, Tennessee, Oklahoma, and Texas. There these pioneers unpacked their cultural suitcases, which were filled with the social norms and values of their motherlands. As descendants of Celtic herdsmen, they were known for their tight normative codes, which emphasized courage, strength, and a suspicion of outsiders—a combination of characteristics psychologists call a “culture of honor.” These cultural traits proved useful in the treacherous Southern environment they explored, where the threat of losing their livestock in raids from neighboring groups was constant. Given this danger, coupled with a lack of formal law enforcement, the settlers developed tight social norms to enforce cooperation and prevent pilfering. Norms for generosity and respect—which promoted group cohesion—were paramount. Settlers frequently entertained guests to showcase this generosity and to gain honor in the eyes of the community.
  • Despite their generosity and cooperation, these early settlers were ready to inflict quick and violent retribution on wrongdoers. Such demonstrations of valor helped them maintain a reputation for strength that could deter further attacks. Even teasing was considered a major norm violation in the South and could lead to an eruption of violence, particularly if one was insulted in public. These honor cultures spread into the Deep South—areas now known as the states of Louisiana, Mississippi, Alabama, and Georgia—and by 1790, Scotch-Irish settlers constituted the majority of the population of many Southern states. Today, these states are among America’s tightest; they’re where the culture of honor lives on. 
  • Strict norms were designed to control slaves, who outnumbered their masters. Those who tried to run away were to be whipped after a first attempt; after subsequent attempts their punishments escalated to anything from having an ear chopped off, to castration, to having an Achilles tendon severed, to execution. 
  • In the nineteenth century, the American South increasingly felt as though it was being “occupied” by “foreign” troops from the North, which had diametrically opposed views on how the nation should be governed. In 1861, the South and North entered into the bloodiest conflict in the nation’s history with an outcome that only reinforced the South’s tight culture. Southerners saw a need to defend their region’s “peculiar institution,” a euphemism for slavery, as indispensable to their agrarian-based economy. Northern efforts to curtail slavery’s spread, they felt, threatened their lifestyle, and their survival. Clearly, the Southern states that relied the most on slavery had the most to lose from a Union victory. According to this logic, today they should be tighter than Southern states that were less dependent on slave labor. And they are. There is a strong correlation between the percentage rankings of slave-owning families from the 1860 census and state-level tightness today. The tightest Southern states, such as Mississippi, South Carolina, and Georgia, had much higher levels of slave-owning families than did loose states, such as Delaware and Maryland.
  • The South continued as a predominantly agrarian region marked by close-knit tight communities. According to historian Bertram Wyatt-Brown, who authored Southern Honor: Ethics and Behavior in the Old South, medicine, law, the clergy, and the military were the only tolerated non-agriculture professions in the South.
  • Some of the least diverse places in the country today can be found in tight states.

The Northern states

  • The settlers in the northern and western United States couldn’t have been more different. From the outset, the first settlers in these regions were known for religious pluralism and multicultural cohabitation, which we know pushes groups to be loose. Toward the beginning of the seventeenth century, a few decades before the Barbadians arrived in the Deep South, the Dutch (inhabitants of one of the loosest nations today) founded New York as a global trading hub that later attracted immigrants from Poland, Finland, Sweden, Ireland, and Portugal. The New York region attracted people who practiced many different faiths, including Catholics, Anglicans, Puritans, Quakers, and Jews.
  • This loose mentality was later reinforced with the rise of industrialization during the nineteenth century, which made the North more urban and diverse.
  • California became a “start-up state,” luring risk-takers who were willing to make a treacherous journey for a better future on the West Coast. “Here were to be seen people of every nation in all varieties of costume, and speaking 50 different languages, and yet all mixing together amicably and socially,

Loose communities exist within tight states, and vice versa, and tight-loose theory can predict where they’ll take hold. In the tight state of Louisiana lies New Orleans, the historically diverse and cosmopolitan port city that is one of the most permissive in the country,

In tight communities in loose states, and they often display very low diversity. For example, the city of Colorado Springs, nestled in the loose state of Colorado, is almost 80% white.

When groups don’t have to worry about food, water, disease, or invasions, they don’t need as many strict rules to coordinate, and they evolve into more permissive societies. This principle clearly applies to nations, and it plays out in states, too. Mother Nature played a key part in perpetuating tight-loose differences across the U.S. states, and she continues to selectively cast her destructive spell over certain regions. Many of the states that rank high in tightness, for example, were marked by difficult ecological conditions early on. In the nineteenth century, the Dakotas, Nebraska, Kansas, Oklahoma, and several areas westward were inhospitable territories that experienced very little rain. There were few places where agriculture could survive without the help of extensive irrigation projects. The altitude was so high—even the plains and mountain valleys stood above the tallest summits of the Appalachians—that many familiar crops wouldn’t grow at all.

We also tracked where hurricanes hit with available data from 1851 to 2004. It’s clear that a disproportionate number of tight states have gotten clobbered. In the list of over 50 of the deadliest hurricanes that have occurred in U.S. history, around 85% have done their worst damage in the 10 tightest states.

Examining Centers for Disease Control data from 1993 to 2007, we found that vulnerability to common diseases (e.g., malaria, measles, tuberculosis, rubella, typhoid) predicted states’ tightness levels. While tight states such as Louisiana, Mississippi, and South Carolina scored high on pathogens, loose states such as Maine, New Hampshire, and Vermont scored low. Tight states exhibit higher rates of food insecurity, with fewer households having adequate access to food, and they also have less access to clean air. Tight Indiana, for example, has the poorest air quality in the country, followed by Ohio and Kentucky. By comparison, Oregon, Maine, and New Mexico—all loose states—are among the states with the clearest air. Summing up: Where there’s threat, there’s tightness.

Throughout American history, the state of California has been rocked by natural disasters ranging from earthquakes to wildfires to mudslides to heat waves. Yet California is a loose state, for reasons similar to an exception we noted when looking at individual nations—Israel. Thanks to the adventurous immigrants it’s drawn from all around the world, the state boasts tremendous diversity

Communism & the Red Scare.  The first Red Scare was ignited shortly afterward in 1919 by a series of bombs detonated across the country by a few anarchists. These events amped up public fear and paranoia of politically radical groups, and then fear of immigrants and minorities. Laws were passed to deport immigrants, limit free speech, and infringe on the civil rights of suspected communities. After the USSR tested its first nuclear weapon in 1949, Americans feared a nuclear war was imminent and that Soviet spies had infiltrated the U.S. government. A witch hunt against Communists ensued,

When such threats aren’t chronic, a country’s system of norms loosens again. All the restrictions, monitoring, and punishments of the 1950s, for example, gradually gave way to the extreme looseness of the 1960s. During this “decade of change,” the nation witnessed groundbreaking movements that sought to end discrimination toward traditionally marginalized groups—including women, African Americans, and gay Americans—and dismantle many of the country’s long-held social norms and values. As more households acquired television sets, more Americans were exposed to new ideas and places. The following decades ushered in unbridled permissiveness, including greater recreational drug use and sexual promiscuity.

9/11

Fast-forward to September 11, 2001, which unleashed another temporary wave of tightness. Congress introduced 130 new pieces of legislation, created over 260 new government organizations to secure the nation, and spent over $600 billion on homeland security from 2001 to 2011. The Patriot Act, hurriedly drafted and signed a month after the attacks by ninety-eight out of a hundred senators, law enforcement officers were given permission to search homes and businesses without owners’ or occupants’ consent or knowledge.

Tightness-looseness can help account for the astounding political upheavals happening around the globe in the twenty-first century, including British citizens’ 2016 vote to leave the European Union and the success of the Law and Justice Party in Poland’s parliamentary election. Hungary has tightened considerably in recent years due to a different kind of “threat”—primarily Muslim refugees,

Perceived threat—often about terrorism, immigration, and globalization—tightens cultures and catapults autocratic leaders onto the national stage.

Class & Wealth

Class divides have become a front-burner political issue. A 2017 Pew Research survey found that almost 60% of Americans believe there are “very strong” or “strong” conflicts between the rich and poor, up 12% from 2009. Respondents ranked class conflicts ahead of those between the young and the old and city and rural dwellers. This chasm between the haves and have-nots exists around the world.

The chance of falling into destitution is a constant threat among members of the lower class. In her article “The Class Culture Gap,” legal scholar Joan Williams notes that “American working-class families feel themselves on a tightrope where one misstep could lead to a fall into poverty and disorder.” Losing one’s job and any semblance of security is a constant threat for the working class, who often live paycheck to paycheck. Author Joseph Howell similarly notes that slipping into hard living—a term he uses to describe the dregs of poverty—is a relentless preoccupation among the working class that motivates them to vigilantly guard their precarious status. Whereas upper-class individuals experience the world as safe and welcoming, lower-class individuals tend to view it as fraught with extreme danger. And because money can buy second chances, those who have it have a different attitude toward novelty and risk. Upper-class families know that they have a safety net if they run into problems and so they encourage their children to explore and take chances. Because lower-class families lack a safety net to offset the negative effects of careless mistakes and lapses in judgment, they tend to actively discourage this kind of experimentation.

In addition to facing economic uncertainty, the lower class is saddled with serious safety and health threats. Their jobs have much higher odds of injury, dismemberment, and death.  Poorer communities in the United States face more than double the rate of violent crime relative to higher-income communities.  They are also far more likely to be victims of gun violence, robbery, aggravated and simple assault, and sexual assault and rape. The lower class also experiences greater health vulnerabilities throughout their lives relative to their upper-class counterparts, showing higher rates of illnesses such as coronary heart disease, stroke, chronic bronchitis, diabetes, and ulcers. In fact, there’s a staggering 10-15 year difference in the life expectancy rate between the top and bottom 1% in the U.S.

The combination of high threat, low mobility, and low exposure to diversity is a perfect recipe for the evolution of tightness in the lower class.

Lower-class adults were more likely to indicate that they faced stronger rules, harsher punishments, more monitoring, and fewer choices in their childhood home, current workplace, and lives more generally. They also reported that the situations they encounter on a daily basis are much tighter, with fewer behaviors that are deemed acceptable. What’s more, the lower-class participants were more likely to desire a tighter society, as evidenced by their strong agreement with statements like “a functioning society requires strong punishments for wrongdoing.” Put simply, they live in a tighter, circumscribed world, while the upper class experiences considerable looseness. Just like citizens of tight nations and states, the lower class see the world through a prism of threat: They’re more concerned with paying the rent or mortgage, losing their homes and jobs, obtaining proper medical care, and having enough food to eat. They also live in more dangerous places.

The predominant upper-class view of rules is that they’re made to be broken.

For members of the lower class, rules are critical for survival. In communities where teens may be tempted to turn to drugs and gangs, strict rules laid down by authority figures are essential to keeping kids on track. And for people in low-wage, routinized jobs where creativity is discouraged, rule breaking can lead to getting fired.  For the lower class, rules are meant to be followed, as they provide moral order in a world of potential turmoil.

Those in the lower classes were more likely to endorse survey items such as “I like order” and “I enjoy having a clear and structured mode of life” and to report that they “don’t like change” and “prefer to stick with things that [they] know.” They had lower openness to experience, and yearned for the “good old days.” They had a strong distaste for morally ambiguous behaviors, such as euthanasia and drug and alcohol use, and were more likely to view homosexuality as immoral.

In an experiment, lower-class children were more likely to tell others that they were doing a task wrong or cheating.  By contrast, upper-class children appeared to be more understanding and accepting of violating the rules given, sometimes even laughing appreciatively. Even by age three, these more privileged kids thought there was nothing wrong with breaking the rules once in a while.

It turns out that children in different social classes are exposed to radically different types of socialization. The working class has what psychologists call “strict” or “narrow” socialization, and the upper class has “lenient” or “broad” socialization. Lower-class parents stressed the importance of conformity, wanting their children to be obedient and neat. Upper-class parents wanted their kids to have self-direction—to be independent. Kohn also found striking contrasts in parental attitudes about punishment of wrongdoing. Lower-class parents punished their children for disobedience and for the negative consequences of their behavior, regardless of whether it was intentional or accidental. By contrast, not only were upper-class parents less likely to punish their children, but they also chose whether and how to punish based on the intent behind their child’s behavior.

Knowing that their children will likely have to navigate a world of social threat—and work at jobs where they have little discretion—lower-class parents emphasize the importance of conformity to try to help them succeed. After all, not following protocol at work can get one fired or badly hurt. “In the working class, people perform jobs in which they are closely supervised and are required to follow orders and instructions, so parents “bring their children up in a home in which conformity, obedience, and intolerance for back talk are the norm—the same characteristics that make for a good factory worker.” In these contexts, self-direction is actually counterproductive, but it’s a necessary trait for those navigating loose worlds and occupations, hence a trait that upper-class parents foster in their children.

Bernstein also found a fascinating connection between social class and the way that people use language. The working class uses what he calls a “restricted code” form of speech defined by simpler and more concrete grammatical constructions with fewer counterfactual statements (like what if). Meanwhile, the middle class has an “elaborated code” of speech that is more abstract and complex and more flexible.

Children also encounter these structural differences in school. Metaphorically speaking, schools with a predominantly lower-class population are more likely to resemble the military, with their strong emphasis on rules and obedience, whereas schools with upper-class populations resemble universities, with their comparable freedom.

From a very young age, the lives of the children of the lower and upper classes begin to diverge—from the values their parents enforce, to the language they speak, to the structure of their households and schools, even to how they react to Max, the norm-violating puppet. These cultural differences have a profound impact on how these children behave as adults.  When given the opportunity to conform or stand out, lower-class individuals, this study showed, prefer to blend in whereas upper-class individuals prefer to be unique.

Beyond their more reckless driving behavior, people higher in social class take more liberty in violating conversational etiquette.  The loose behavior of upper-class individuals can even make them less ethical. Studies have shown that they’re far more likely to say they’d engage in unethical actions ranging from cheating on a test, to stealing software, to keeping extra change from a cashier. In our surveys of hundreds of people, working-class individuals were less likely to endorse unscrupulous actions like stealing supplies at work or cheating on tests.

We’ve seen that the lower class tends to be tighter—more conforming, norm-abiding, and cooperative—while the upper class is looser—more deviant, less cooperative, and even a bit more unethical.

Psychologist Murray Straus found discrepancies in creativity are inculcated early. He worked with families from different socioeconomic backgrounds and asked them to complete problem-solving tasks while an observer took detailed notes on their ideas. Among the sixty-four American families participating, those with higher socioeconomic status attempted many more creative solutions to the tasks than did families from lower-class backgrounds. The same results were found in India and Puerto Rico. In short, members of the lower class, while more likely to abide by rules and norms and even be more ethical, are less likely to think outside of the box.

In loose nations and states, there’s a high degree of openness and tolerance of individuals who are different, including immigrants, while in tight nations and states, people react more negatively to those who threaten the social order. Remarkably, the same tight-loose signature applies to social class: Studies show that, in general, members of the lower-class report more negative attitudes toward homeless people, homosexuals, Muslims, the disabled, and even people with tattoos.  Women, minorities, and homosexuals have less power and less latitude, and are subjected to stronger punishments, even for the same norm violations. They, in short, live in much tighter worlds.

When women and minorities were said to engage in norm-breaking behaviors, managers thought they warranted more punishment than when the same behaviors were done by majority males. Similarly, a study looking at the financial advisor industry found that although misconduct is more frequent among male employees, women are more likely to be punished, and more severely so [my comment: yea, like Martha Stewart nabbed for insider trading when thousands of men are who usually do this].

African American criminals are punished more harshly and sentenced to more time behind bars than white criminals with comparable histories. In the United States, African Americans are imprisoned at a rate that is five times the imprisonment rate of whites. African Americans are also far more likely to be targeted, brutalized, and killed by police, a phenomenon that prompted the Black Lives Matter.

The pattern is clear: People with different levels of status and power—whether that status and power are based on income, race, gender, sexual orientation, or another individual characteristic—live in different cultural worlds.

While you might expect an American moving to Japan or a German moving to New Zealand to experience culture shock, it may be less evident that someone moving between classes might have just as much trouble adapting. This is particularly the case for members of the working class, who are typically ill-prepared to cross into upper-class schools and workplaces that have been effectively designed to promote looseness. Though it’s often not obvious, the working class is inadvertently put at a cultural disadvantage in these spaces.

One reason poor students do less well in college: The loose norms and openness of many college campuses are comfortable for upper-class students, but they can be disorienting and alienating to students from working-class backgrounds.  Lower-class children, who have grown up in tight environments that emphasize conformity over independence, structure over creativity, and obedience over deviance, are more likely to struggle. For them, attending college, even one close to home, can feel like traveling to a foreign country. By the end of their first semester, lower-class students felt less academically prepared, less successful at making friends, and more stressed out. These students were overwhelmed by the complexity of college life, and yearned for clarity and simplicity. Lower-class students’ alienation on campus translates to a higher likelihood of dropping out.

Class differences are deeply cultural, and the world urgently needs greater cultural empathy across class lines. Arguably, we need this now more than ever. People from different social classes are increasingly isolated from one another, as seen in the growing urban-rural divides around the globe. We tend to further compartmentalize ourselves on social media and follow different media outlets (e.g., Fox News versus MSNBC) as well. As a result, we are left with little understanding of each other’s cultures, which can lead us to form negative stereotypes about one another.

Many of the differences between the lower and upper classes have an underlying logic. Lower-class occupations, including plumbers, butchers, factory workers, janitors, and prison guards, require sophisticated technical and physical skills. They also require the ability to be dependable and follow rules. A tight mind-set is critical for success in these contexts. Meanwhile, upper-class jobs, such as those in law, engineering, medicine, academia, and management, among other white-collar professions, are built on alternative strengths, such as creativity, vision, independence, and even breaking from tradition. These strengths necessitate a looser mind-set. Neither set of strengths should be viewed as superior.

While we may never agree with others’ voting choices, once we know that they stem from our cultural codes, we can at least begin to understand them.

Corporate culture

In 1998, two auto industry giants, Daimler-Benz and Chrysler Corporation, tied the knot. Both companies were deeply enmeshed in their own way of doing business, and their cultural incompatibility soon became apparent. American employees were taught German formalities, such as keeping their hands out of their pockets during professional interactions. German members of Daimler’s team felt uncomfortable when their American counterparts called them by their first names, rather than by their title and last name. And while the Germans wanted thick files of prep work and a strict agenda for their team meetings, Americans approached these gatherings as a time to brainstorm and have unstructured conversations.  Daimler had a top-down, heavily managed, hierarchical structure devoted to precision. As a result, the company’s manufacturing operations were rigid and bureaucratic.

Chrysler, on the other hand, was a looser operation with a more relaxed, freewheeling, and egalitarian business culture. Chrysler also used a leaner production style, which minimized unnecessary personnel and red tape. As these company cultures collided, Daimler faced a decision: compromise or cannibalize. It chose the latter. Daimler CEO Jürgen Schrempp had promised Chrysler CEO Robert Eaton a “merger of equals,” but his actions showed this was an acquisition rather than a merger.

Over time, Daimler dispatched a German to head Chrysler’s U.S. operations, replaced American managers with German ones, and laid off thousands of Chrysler employees, moves that fomented talk of “German invaders.  Trust between these two foreign units became irreparable. Key Chrysler executives left, and after nine years of declines in stock price and employee morale, the transnational pair finally divorced in 2007.

People in loose cultures prefer visionary leaders who are collaborative. They want leaders to advocate for change and empower their workers. “The goal of a leader should be to maximize resistance—in the sense of encouraging disagreement and dissent,” explains Dov Frohman, founder of Intel Israel. “If you aren’t aware that the people in the organization disagree with you, then you are in trouble.

People in tight cultures view effective leaders as those who embody independence and great confidence—that is, as people who like to do things their own way and don’t rely on others.

Just as countries have practical reasons for becoming collectively tighter or looser, so do industries. Tightness abounds in industries that face threat and need seamless coordination. Sectors such as nuclear power plants, hospitals, airlines, police departments, and construction evolve into tight cultures due to their life-or-death stakes.

The military is the iconic example of tightness.  From day one, U.S. Marine recruits endure a punishing boot camp and indoctrination period that turn individual soldiers into one synchronous corps who, above all, respect their leaders.

Zooming in to any specific organization, we can see why certain units evolve to be tight versus loose even in the same organization. Some occupations are inherently more accountable to laws and regulations, even in the absence of physical threat—think lawyers, auditors, bankers, and government officials. These jobs are bound to high standards of professional accountability. As a result, their work unit cultures foster much stronger norms and compliance monitoring.

Without even realizing it, each of us has developed tight and loose mind-sets that effortlessly help us navigate our social surroundings. Far more than a mere mood or even an attitude, a mind-set is like the program we use to make decisions. The tight mind-set involves paying a great deal of attention to social norms, a strong desire to avoid mistakes, a lot of impulse control, and a preference for order and structure. Relishing routine, it requires a keen sensitivity to signs of disorder. The loose mind-set, by contrast, is less attentive to social norms, more willing to take risks, more impulsive, and more comfortable with disorder and ambiguity. These different mind-sets influence our daily lives and relationships in ways that we might not be fully aware.  Environments automatically change our mind-sets—constrained at the symphony; relaxed at the rock concert. Psychologically, this is your mind and body adjusting to the strength of social norms in your surroundings.

If you have a partner, you might see tight-loose tensions play out in different attitudes about religion, savings, or neatness.

Highly structured and rule-bound activities, like playing bridge or doing karate, foster a tight mind-set, whereas more spontaneous and open-ended activities, like painting or hip-hop dancing, foster a loose mind-set.

Species such as bats, dolphins, and even rats use forms of radar to navigate their physical environment. Humans, too, employ a type of radar to detect the social norms and cues that surround them, whether they’re aware of it or not. In fact, a defining quality of tight and loose mind-sets is the strength or weakness of this normative radar. Some people just seem to be oblivious to social norms. We call otherwise intelligent adults who lack normative radar idiots, jerks, or comedians. We all know people who seem completely unaware of social norms. Perhaps it’s a friend who blurts out inappropriate thoughts. Maybe it’s an uncle who tells the same stories over and over.

People with low normative radar have difficulty understanding what is expected of them, and they tend to behave similarly across a wide range of situations. Paying no heed to situational requirements, they act primarily on their own beliefs and desires.

People with high normative radar are quite sensitive to the social norms around them. They’re what psychologist Mark Snyder calls “high self-monitors.” They’re very good at picking up on interpersonal and social expectations, and are likely to behave differently across situations in response to what is considered acceptable.

In a study, participants listen to 20 prerecorded sentences in which a trained actress conveyed different emotions by changing her voice intonations and inflections. The results were striking. People with high normative radar identified the different emotions with great accuracy. Meanwhile, people with low normative radar struggled with the task.

People in tight nations clearly possessed higher normative radar; they’re higher self-monitors and they excel at adapting their behavior to situational requirements. This is a learned trait. In tight countries dominated by strong rules with substantial constraints on acceptable behavior, a keen ability and desire to detect social expectations pays off—if only to avoid punishment. By the same logic, in countries where rules are weaker, and a wider range of behavior is permissible (as at a rock concert), people tend to possess a looser mind-set and lower normative radar.

Other vignettes described a person applauding in a concert versus at a funeral, shouting at the library versus on a city sidewalk, and so on. The brains of participants from both the United States and China registered the norm violations in the central-parietal brain region, which is responsible for processing surprising events. Yet individuals’ neural responses to norm violations varied dramatically. The neurons of Chinese subjects fired with great force in the frontal area of the brain, which helps us think about the intentions of others and make decisions about punishment. Americans, in contrast, showed little response to norm violations in the frontal region. Differences in normative radar, it appears, become deeply embrained.

When norms are strong, we feel a strong sense of accountability—we sense that our actions may be evaluated and even punished if they deviate. When that warning signal goes off, the tight mind-set takes over. Its prime motive is to avoid making mistakes by being vigilant, cautious, and careful. In situations with fewer normative requirements, we have fewer fears about doing the wrong thing. Rather than being driven to avoid mistakes, we set bolder, often riskier goals.

People in tight cultures who have to abide by strong social norms are socialized to be more cautious. They’re more likely to agree with statements such as, “I am very careful to avoid mistakes” and “I choose my words with care,” and they’re also more deliberate in their decision making.  These are learned differences, but they may also have at least some genetic basis.  

A graduate student of mine recalls encountering an arsenal of regulations at her childhood school in Taiyuan, Shanxi. Students had to sit at their desks with their hands behind their backs at all times, could only raise their right hands when they had a question, and had to be completely silent in the school’s corridors. Pupils who acted out faced a range of punishments, such as standing in front of the classroom for the entirety of the class, being excluded from fun school activities, or even being hit with a ruler. Many Chinese schools have strong monitoring systems. Some classrooms even have webcams that continuously broadcast how well children are behaved, with footage being shown to parents and school officials.

Greater activity in the parietal lobe predicted Chinese participants’ greater self-regulation of eating habits and ability to resist temptations such as alcohol, procrastinating, and playing video games.

People with a low tolerance for ambiguity have trouble dealing with people who are unfamiliar or different.  These traits of distaste for ambiguity and prejudice against other ethnic groups appears to be passed on from parents to children very early in life.

Several examples of how couples who have tight and loose tendencies manage to get along are given towards the end of the book.

She concludes that the best societies are a balance of tight and loose, of constraint and freedom, because the extremely tight and extremely loose nations had the lowest levels of happiness, highest levels of suicide, lowest life expectancies, and highest death rates from cardiovascular diseases and diabetes.  These most extreme nations also have higher levels of political instability and the lowest GDP per capita.

When you look at Egypt or the fallen Soviet Union, it seems incredible that ghastly autocrats like Putin took over.  But when a regime that tightly controlled society, no matter how bad, causes society to descend into chaos and crime, people seek security and become vulnerable to fascism and autocrats to restore order. Putin now rules with an iron fist, where protests, online criticism, or advocacy of political or human rights can result in jail or thousands of dollars in fines.  Putin partnered with the Russian Orthodox Church to rally to traditional and family values (my comment: See NOTE 1 at the end).  Many examples of other nations are given as well.

Most worrisome for the postcarbon future is the section titled:  When cultures collapse, Radicalization steps in. It seems like this is already happening in the U.S. (and elsewhere) with right wing extremists & militias, QAnon, hundreds of congressional leaders denying Biden won the election and that Trump was elected.

The book spends the next few pages explaining how ISIS came to be one of the most violent terrorists organizations.

The rise of populist politicians and movements can be explained by the rise of nationalist groups that long for tightness and fighting “loose” globalists.  Hence those who voted for Trump.  In 2016 over 900 hate groups existed in the U.S., a 17% increase over 2014, including neo-Nazi groups, KKK outposts, white nationalist groups, neo-Confederate groups, and skinheads.

NOTE 1

The book “One Nation Under God: How Corporate America Invented Christian America” by Kevin Kruse, tells the history of how corporate America has tried to undo New Deal reforms since the 1940s by creating a new free-enterprise religion, and to erode the separation of church and state.  Corporate America’s creation of free-enterprise Jesus began in 1935 with the founding of an organization called Spiritual Mobilization. 

Some of the corporations who donated money to this and similar organizations include: 

American Cyanamid and chemical corporation, Associated Refineries, AT&T,  Bechtel Corporation, Caterpillar Tractor Company, Chevrolet, Chicago & Southern Airline, Chrysler corporation, Colgate-Palmolive Company, Deering-Milliken, Detroit Edison, Disney, DuPont, Eastern Airlines, General Electric, General Foods, General Motors, Goodwill, Goodyear Tire & Rubber, IBM, J. C. Penney, J. Walter Thompson, Mark A. Hanna, Marriott, Marshall Field, Monsanto Chemical Company, National Association of Manufacturers, Pacific Mutual Life Insurance, Paramount Pictures, PepsiCo, Precision Valve Corp, Quaker Oats, Republic Steel Corp, Richfield Oil Co., San Diego Gas & Electric, Schick Safety Razor, Standard Oil Company, Sun Oil company, Sun shipbuilding company, Union Carbide and Carbon Corporation, United Airlines, US Rubber company, US steel corporation, Utah Power & Light, Warner Bros. Pictures, Weyerhauser.

In the 1930s, corporations were well known to have brought on the Great Depression with their tremendous greed and dishonesty.  The New Deal reformed the financial system, distributed wealth more evenly, provided a social safety net, protected citizens by regulating businesses to prevent them from selling unsafe food, drugs, etc., emitting toxic pollution, aided farmers in slowing soil erosion to prevent more dust bowls, the federal interstate highway system, and other infrastructure and public services that benefited everyone, especially corporations.

The New Deal embodied the ideals of the Social Gospel, a movement dedicated to the public good, economic equality, eradication of poverty, slums, child labor, an unclean environment, inadequate labor unions, poor schools, and war (Wiki Social Gospel).  Corporate America fought against these reforms and has been trying to undo the New Deal ever since then.


Posted in Critical Thinking, Human Nature | Tagged , , , | Comments Off on Book Review: Rule Makers, Rule Breakers: How Tight & Loose Cultures Wire Our World

How corporations used evangelists to gain wealth, power, and undo the New Deal

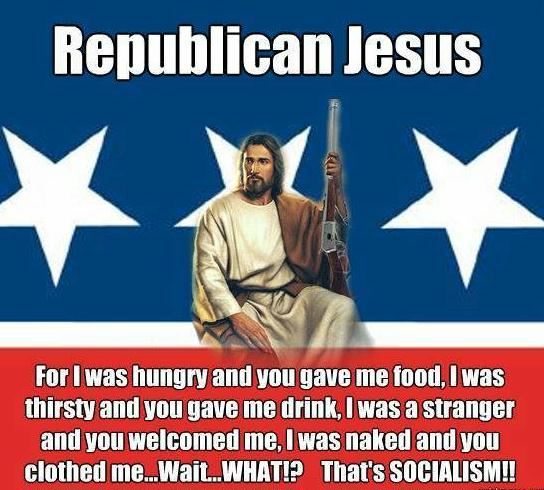
Source: Republican Jesus

Preface. This is a book review of One Nation Under God: How Corporate America Invented Christian America by Kevin Kruse (2016), followed by excerpts from the book.  Much of this introduction is my take on what this all means.

This book tells the history of how corporate America has tried to undo New Deal reforms since the 1940s by creating a new free-enterprise religion, and to erode the separation of church and state.

Corporate America’s creation of free-enterprise Jesus began in 1935 with the founding of an organization called Spiritual Mobilization.  Some of the corporations who donated money to this and similar organizations include:

American Cyanamid and chemical corporation, Associated Refineries, AT&T,  Bechtel Corporation, Caterpillar Tractor Company, Chevrolet, Chicago & Southern Airline, Chrysler corporation, Colgate-Palmolive Company, Deering-Milliken, Detroit Edison, Disney, DuPont, Eastern Airlines, General Electric, General Foods, General Motors, Goodwill, Goodyear Tire & Rubber, IBM, J. C. Penney, J. Walter Thompson, Mark A. Hanna, Marriott, Marshall Field, Monsanto Chemical Company, National Association of Manufacturers, Pacific Mutual Life Insurance, Paramount Pictures, PepsiCo, Precision Valve Corp, Quaker Oats, Republic Steel Corp, Richfield Oil Co., San Diego Gas & Electric, Schick Safety Razor, Standard Oil Company, Sun Oil company, Sun shipbuilding company, Union Carbide and Carbon Corporation, United Airlines, US Rubber company, US steel corporation, Utah Power & Light, Warner Bros. Pictures, Weyerhauser.

In the 1930s, corporations were well known to have brought on the Great Depression with their tremendous greed and dishonesty.  The New Deal reformed the financial system, distributed wealth more evenly, provided a social safety net, protected citizens by regulating businesses to prevent them from selling unsafe food, drugs, etc., emitting toxic pollution, aided farmers in slowing soil erosion to prevent more dust bowls, the federal interstate highway system, and other infrastructure and public services that benefited everyone, especially corporations.

The New Deal embodied the ideals of the Social Gospel, a movement dedicated to the public good, economic equality, eradication of poverty, slums, child labor, an unclean environment, inadequate labor unions, poor schools, and war (Wiki Social Gospel).

Corporate America fought against these reforms and has been trying to undo the New Deal ever since then.

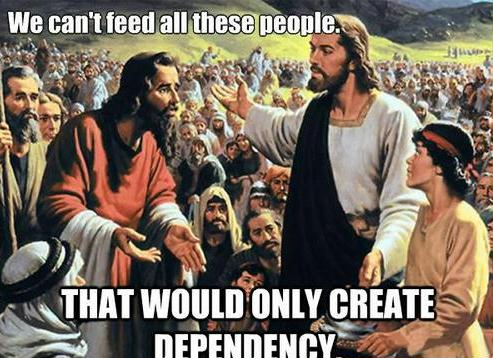
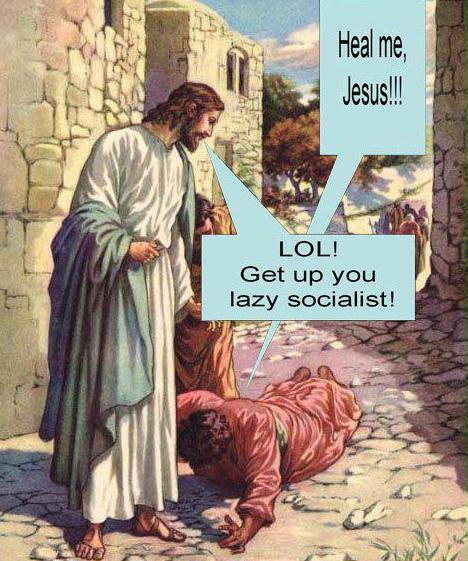
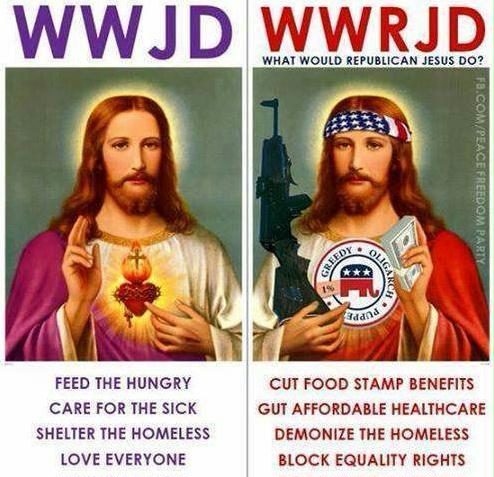
One of their most successful tactics was getting religious leaders to spout a new version of Jesus – replacing the Social Gospel Jesus of the New deal with a Republican free-enterprise, Ayn Rand, selfish Jesus.

At first everyone saw through this propaganda since it was obviously driven by craven self-interest.

So the propaganda was crafted more subtly, and sold to conservative religious leaders via what appeared to be a religious organization called “Spiritual Mobilization” run by minister James Fifield.  Congregations began to hear sermons about the free-enterprise Jesus with open hearts and minds, which they would have laughed at if the speaker were from a corporation. The new religion taught them to detest unions, social welfare, and to fear and hate government.

Later on, capitalist Jesus expanded to the teachings of the evils of food stamps, Obamacare, to be against abortion and birth control (since the more people there are they less they can be paid).  This propaganda came not just from the pulpit, but also conservative religious TV and radio stations.

Recent scholarship has revealed Jesus to be the Social Gospel Jesus of the Democrats in Rex Weyler’s book “The Jesus Sayings: The quest for his authentic message”. Weyler also found that people have been twisting the real Jesus since St. Paul, so Republican manipulation isn’t anything new, it’s been going on for 2000 years.  By looking at the Dead Sea scrolls (found in the last century) and modern scholarship, Weyler found that the most likely Jesus was a man who spent his time helping the poor and encouraged people to turn their spiritual philosophy in to action.  Jesus was a wise and humble teacher, advocating self-awareness and social compassion. The core, genuine message of Jesus includes (Solomon 2008): 1) Give to anyone who asks; knowledge and righteousness are revealed in action, 2) seek spiritual resources within yourself; don’t wait for a deity to solve your problem, and that knowing one’s self is the first step to offering comfort and compassion to the world.

This book shows how the Bible, America’s history, and Constitution were misquoted and misinterpreted to twist Jesus into Capitalist Jesus.

This is why you don’t have a chance of talking Uncle Bob out of voting for demagogues at the Thanksgiving table – you’re attacking his religion and core beliefs he’s been taught since his first sermon, and his brain shuts down in anger.  And he’ll never change because the main and just about only social organization that knits rural American communities together is Church.  If you read enough to doubt right-wing ideology and religious philosophy, you’re going to be a very lonely and perhaps even outcast person.

People like to say that capitalism is imperfect, but it’s the best system that exists.  Well, I’ll agree that free-enterprise is better at raping, pillaging, and poisoning land, water, and air more quickly than any other system.  Just look at how industrial farming is depleting aquifers and eroding and compacting top soil to the point where it won’t produce much food after just centuries rather than the average of 1,500 years in past civilizations (Montgomery 2007).

If Capitalism is so great, why are Social Gospel nations like Denmark, Iceland, Norway, Sweden, the Netherlands, and Canada consistently ranked the happiest nations in the world as well as high in the per capita nominal GDP rankings? Socialist Cuba did far better than other nations when their fossil fuels were suddenly cut, with Russia coming in second.

Alice Friedemann  www.energyskeptic.com  Author of Life After Fossil Fuels: A Reality Check on Alternative Energy; When Trucks Stop Running: Energy and the Future of Transportation”, Barriers to Making Algal Biofuels, & “Crunch! Whole Grain Artisan Chips and Crackers”.  Women in ecology  Podcasts: WGBH, Financial Sense, Jore, Planet: Critical, Crazy Town, Collapse Chronicles, Derrick Jensen, Practical Prepping, Kunstler 253 &278, Peak Prosperity,  Index of best energyskeptic posts

***

One Nation Under God: How Corporate America Invented Christian America by Kevin Kruse 2016

This book argues the postwar revolution in America’s religious identity had its roots in the domestic politics of the 1930s and early 1940s.

Decades before Eisenhower’s inaugural prayers, corporate titans enlisted conservative clergymen in an effort to promote new political arguments embodied in the phrase “freedom under God.”

As the private correspondence and public claims of the men leading this charge make clear, this new ideology was designed to defeat the state power its architects feared most—not the Soviet regime in Moscow, but Franklin D. Roosevelt’s New Deal administration in Washington. With ample funding from major corporations, prominent industrialists, and business lobbies such as the National Association of Manufacturers and the US Chamber of Commerce in the 1930s and 1940s, these new evangelists for free enterprise promoted a vision best characterized as “Christian libertarianism.

By the late 1940s and early 1950s, this ideology had won converts including religious leaders such as Billy Graham and Abraham Vereide and conservative icons ranging from former president Herbert Hoover to future president Ronald Reagan. The new conflation of faith, freedom, and free enterprise then moved to center stage in the 1950s under Eisenhower’s watch.

Though his administration gave religion an unprecedented role in the public sphere, it essentially echoed and amplified the work of countless private organizations and ordinary citizens who had already been active in the same cause.

Corporate leaders remained central. Leading industrialists and large business organizations bankrolled major efforts to promote the role of religion in public life. The top advertising agency of the age, the J. Walter Thompson Company, encouraged Americans to attend churches and synagogues through an unprecedented “Religion in American Life” ad campaign.

Inundated with urgent calls to embrace faith, Americans did just that. The percentage of Americans who claimed membership in a church had been fairly low across the 19th century, increasing from just 16% in 1850 to 36% in 1900. In the early decades of the 20th century the percentages plateaued, remaining at 43% in both 1910 and 1920, then moving up slightly to 47% in 1930 and 49% in 1940. In the decade and a half after the Second World War, however, the percentage of Americans who belonged to a church or synagogue suddenly soared, reaching 57% in 1950 and then peaking at 69% at the end of the decade, an all-time high.

While this religious revival was remarkable, the almost complete lack of opposition to it was even more so. A few clergymen complained that the new public forms of faith seemed a bit superficial, but they ultimately approved of anything that encouraged church attendance.

IN DECEMBER 1940, MORE THAN 5,000 industrialists from across America took part in their yearly pilgrimage to Park Avenue. For three days every winter, the posh Waldorf-Astoria Hotel welcomed them for the annual meeting of the National Association of Manufacturers (NAM). Tucked away near the end of the program was a name that few knew upon arrival but everyone would be talking about by the week’s end: Reverend James W. Fifield Jr.

Ordinarily, a Congregationalist minister might not have seemed well suited to address the corporate luminaries assembled at the Waldorf-Astoria. But his appearance had been years in the making. For much of the 1930s, organizations such as NAM had been searching in vain for ways to rehabilitate a public image that had been destroyed in the crash and defamed by the New Deal. In 1934, a new generation of conservative industrialists took over NAM with a promise to “serve the purposes of business salvation.” “The public does not understand industry,” one of them argued, “because industry itself has made no effort to tell its story; to show the people of this country that our high living standards have risen almost altogether from the civilization which industrial activity has set up.” Accordingly, NAM dedicated itself to spreading the gospel of free enterprise, through a wide array of films, radio programs, advertisements, direct mail, a speakers bureau, and a press service that provided ready-made editorials and news stories for 7,500 local newspapers. By 1937 the organization devoted $793,043 to the cause, more than half its total income that year. Seeking to repair the image of industrialists, NAM promoted the values of free enterprise

Its efforts at self-promotion were seen as precisely that. As one observer noted, “Throughout the 30s, the corporate campaign was marred by extremist, overt attacks on the unions and the New Deal that it was easy for critics to dismiss the entire effort as mere propaganda.

While established business lobbies such as NAM had been unable to sell free enterprise effectively in the Depression, neither had the many new organizations created specifically for that purpose. The most prominent, the American Liberty League formed in 1934 to “teach the necessity of respect for the rights of persons and property” and “the duty of government to encourage and protect individual and group initiative and enterprise.” It benefited from generous financial support from corporate titans, particularly at DuPont and General Motors. But their prominence inadvertently crippled its effectiveness, as the Liberty League was easily dismissed as a collection of tycoons looking out for their own self-interest. Jim Farley, chairman of the Democratic Party, joked that it really ought to be called the “American Cellophane League” because “first, it’s a DuPont product and second, you can see right through it.” Even the president took his shots. “It has been said that there are two great Commandments—one is to love God, and the other to love your neighbor,” Franklin D. Roosevelt noted soon after its creation. “The two particular tenets of this new organization say you shall love God and then forget your neighbor.” Off the record, he joked that the name of the god they worshiped seemed to be “Property”.

In introducing the New Deal, Roosevelt and his allies revived the old language of the so-called Social Gospel to justify the creation of the modern welfare state. The original proponents of the Social Gospel, back in the late 19th century, had significantly reframed Christianity as a faith concerned less with personal salvation and more with the public good. They rallied popular support for Progressive Era reforms in the early 20th century before fading from public view in the conservative 1920s. But the economic crash and the widespread suffering of the Great Depression brought them back into vogue. When Roosevelt launched the New Deal, an array of politically liberal clergymen championed his proposal for a vast welfare state as simply “the Christian thing to do.” His administration’s efforts to regulate the economy and address the excesses of corporate America were singled out for praise. Catholic and Protestant leaders hailed the “ethical and human significance” of New Deal measures, which they said merely “incorporated into law some of the social ideas and principles for which our religious organizations have stood for many years.” The head of the Federal Council of Churches, for instance, claimed the New Deal embodied basic Christian principles such as the “significance of daily bread, shelter, and security.

Throughout the 1930s, the nation’s industrialists tried to counter the selflessness of the Social Gospel with direct appeals to Americans’ self-interest but had little success.

Accordingly, at the Waldorf-Astoria in December 1940, NAM president H. W. Prentis proposed that they try to beat Roosevelt at his own game. With wispy white hair and a weak chin, the 56-year-old head of the Armstrong Cork Company seemed an unlikely star. But 18 months earlier, the Pennsylvanian had electrified the business world with a speech to the US Chamber of Commerce that called for the recruitment of religion in the public relations war against the New Deal. “Economic facts are important, but they will never check the virus of collectivism,” Prentis warned; “the only antidote is a revival of American patriotism and religious faith.” The speech thrilled the Chamber and propelled Prentis to the top ranks of NAM. His presidential address at the Waldorf-Astoria was anticipated as a major national event, heavily promoted in advance by the Wall Street Journal and broadcast live over both ABC and CBS radio. Again, Prentis urged the assembled businessmen to emphasize faith in their public relations campaigns. “We must give attention to those things more cherished than material wealth and physical security,” he asserted. “We must give more attention to intellectual leadership and a strengthening of the spiritual concept that underlies our American way of life.

Fifield delivered a passionate defense of the American system of free enterprise and a withering assault on its perceived enemies in government. Decrying the New Deal’s “encroachment upon our American freedoms,” the minister listed a litany of sins committed by the Roosevelt administration, ranging from its devaluation of currency to its disrespect for the Supreme Court. He denounced the “rising costs of government and the multitude of federal agencies attached to the executive branch” and warned ominously of “the menace of autocracy approaching through bureaucracy.” His audience of executives was stunned. Over the preceding decade, these titans of industry had been told, time and time again, that they were to blame for the nation’s downfall.

Fifield, in contrast, insisted that they were the source of its salvation.

Minister Fifield convinced the industrialists that clergymen could be the means of regaining the upper hand in their war with Roosevelt in the coming years. As men of God, they could give voice to the same conservative complaints as business leaders, but without any suspicion that they were motivated solely by self-interest. In doing so, they could push back against claims that business had somehow sinned and the welfare state was doing God’s work.

Conservative clergymen now used their ministerial authority to argue, quite explicitly, that New Dealers were the ones violating the Ten Commandments. In countless sermons, speeches, and articles issued in the months and years after Fifield’s address, these ministers claimed that the Democratic administration made a “false idol” of the federal government, leading Americans to worship it over the Almighty; that it caused Americans to covet what the wealthy possessed and seek to steal it from them; and that, ultimately, it bore false witness in making wild claims about what it could never truly accomplish.

Above all, they insisted that the welfare state was not a means to implement Christ’s teachings about caring for the poor and the needy, but rather a perversion of Christian doctrine. In a forceful rejection of the public service themes of the Social Gospel, they argued that the central tenet of Christianity remained the salvation of the individual. If any political and economic system fit with the religious teachings of Christ, it would have to be rooted in a similarly individualistic ethos. Nothing better exemplified such values, they insisted, than the capitalist system of free enterprise.

He and his colleagues devoted themselves to fighting back against the government forces that they believed were threatening capitalism and, by extension, Christianity. In the early postwar era, their activities helped reshape the national debate about the proper functions of the federal government, the political influence of corporations, and the role of religion in national life.

Fifield had watched in alarm as Roosevelt convinced vast majorities of Americans that unfettered capitalism had crippled the nation and that the federal government now needed to play an important new role in regulating the free market’s risks and redistributing its rewards. For Fifield and his flock, Roosevelt’s actions violated not just the Constitution but the natural order of things.

The New Deal undermined the spirit of Christianity and demanded a response from Christ’s representatives on earth. “If, with Jesus, we believe in the sacredness of individual personalities, then our leadership responsibility is very plain.” This duty was “not an easy one,” he cautioned. “We may be called unpatriotic and accused of ‘selling out,’ but so was Jesus.” Finding the leaflet to his liking, Hoover sent Fifield a warm note of appreciation and urged him to press on.

Though they had hoped to destroy the Roosevelt administration themselves, its wounds were largely self-inflicted. In 1937, the president’s labor allies launched a series of sit-down strikes that secured union recognition at corporations such as General Motors and US Steel but also roused sympathy for seemingly beleaguered businessmen. At the same time, Roosevelt overreached with his proposal to “pack” the Supreme Court with new justices, a move that played into the hands of those who sought to portray him as dictatorial in intent. Most significant, though, was his ill-fated decision to rein in federal spending in an effort to balance the budget. The impressive economic recovery of Roosevelt’s first term suddenly stalled, and the country entered a short but sharp recession in the winter of 1937–1938.

As the New Deal faltered, Fifield began to look forward to the next presidential election—in “the critical year 1940”—when conservatives might finally rout the architects of the regulatory state. To his dismay, international tensions soon marginalized domestic politics and prompted the country to rally around Roosevelt again.

As the distraction of the foreign war drew to a close, Fifield looked forward to renewing the fight against the New Deal. The minister now counted on the support of not just Hoover but an impressive array of conservative figures in politics, business, and religion. The advisory committee for Spiritual Mobilization’s wartime pledge was, in the words of one observer, “a who’s who of the conservative establishment.” At mid-decade, its 24-man roster included three past or present presidents of the US Chamber of Commerce, a leading Wall Street analyst, a prominent economist at the American Banking Association, the founder of the National Small Businessmen’s Association,

Senator Albert Hawkes agreed. “After careful examination of the records during the past ten years, one can only conclude that there is the objective of the assumption of greater power and control by the government over individual life. If these policies continue,” he warned, “they will lead to state direction and control of all the lives of our citizens. That is the goal of Federal planners. That is NOT the desire of the American people!

In February 1945, Haake explained to Pew why the NAM campaign to ministers and others like it had all failed. “Of the approximately 30 preachers to whom I have thus far talked, I have yet to find one who is unqualifiedly impressed,” Haake reported. “One of the men put it almost typically for the rest when he said: ‘The careful preparation and framework for the meetings to which we are brought is too apparent. We cannot help but see that it is expertly designed propaganda and that there must be big money behind it.

If industrialists wanted to convince clergymen to side with them, they would need a subtler approach. Rather than simply treating ministers as a passive audience to be persuaded, Haake argued, they should involve them actively in the cause as participants. The first step would be making ministers realize that they too had something to fear from the growth of government. “The religious leaders must be helped to discover that their callings are threatened,” Haake argued, by realizing that the “collectivism” of the New Deal, “with the glorification of the state, is really a denial of God.” Once they were thus alarmed, they would readily join Spiritual Mobilization as its representatives and could then be organized more effectively into a force for change both locally and nationally.

With the new financial support and sense of direction, Spiritual Mobilization underwent a massive overhaul. In February 1947, Fifield reported that he had already reached their goal for “the signing of 10,000 ministers as representatives.” This national network of clergymen would be the primary channel through which the work and writings of Spiritual Mobilization would flow. In a new monthly publication that bore the organization’s name, Fifield ran a column—with the businesslike heading “Director to Representatives”—devoted to marshaling these ministers to achieve their common goal of defeating the New Deal. Fifield repeatedly warned them that the growth of government had crippled not only individual initiative but personal morality as well. “It is time to exalt the dignity of individual man as a child of God, to exalt Jesus’ concept of man’s sacredness and to rebuild a moral fabric based on such irreducibles as the Ten Commandments,” he urged his minister-representatives.

Clergymen responded enthusiastically. Many ministers wrote the Los Angeles office to request copies of Friedrich Hayek’s libertarian treatise The Road to Serfdom and anti–New Deal tracts by Herbert Hoover and libertarian author Garet Garrett, all of which had been advertised in Spiritual Mobilization. Some sought reprints of the bulletin itself.

Fifield’s backers in the Businessmen’s Advisory Committee were so pleased with his progress that they nearly doubled the annual budget. To raise funds, its members secured sizable donations from their own companies and personal accounts and, more important, reached out to colleagues across the corporate world for their donations as well. Pew once again set the pace, soliciting donations from officials at 158 corporations. “A large percentage of ministers in this country are completely ignorant of economic matters and have used their pulpits for the purpose of disseminating socialistic and totalitarian doctrines,” he wrote in his appeal. “Much has already been accomplished in the education of these ministers, but a great deal more is left to be done.” Many of the corporations he contacted—including General Motors, Chrysler, Republic Steel, National Steel, International Harvester, Firestone Tire and Rubber, Sun Oil, Gulf Oil, Standard Oil of New Jersey, and Colgate-Palmolive-Peet—were already contributing the maximum allowable annual donation. Other leading businesses, from US Steel to the National Cash Register Company, had donated in the past, but Pew hoped they would commit to the limit as well. Recognizing that there were many conservative groups out there “fighting for our American way of life,” Pew assured a colleague in the oil industry that Spiritual Mobilization deserved to be “at the top of the list” when it came time to donate, “because recent polls indicated that of all the groups in America, the ministers had more to do with molding public opinion.

“According to my book there are five principal issues before the country: The socialization of industry, the socialization of medicine, the socialization of education, the socialization of labor, and the socialization of security,” he noted. “Only through education and the pressure which the people exert on their politicians can we hope to prevent this country from becoming a totalitarian state.

Fifield’s financial backers helped secure free airtime for these programs across the nation. “Republic Steel is taking steps to get them on radio stations in every town where they have a factory or office,” Fifield noted in March 1949. “We are expecting to be on 150 radio stations by June.” A year later, The Freedom Story was broadcast on a weekly network of over 500 stations; by late 1951, it aired on more than 800.

Fifield’s journal purposely presented itself as created by ministers for ministers. Spiritual Mobilization had long operated on the principle that clergymen could not be swayed through crude propaganda. “The articulation should be worked out before-hand, of course, and we should be ready to help the thinking of the ministers on it,” Haake noted in one of his early musings on Spiritual Mobilization, “but it should be so done as to enable them to discover it for themselves, as something which they really had believed but not realized fully until our questions brought it out so clearly. I am sure we may not TELL them: not as laymen, or even as fellow clergymen. We must help them to discover it themselves.

Faith and Freedom thus presented itself as an open forum in which ministers could debate a wide variety of issues and disagree freely. But there was an important catch. “Clergymen may differ about politics, economics, sociology, and such,” Fifield stated, “but I would expect that in matters of morality all followers of Jesus speak in one voice.” Because Fifield and Johnson insisted that morality directly informed politics and economics, they were able to cast those who disagreed with them on those topics as essentially immoral

Time and time again, he condemned a variety of “socialistic laws,” such as ones supporting minimum wages, price controls, Social Security pensions for the elderly, unemployment insurance, veterans’ benefits, and the like, as well as a wide range of federal taxation that he deemed to be “tyrannical” in nature.

As the Fourth of July drew near, the Committee to Proclaim Liberty focused its attention on encouraging Americans to mark the holiday with public readings of the preamble to the Declaration of Independence. The decision to focus solely on the preamble was in some ways a natural one, as its passages were certainly the most famous and lyrical in the document. But doing so also allowed organizers to reframe the Declaration as a purely libertarian manifesto, dedicated to the removal of an oppressive government. Those who read the entire document would have discovered, to the consternation of the committee, that the founding fathers followed the high-flown prose of the preamble with a long list of grievances about the absence of government and rule of law in the colonies. Among other things, they lambasted King George III for refusing “his Assent to Laws, the most wholesome and necessary for the public good,” for forbidding his governors from passing “Laws of immediate and pressing importance,” for dissolving the legislative bodies in the colonies, and for generally enabling a state of anarchy that exposed colonists to “all the dangers of invasion from without, and convulsions within.” In the end, the Declaration was not a rejection of government power in general but rather a condemnation of the British crown for depriving the colonists of the government they needed. In order to reframe the Declaration as something rather different, the Committee to Proclaim Liberty had to edit out much of the document they claimed to champion.

“. . . That to secure these rights, governments are instituted among men . . .” Here is the reason for and the purpose of government. Government is but a servant—not a master—not a giver of anything. “. . . deriving their just powers from the consent of the governed . . .” In America, the government may assume only the powers you allow it to have. It may assume no others. The ad urged readers to make their own declaration of independence in 1951. “Declare that government is responsible TO you—rather than FOR you,” it continued. “Declare that freedom is more important to you than ‘security’ or ‘survival.’

“The effort to establish socialism in our country has probably progressed farther than most of us fully realize,” asserted a Lutheran minister in Kansas. “It would be well to remember that every act or law passed by which the government promises to ‘give’ us something is a step in the direction of socialism.” A clergyman from Brooklyn agreed. “Today our homes are built for us, financed for us, and the church is provided for us. Our many services are in danger of robbing us of that which is most important,” he warned, “the right to our own kingdom of self.

Americans had learned that the Soviet Union now had the atomic bomb. The energetic young Graham seized on the headlines to make the Armageddon foretold in the New Testament seem imminent. “Communism,” he thundered, “has decided against God, against Christ, against the Bible, and against all religion. Communism is not only an economic interpretation of life—communism is a religion that is inspired, directed, and motivated by the Devil himself who has declared war against Almighty God.” He urged his audience to get religion not simply for their own salvation but for the salvation of their city and country. Without “an old-fashioned revival,” he warned, “we cannot last!

Three important movements in the 1940s and early 1950s—the prayer breakfast meetings of Abraham Vereide, Graham’s evangelical revivals, and the presidential campaign of Dwight D. Eisenhower—encouraged the spread of public prayer as a political development whose means and motives were distinct from the drama of the Cold War. Working in lockstep to advance Christian libertarianism, these three movements effectively harnessed Cold War anxieties for an already established campaign against the New Deal.

Graham was the most prominent of the new Christian libertarians, a charismatic figure who spread the ideas of forerunners such as Fifield to even broader audiences. In 1954, Graham offered his thoughts on the relationship between Christianity and capitalism in Nation’s Business, the magazine of the US Chamber of Commerce. “We have the suggestion from Scripture itself that faith and business, properly blended, can be a happy, wholesome, and even profitable mixture,” he observed. “Wise men are finding out that the words of the Nazarene: ‘Seek ye first the kingdom of God and His righteousness, and all these things shall be added unto you’ were more than the mere rantings of a popular mystic; they embodied a practical, workable philosophy which actually pays off in happiness and peace of mind. . . . Thousands of businessmen have discovered the satisfaction of having God as a working partner.

Graham’s warm embrace of business contrasted sharply with the cold shoulder he gave organized labor. The Garden of Eden, he told a rally in 1952, was a paradise with “no union dues, no labor leaders, no snakes, no disease.” The minister insisted that a truly Christian worker “would not stoop to take unfair advantage” of his employer by ganging up against him in a union. Strikes, in his mind, were inherently selfish and sinful.  If workers wanted salvation, they needed to put aside such thoughts and devote themselves to their employers.

On Labor Day that same year, he warned that “certain labor leaders would like to outlaw religion, disregard God, the church, and the Bible,” and he suggested that their rank and file were wholly composed of the unchurched.

His hostility to organized labor was matched by his dislike of government involvement in the economy, which he invariably condemned as “socialism.” Graham warned that “government restrictions” in the realm of free enterprise threatened “freedom of opportunity” in America.

Graham’s thoughts on the dangers of socialism became a bit of an international scandal after the Billy Graham Evangelical Association sent followers a free calendar. A page on England noted that “when the war ended a sense of frustration and disillusionment gripped England and what Hitler’s bombs could not do, socialism with its accompanying evils shortly accomplished. England’s historic faith faltered. The churches still standing were gradually emptied.” Learning of the slight, a columnist for the London Daily Herald denounced Graham with a new nickname: “the Big Business evangelist.

As preachers like Billy Graham helped to popularize public prayer, they thus managed to politicize it as well. They shared the Christian libertarian sensibilities of Spiritual Mobilization but were able to spread that gospel in much subtler—and much more effective—ways than that organization ever could. At the same time, their work helped to democratize the phenomenon of public prayer.

Congressional breakfast meetings quickly became a fixture on Capitol Hill. Each month, Vereide printed a program to guide the groups in their morning meditations, offering specific readings from Scripture and providing questions for discussion. The groups were officially nonpartisan, welcoming Republicans and Democrats alike, but that was not to say they were apolitical. Most of the Democratic members of the House breakfast group, for instance, were conservative southerners who held federal power and the activism of the New Deal state in as much contempt as the average Republican did. Political overtones were lightly drawn but present nonetheless. “The domestic and the world conflict is the physical expression of a perverted mental, moral and spiritual condition,” noted a program for a House session. “We need to repent from our unworkable way and pray.” The congressional prayer meetings gave Vereide immediate access to the nation’s political elite.

Having won over political leaders in Washington, D.C., Vereide used their influence to establish even more breakfast groups across the nation. The minister pressed ahead in his drive to give the organization an international presence, with quick success. Within a few years, Christian Leadership breakfast groups were meeting regularly in 31 foreign countries. England, France, West Germany, the Netherlands, and Finland represented the bulk of the initial growth of the group, but the ICCL made its presence felt in nations as varied as China, South Africa, and Canada, with isolated operations in localities such as Havana and Mexico City as well. Vereide recognized that the tensions of the Cold War could be exploited to win more converts to his cause.

The earthy Richardson had little use for Graham’s religion, but the two shared a common faith in free enterprise. “When Graham speaks of ‘the American way of life,’” an early biographer noted, “he has in mind the same combination of economic and political freedom that the National Association of Manufacturers, the United States Chamber of Commerce, and the Wall Street Journal do when they use the phrase.

He chided Democrats for wasting money on the welfare state at home and the Marshall Plan abroad. “The whole Western world is begging for more dollars,” he noted that fall, but “the barrel is almost empty. When it is empty—what then?” He insisted that the poor in other nations, like those in his own, needed no government assistance. “Their greatest need is not more money, food, or even medicine; it is Christ.

Graham led prayer meetings all over town, including daily sessions in the Pentagon auditorium. On Monday mornings, he held “Pastor’s Workshops” with local clergymen; on Tuesdays, there were luncheons at the Hotel Statler to discuss religion with “the men who have so much a part in shaping the destiny of the Capital of Western Civilization: the business men of Washington.

EISENHOWER SEEMED AN UNLIKELY CANDIDATE to lead the nation to spiritual reawakening. For decades he had remained distant from religion and could not even claim a specific denominational affiliation. His grandfather had been a minister for the River Brethren, an offshoot of the Mennonites, and his father maintained that faith.

While he lacked ties to any specific denomination, Eisenhower remained firmly committed to the Bible itself. Like his parents, he considered it an unparalleled resource. One of his aides during the Second World War remembered that Eisenhower could “quote Scripture by the yard,” using it to punctuate points made at staff meetings.

Graham’s spiritual support was surely influential in the general’s decision, as was the financial support Richardson promised. Once Eisenhower announced his intentions, the oilman put his vast fortune to work for him. Richardson’s direct contribution to the campaign was reportedly $1 million, but he also paid for roughly $200,000 in expenses at the Commodore Hotel in New York, where the general had established offices after returning home, and then covered most of his expenditures during the Republican National Convention in Chicago as well.

Eisenhower condemned a set of “evils which can ultimately throttle free government,” which he identified as labor unrest, runaway inflation, “excessive taxation,” and the “ceaseless expansion” of the federal government. These were commonplace conservative positions, but Eisenhower presented them in religious language that elevated them for his audience.

Faith and Freedom followed the lead of Graham and Vereide, claiming it would never endorse one party or the other. But it offered a “political checklist for Christians” that nudged readers rather strongly toward the Republicans.

He took more than 55% of the popular vote, with even more impressive margins in the Electoral College, where he won 442 to 89. Stevenson only managed to win nine states.

Reflecting on the election returns, Eisenhower resolved to put that mandate in the service of a national religious revival. He asked Graham to meet with him in the suite Sid Richardson had provided at the Commodore Hotel in New York, to discuss plans for his inauguration and beyond. “I think one of the reasons I was elected was to help lead this country spiritually,” the president-elect confided.

“These days I seem to have no trouble filling my calendar,” the president-elect told them. “But this is one engagement that I requested. I wanted to come and do my best to tell those people who are my friends, who are supporters of the idea that is represented in the foundation, how deeply I believe that they are serving America.” The basic idea of the Freedoms Foundation was that those who promoted “a better understanding of the American way of life” should be singled out for awards and attention, especially those who celebrated the central role played by “the American free enterprise system” in making the nation great. Fittingly, for an organization devoted to the promotion of big business, its president was Don Belding, head of a national advertising agency whose clients included Walt Disney and Howard Hughes. The board of directors, meanwhile, included leaders at General Foods, Maytag, Republic Steel, Sherwin Williams, Union Carbide and Carbon, and US Rubber, as well as individuals such as Sid Richardson and Mrs. J. Howard Pew. The corporate presence was so pronounced that one honoree sent his award back, grumbling that the Freedoms Foundation was “just another group promoting the propaganda of the National Association of Manufacturers.

More than any other individual, Senator Frank Carlson deserved credit for creating the National Prayer Breakfast. An outspoken opponent of the New Deal, he denounced Franklin Roosevelt as the “destroyer of human rights and freedom” for his administration’s interventions in the economy. He held Harry Truman in similar contempt. “Little Caesars walk the highways of our nation, trying to tell us what to wear, eat, plant, sow and reap,” Carlson complained in 1947.

As Eisenhower’s cabinet focused its attention on spiritual rewards yet to come, its members faced the danger that the press and the public might focus more on the earthly riches they had already amassed. Secretary of Defense Charles Wilson had been the country’s highest-paid executive as president of General Motors, the world’s largest private corporation. Wilson’s initial refusal to divest his holdings in the corporation, which had nearly $5 billion worth of contracts with the same federal department he would now lead, had delayed his confirmation and tarnished his image. When asked whether his GM holdings would tempt him to favor his corporation over his nation, Wilson famously answered that he always thought “what was good for our country was good for General Motors, and vice versa.” The auto tycoon eventually agreed to release his shares, but he was not the only top Defense Department official whose business associations gave the appearance of impropriety. Deputy Secretary Roger Kyes had been in charge of procurement for General Motors; Secretary of the Army Robert Ten Broeck Stevens’s family textile company made uniforms for that branch of the military; Secretary of the Air Force Harold Talbott had ties to both Chrysler and North American Aviation; and Secretary of the Navy Robert Anderson—put in the post at Sid Richardson’s recommendation—had previously managed a major facility for Associated Refineries.

Though he attracted a considerable deal of scrutiny, Wilson was by no means the only corporate titan in the Eisenhower cabinet. Treasury Secretary George Humphrey, for instance, had long served as president of the Mark A. Hanna Company of Cleveland, a sprawling conglomerate with interests in coal, oil, natural gas, iron, steel, copper, rayon, plastics, shipping, and banking. Commerce Secretary Sinclair Weeks, a New England financier and banker, was such a zealous advocate for business that Eisenhower privately worried that he “seems so completely conservative in his views that at times he seems to be illogical.” Postmaster General Arthur Summerfield ran one of the nation’s largest automobile agencies but also found success in real estate, oil, and insurance, while Hobby had made her fortune as a Texas newspaper publisher. Although not businessmen themselves, both Dulles and Brownell had close ties to the corporate world from their time at two of New York’s oldest law firms; Dulles had reportedly earned more in billings than any other corporate attorney in America.

Business leaders, of course, had long been working to “merchandise” themselves through the appropriation of religion. In organizations such as Spiritual Mobilization, the prayer breakfast groups, and the Freedoms Foundation, they had linked capitalism and Christianity and, at the same time, likened the welfare state to godless paganism.

After decades of work, these businessmen believed their efforts had finally paid off with the election of Dwight Eisenhower. Watching him enthusiastically embrace public faith, these supporters assumed that the national religious revival was largely a means to a more important end: the rollback of the New Deal state. But they soon realized that, for all his sympathies for and associations with business leaders, Eisenhower saw the religious revival itself as his essential domestic duty. To their amazement, once in office he gave relatively little thought to the political and economic causes that his backers had always seen as the real reason for that revival.

He refused to go further, especially when it came to the welfare state that his supporters had long worked to destroy. Despite his personal sympathies with their position, the president believed “the mass of the people” disagreed. “Should any political party attempt to abolish social security, unemployment insurance, and eliminate labor laws and farm programs, you would not hear of that party again in our political history,” he warned. “There is a tiny splinter group, of course, that believes you can do these things. Among them are H. L. Hunt . . . , a few other Texas oil millionaires, and an occasional politician or business man from other areas. Their number is negligible and they are stupid.

Even though Eisenhower’s rise to power had depended on support from “Texas oil millionaires” such as Sid Richardson, he refused to roll back the welfare state they despised. In fundamental ways, he ensured the longevity of the New Deal, giving a bipartisan stamp of approval to its continuation and significantly expanding its reach. Notably, Eisenhower pushed Congress to extend Social Security coverage to another ten million Americans and increase benefits as well. In his first term, the president repeatedly resisted calls from conservatives to cut education spending; in his second, he secured an additional $1 billion for the cause. On a much larger scale, Eisenhower established the single largest public works project in American history with the interstate highway system, but did little to bring down tax rates for the wealthy; the top bracket barely dipped, declining from 94% to 92% over the course of his two terms in office.

For conservatives who had assumed that the success of “under-God consciousness” during the Eisenhower administration would naturally lead to tangible reductions in the welfare state, his time in office was a disappointment.

The National Association of Evangelicals (NAE) praised the president for the pious example he had set.

As with earlier drives to supplant the secular authority of the welfare state with the higher power of the Almighty, the Seven Divine Freedoms ultimately served an earthly purpose. Organizers made the political aims of the project explicit in their plans. “There is a growing realization that the enemies of freedom are not foreign powers,” observed R. L. Decker, the NAE’s executive director, “but that there are forces at work within the nation which are just as dangerous and more sinister than any foreign foe. These forces take advantage of the natural desires of the people for unity and security and material prosperity to propose panaceas for our social, economic, and political problems which, if accepted, would rob us of our freedom as effectively as defeat in warfare,” he continued.

The group would encourage public and private leaders to sign the “Statement of Seven Divine Freedoms” and thereby signify that the United States of America had been founded on the principles of the Holy Bible.  Eisenhower was the first to sign, in an Oval Office ceremony on July 2, 1953. “This is the kind of thing I like to do,” he said afterward. “This statement is simple and understandable, and sets forth the basic truth which is the foundation of our freedoms.” Nixon added his name next, as did members of the cabinet.

“By means of the radio, motion pictures, television, newspaper and periodical advertisements, signboards and posters, essay contests and amateur dramatics as well as community rallies, sermons and editorials,” Decker insisted, “this theme ‘Freedom is of God and we must have faith in him’ can constantly be dinned into the consciousness of America

The Judiciary Committee sat to consider a proposed amendment to the Constitution of the United States. If passed, it would have declared, “This Nation devoutly recognizes the authority and law of Jesus Christ, Saviour and Ruler of nations through whom are bestowed the blessings of Almighty God.”1 The campaign for this “Christian amendment” had been under way, in fits and starts, for nearly a century. Like most efforts to add religious elements to American political culture, the idea originated during the Civil War. In 1861, several northern ministers came to believe that the conflict was the result of the godlessness of the Constitution. “We are reaping the effects of its implied atheism,” they warned, and only a direct acknowledgment of Christ’s authority could correct such an “atheistic error in our prime conceptions of Government.

These clergymen banded together to create the National Reform Association, an organization that was single-mindedly dedicated to promoting the Christian amendment. It won the support of prominent governors, senators, judges, theologians, college presidents, and professors.

Advocates of the Christian amendment still faced an inherently difficult challenge in the Senate. By its very nature, their proposal to change the Constitution forced them to acknowledge that the religious invocation was something new for the document. The founding fathers had felt no need to acknowledge “the law and authority of Jesus Christ,” and neither had subsequent generations of American legislators. Some of the more imaginative advocates of the Christian amendment at the Senate hearings simply waved away this history and argued that leaders such as Washington and Lincoln had supported the idea even if they never acted upon it. For evidence, they repeatedly made reference in their testimony to letters and meetings in which these presidents allegedly had lent support to their cause. At the hearings, the presiding senator kindly offered to have these documents inserted into the official transcript once they were found. But the published record provided a quiet rebuke to such claims, noting that inquiries to the Library of Congress and other authoritative sources showed that the alleged documents did not, in fact, exist.

Disneyland’s dedication testified to how deeply piety and patriotism were intertwined in its creator’s worldview. Disney, a Congregationalist, relied on Christianity as a constant guide. His faith in his country was equally strong, though his political beliefs changed considerably over the course of his life. During the 1930s, he had been a strong supporter of Franklin Roosevelt and the New Deal. His cartoons during the Depression helped establish the so-called “sentimental populism” of the era’s popular culture, always championing “little guys”—Mickey Mouse, the Three Little Pigs, the Seven Dwarves—in their struggles against stronger foes. But in the 1940s, Disney’s politics took a sharp turn to the right. In 1941, a bitter strike at his company led him to denounce “Communist agitation” in a full-page ad in Variety. The day after Pearl Harbor, Disney was stunned when the US Army abruptly commandeered his studio for seven months’ use as a supply base. During the war, the government never paid him for some propaganda shorts he made, and his overseas profits dwindled to a trickle. Disney emerged from the conflict a staunch conservative. He helped bring the House Un-American Activities Committee to Hollywood in October 1947 and, in his appearance as a friendly witness, condemned communist influence in labor unions, pointedly naming names. When fellow Congregationalist James Fifield organized the Committee to Proclaim Liberty a few years later, Disney readily signed on to support its “Freedom Under God” festivities.

In its conflation of piety and patriotism, Disneyland embodied larger currents in American popular culture during the postwar era. Political leaders and religious reformers led the way in fomenting the religious revival of the Eisenhower era, but their counterparts in Hollywood and on Madison Avenue proved to be indispensable allies. Prompted by both patriotism and an eye for profits, entertainers and advertisers did a great deal to promote public expressions of faith in the era. Prominent advertising agencies promoted religious observance as a vital part of American life and religion as an essential marker of the national character.

Like much of corporate America, the advertising industry discovered religion as a means of professional salvation in the aftermath of the Great Depression. The industry had fallen into turmoil when ad revenues plummeted along with corporate profits in the crash of the late 1920s and early 1930s. More ominously for advertising executives, the New Deal represented the first real efforts to regulate their work, as it empowered the Federal Trade Commission to fight false claims about food and drugs. As the nation prepared itself for the Second World War, further growth of the federal government seemed guaranteed. Thus, in November 1941, hundreds of ad executives gathered at a spa in Hot Springs, Virginia, to discuss the danger of “those who would do away with the American system of free enterprise” or who might “modify the economic system of which advertising is an integral part.

The Advertising Council classified its projects as acts of public service, but in truth they were acts of public relations, meant to sell the American people on the merits of free enterprise. In 1946, for instance, the council launched a campaign titled “Our American Heritage.” On the surface, it seemed wholly nonpartisan, simply intended to raise Americans’ awareness of their rights and responsibilities as citizens. Internally, though, organizers described it as a conservative-minded effort that would help Americans resist becoming “pawns of a master state.

The J. Walter Thompson Company (JWT), the largest advertising firm in the world, handled the practical work of the campaign. Its advertisements had a simple message for Americans: go to church. Copywriters drew on their conventional strategies, pitching religion as a path to personal improvement and self-satisfaction. “Find yourself through faith,” the campaign urged; “come to church this week.” Ads typically dramatized the concerns of a frantic father or an anxious housewife and then, in the same tones used to hawk antacid or mouthwash, promised that faith would cure their problems quickly.

Television and film followed the religious trend throughout the 1950s. Billy Graham’s Hour of Decision program was televised by three different networks, on some 850 stations, to an estimated audience of twenty million viewers.

The most lasting legacy of The Ten Commandments was its marketing campaign. As he prepared for the debut, DeMille worked with the Fraternal Order of Eagles on an ambitious plan to establish monuments of the Ten Commandments on public property across the nation. The organization had been distributing copies of the Ten Commandments for years, inspired by an incident in which Judge E. J. Ruegemer of St. Cloud, Minnesota, learned that a juvenile defendant in his courtroom had never heard of the laws and “sentenced” the boy to learn and obey them. Ruegemer, the head of the Eagles’ Youth Guidance Commission, persuaded the fraternal order to take up the cause. Members and their families volunteered to make reproductions of the Ten Commandments, initially manufacturing them as paper scrolls in St. Paul and framing them with hand-cut wood and glass. The nearly nine hundred thousand members of the organization popularized the venture, distributing scrolls far and wide. Recipients included city halls in small towns from Washington State to Pennsylvania, judges in Idaho and Massachusetts, and a police detective in Atlantic City, New Jersey.

When he learned of the Eagles’ campaign, DeMille immediately wanted to join in. A consummate showman, the director urged the Eagles to work on a grander scale. Instead of modest scrolls, he suggested the organization craft larger stone monuments that more closely resembled the tablets described in Exodus. Together, DeMille and the Eagles established Ten Commandments monuments across America.

Schwarz capitalized on his new influence in Congress to present himself as a leading authority on the problem of communism and the solution of Christianity. In 1957, he addressed a breakfast meeting of the Republican Club, where he so inspired attendees that they “immediately,” as one told Schwarz, took steps “to refer you to the House Un-American Activities Committee and to arrange a personal interview between you and an Assistant to the President of the United States.” He was soon summoned to testify before the committee’s staff on the topic “The Communist Mind.” In an interview that ran for an hour and twenty minutes, the doctor—who liked to compare himself to a pathologist in his new line of work—patiently led congressional aides through his diagnosis of the communist menace. Ultimately, he urged greater awareness of “the basic foundations of American civilization” as the only cure.

Improbably, Schwarz’s congressional testimony quickly became a cause célèbre. The first transcripts were rapidly distributed, forcing Congress to print another 50,000 copies the following year. Executives at the Allen-Bradley Company, an electronics corporation in Milwaukee, published large portions of the interview as a special double-page advertisement in the largest metropolitan newspapers. “WILL YOU BE FREE TO CELEBRATE CHRISTMAS IN THE FUTURE?” the headline blared. “NOT UNLESS: You and other free Americans begin to understand and appreciate the benefits provided by God under the American free enterprise system.” The ad urged Americans to read Schwarz’s words and share them with friends. Much like the other corporations who sponsored like-minded messages, the Allen-Bradley Company insisted it had nothing to gain. “With this advertisement,” the sponsor noted, “this company is trying to sell you nothing except the importance of holding fast to your American freedoms including the freedom to live, the freedom to worship your God, and the freedom to work as you choose.” Republican senator Barry Goldwater, meanwhile, wrote Schwarz soon repackaged his testimony as a best-selling book, You Can Trust the Communists ( . . . To Do Exactly as They Say). Released in 1960, it quickly sold a million copies.  While Schwarz successfully spread his message in print, his energies were more devoted to a whirlwind tour of personal appearances.

In 1958, the CACC launched its first School of Anti-Communism. For $5 a day—or $20 for the week—participants were treated to a slate of anticommunist films, lectures, and discussions in a packed schedule that ran from 8:30 a.m. to 9:45 p.m.  The first School of Anti-Communism was held in St. Louis, but they soon spread to cities around the nation including Los Angeles, New York, Chicago, Houston, Dallas, Miami, San Diego, San Francisco, Seattle, and Portland.

While the school made an impression on the public, it also impacted the finances of the Christian Anti-Communism Crusade. The accounting firm of Ernst & Ernst reported that the organization raked in $311,253 for the week, an impressive sum in light of the low admission fees. Even after expenses, the CACC still turned nearly $250,000 in profits. Schwarz promised the proceeds would be used to operate similar schools across the country. But in the short term, he decided to capitalize on the overwhelming local popularity of the Southern California school of by staging a sequel two months later, billed as “Hollywood’s Answer to Communism.” Organizers worked diligently to surpass the success of the first event. Frawley again led the way, this time securing the landmark Hollywood Bowl for the rally. As master of ceremonies, he enlisted the former song-and-dance man and future US senator George Murphy.  The actors made a curtain call as well, with Reagan, Wayne, Boone, Rogers, and Evans all on hand again. This time, though, they were joined by a cast of all-stars that included Jimmy Stewart, Rock Hudson, Robert Stack, Donna Reed, Ozzie and Harriet Nelson, Nat “King” Cole, Jane Russell, Edgar Bergen, Andy Devine, Walter Brennan, Tex Ritter, Irene Dunne, Vincent Price, Cesar Romero, and a host of others then starring on television and in film. Notable directors such as John Ford and studio executives such as Walt Disney and Jack Warner offered their support too.

“When I finally spoke,” Schwarz remembered, “only ten minutes remained, so I delivered an uncharacteristically brief message. It was sufficiently forceful to earn me a comparison to Adolf Hitler in the student newspaper of Stanford University.” The highlight of the Hollywood Bowl event, however, was a special appearance by C. D. Jackson, the publisher of Life magazine. After the Southern California school, his publication ran a two-paragraph item that dismissed the event as a gathering of wild-eyed extremists no different from the John Birch Society. Privately, Schwarz knew well that the two far-right groups often shared a common constituency. In a nine-page, single-spaced letter, Birch Society founder Robert Welch informed him in the fall of 1960 that “we have told our members to encourage, support, and work for your ‘schools’ wherever they were put on, so far as they had the opportunity and ability to do so; and to encourage the attendance of friends and acquaintances (as well as attending themselves).” In some instances, Birchers had taken an even more prominent role in the CACC schools. “I know,” Welch wrote, “that at your recent school in San Diego, some of the people who worked hardest to bring it off successfully were our members, for I saw right on the listing of committees and workers the names of some of our members who had specifically written to ask us whether or not they should participate, and whom we encouraged to do so.” Likewise, “quite a number of the leaders and hardest workers” in the Milwaukee and Chicago schools had been Birchers too.

Publicly Schwarz bristled at any suggestion that his organization had anything in common with the increasingly marginalized Birchers. In retaliation for the hit piece in Life, CACC’s sponsors lashed out. An FBI report noted that Frawley “at once cancelled $80,000 ‘Life’ advertising accounts for Schick Razor and Technicolor.” At the same time, “Richfield and other large national advertisers also withdrew substantial contracts calculated to total half million dollars.” (The sponsors went after less prominent critics with equal zeal. In September 1961, an executive with Richfield Oil sent the head of the Los Angeles FBI office the names and addresses of a dozen private citizens who had written the corporation to complain about its sponsorship of the school, suggesting that they needed to be formally investigated.) Meanwhile, conservative activists organized a grassroots campaign calling for individuals to cancel their subscriptions.

He sat down to write the Engel decision 15 years later, Black was determined to defend the wall of separation between Church and State. Religious liberty was essential, he told his wife, because “when one religion gets predominance, they immediately try to suppress the others.” History was littered with evidence of the dangers that inevitably followed when church and state merged. “People had been tortured, their ears lopped off, and sometimes their tongues cut or their eyes gouged out,” Black continued, “all in the name of religion.” To illustrate that point, the justice crafted a rigorously researched opinion. He began with the Book of Common Prayer and then reread John Bunyan’s Pilgrim’s Progress, a classic Christian allegory written by a Baptist author who had been imprisoned for defying the Church of England. That was merely the beginning. “The Judge had religious references on his fingertips,” marveled one of his clerks, who ran back and forth to the library to collect them. As he wrote and rewrote the opinion, Black piled on more history each time. Lower courts had repeatedly made unsubstantiated claims about the nation’s “religious heritage” to support the defendants in Engel, but Black was determined to expose their errors with a meticulously researched rebuttal. By the sixth draft, the bulk of his opinion had become a lengthy narrative about the tangled history of church-state relations in the entire Anglo-American world from the 16th to 18th centuries. “It is a matter of history,” he insisted, “that this very practice of establishing governmentally composed prayers for religious services was one of the reasons which caused many of our early colonists to leave England and seek religious freedom in America.” Based on their “bitter personal experience,” Black wrote, the founders crafted the First Amendment to keep the state out of religion and religion out of the state.

In Black’s view, religion certainly deserved a place of prominence in American life, but the state could not dictate it. “It is no part of the business of government,” he read, “to compose official prayers for any group of the American people to recite as a part of a religious program carried on by the government.   “The prayer of each man from his soul must be his and his alone,” he said. “If there is anything clear in the First Amendment, it is that the right of the people to pray in their own way is not to be controlled by the election returns.

The outraged reaction to the Engel decision was, in large part, driven by alarmist coverage in the press. The court’s majority had gone to great lengths to note that their ruling merely struck down the Regents’ Prayer and, moreover, did so only because of the unique role that New York State officials played in its composition and implementation, but newspapers lost the nuances. “God Banned from the State,” ran a typically hyperbolic headline. Hostile editorials only compounded the problem. The New York Daily News, for instance, lambasted the “atheistic, agnostic, or what-have-you Supreme Court majority,” while the Los Angeles Times complained they made “a burlesque show” of the First Amendment. Publisher William Randolph Hearst Jr. went so far as to call for a complete rewriting of the First Amendment in a signed editorial that ran in all his papers. The media’s misrepresentations were so widespread that the Columbia Journalism Review devoted its fall issue to figuring out just how and why it had all gone so spectacularly wrong.

For a year and a half, Kennedy managed to avoid issues of church and state. But now the Warren Court had forced his hand. In a press conference two days after the decision, Kennedy finally addressed it. In measured remarks, he cautioned Americans to approach the issue calmly. Noting that it was important to “support the Supreme Court’s decisions even when we may not agree with them,” the president reminded Americans that “we have in this case a very easy remedy, and that is to pray ourselves, and I would think that it would be a welcome reminder to every American family that we can pray a good deal more at home, we can attend our churches with a good deal more fidelity, and we can make the true meaning of prayer much more important in the lives of all our children.” As Kennedy called for calm, however, a few of his predecessors fueled the fires. Herbert Hoover denounced Engel as a “disintegration of a sacred American heritage,” while Eisenhower asserted that he “always thought this nation was an essentially religious one.” Truman pointed out that it was actually the Court’s duty to interpret the Constitution, but he was largely ignored.

Congressional leaders only ramped up their rhetoric. The ruling, Senator Herman Talmadge of Georgia thundered, was “an outrageous edict” and “a blow to all believers in a Supreme Being.” His colleagues in the Senate largely agreed. Barry Goldwater of Arizona denounced the decision as a “blow to our spiritual strength,” while James Eastland of Mississippi likewise called it as a major step toward “the destruction of the religious and spiritual life of this country.

Winegarner’s role in the debate was short-lived. In May 1964, columnists Roland Evans and Robert Novak revealed that the Citizens Congressional Committee was “operated, financed, and directed by Gerald L. K. Smith, notorious promoter of right-wing causes,” and that Winegarner was Smith’s nephew. A onetime ally of Senator Huey Long and an outspoken anti-Semite, Smith had made no secret of his involvement, bragging that the committee was “an auxiliary, financed and directed by The Cross and the Flag,” the far-right publication of his Christian Nationalist Crusade. In its pages, Smith attacked the “cabal of international Jews” in the Kennedy administration and the “nine-man oligarchy” they manipulated on the Supreme Court, before telling readers there was hope. With its “mammoth petition,” the Citizens Congressional Committee had demanded the restoration of “the right of Christian devotions in public schools.

While exposure of the committee’s extremist roots was embarrassing to the larger cause, it was not surprising. Indeed, the campaign for a constitutional amendment to restore prayer to public schools had quickly attracted activists on the far right. Billy James Hargis of the archconservative Christian Crusade devoted himself to circulating petitions across the West, while Carl McIntire, a fundamentalist broadcaster with an affinity for far-right politics, lobbied for it over his own network of 582 radio stations. The John Birch Society supported the amendment idea as part of its long-standing drive to impeach Earl Warren and generally discredit the Supreme Court. Similarly, segregationists who criticized the Court’s rulings on civil rights latched on to the school prayer issue as a more popular and palatable way to condemn it again.

The visibility of such supporters led some to dismiss the constitutional prayer amendment as a cause championed only by the far right or the Deep South, but in truth it had much broader backing. At the 1962 Governors’ Conference, the leaders of forty-nine states called for a prayer amendment that “will make clear and beyond challenge the acknowledgment of our nation and people of their faith in God”; a year later, they renewed their call unanimously. The governors weren’t alone. The Supreme Court’s rulings against school prayer and Bible reading were deeply unpopular across the nation, and a solid majority of Americans seized on the amendment idea as a solution. In August 1963, shortly after the Schempp decision, Gallup asked Americans if they wanted prayer and Bible reading in public schools; 70 percent said yes. They flooded their political representatives with mail, with one study estimating that 50 percent of all correspondence to Congress in the 1963–1964 term focused on the proposal for a school prayer amendment. These letters, postcards, and petitions overwhelmingly supported the idea, with officials citing a margin of nearly twenty to one in favor. Congress leapt into action. Between the summer of 1962 and spring of 1964, 113 representatives and 27 senators introduced 146 different amendments to restore prayer and Bible reading to public schools.5 With such overwhelming popular and political support, the “prayer amendment” seemed sure to sail through Congress and be ratified by the states with equal speed.

Though the two camps in this battle were far from homogeneous, each clustered around a set of convictions. To put it in broad strokes, proponents of the prayer amendment believed America was a Christian nation—or, in their more generous moments, a Judeo-Christian nation. They were deeply invested in promoting a prominent role for religion in public life, believing that formal recognition of God was not simply an affirmation of the nation’s religious roots but an essential measure for preserving the country’s character. In their eyes, liberty came directly from God. If Americans ever came to believe that their rights stemmed from the state instead, then those rights could just as easily be taken away by the state. Thus, the debate for the pro-amendment side was about much more than school prayer; it was about the survival of the nation.

For opponents of the amendment, the stakes were just as high. Legal and religious authorities who opposed the idea warned that a school prayer amendment would radically reshape the status quo, effectively weakening the First Amendment’s guarantee of religious freedom. Under a new “tyranny of the majority,” they believed, local religious minorities would be persecuted. But more than that, all faiths would be endangered. If the state intruded on churches’ and synagogues’ roles as religious educators, it would usurp not just their activities but also their authority. In their place, the state would foster a broader but blander public religion, one drained of the vital details that animated individual faiths. The prayer amendment, the heads of major denominations concluded, would ultimately hurt religion rather than help it.

While Celler’s delaying tactics enraged supporters of the Becker Amendment, they proved crucial in giving opponents time to mobilize. Most civil libertarians and religious organizations had assumed the campaign for a constitutional amendment would go nowhere, but as momentum shifted in Becker’s direction they realized, almost too late, what was happening. In March, ACLU headquarters sent its affiliates warnings that the discharge petition drive was “becoming alarming.” They scrambled to find allies. The Baptist Joint Committee on Public Affairs, the political voice of the eight largest Baptist bodies in the nation, soon announced its opposition, claiming the Becker Amendment threatened their religious liberty. A week later, the American Jewish Committee denounced it as “the most serious challenge to the integrity of the Bill of Rights in American history.” On St. Patrick’s Day, representatives of Protestant and Jewish organizations and civil liberties groups gathered at a hastily arranged meeting in New York. Sizing up the situation, they realized the Becker Amendment had “an excellent chance” of winning a majority of votes from the Judiciary Committee. If that happened, the full House and Senate would invariably vote for it.

Reverend Eugene Carson Blake of the United Presbyterian Church worried that “school prayer and Bible reading either become a ritual that is meaningless and has no effect on the children, or it is some kind of indoctrination.” Either way, it amounted to “state religion,” he warned. “If you get the idea that religion and Americanism are the same thing, all of us are scared to death, because we think religion transcends the State.

“The politician who says he believes in reducing the scope of Government and then asks for a Government role in nurturing and guiding the inner man can expect scrutinizing conversations as these issues are pursued by our people in future debate.

“It is so easy to think that one is voting for prayer and the Bible,” cautioned the Christian Science Monitor. “It comes as a shock that this is not the issue. The issue is that agencies of government cannot avoid favoring one denomination and hurting another by the practical decisions that have to be made by government authority on what version of the Bible shall be imposed and what prayer. The churches know this and that is why they are against the Becker Amendment.

The prolonged fight over the amendment marked not the end of a struggle but the beginning. The House hearings revealed how fault lines across the country were shifting on the issue of separation of church and state. Clerical leaders had taken stands that were largely in line with their denominations’ traditional perspectives on the matter, but conservative laymen recoiled from their arguments. They felt bewildered—and, in many instances, betrayed—by their leaders’ objections to seemingly wholesome traditions such as school prayer and Bible reading. Their faiths’ traditional stances on issues of church-state separation had always seemed academic. In the wake of Becker’s failure, conservative laymen began to doubt the authority of their religious representatives and look for new leaders to replace them.

Dirksen refused to accept defeat. “This crusade will continue,” he announced. “The next time, we will be better organized throughout the country.” In a telephone call the night before the vote, he had been assured by Dr. Daniel Poling, the eighty-one-year-old fundamentalist and former editor of the Christian Herald, that a new grassroots organization would rise up to champion the cause of school prayer. Its leaders would be Poling, Billy Graham, and a “Catholic prelate” to be named later. That specific organization never came to pass, but the proposal was prescient. For too long, religious conservatives believed that their voice in political matters—especially when it came to the role of religion in public life—had been drowned out by the more liberal leaders of their denominations. If conservative Christians at the grassroots would simply organize themselves according to their politics rather than their particular denominations, they could end the reign of the religious establishment. If effective leaders could bridge the long-standing gaps between different faiths—and bring together, as Poling proposed, conservative Catholics with fundamentalist and evangelical Protestants—then laypeople would finally have their say.

When he tried to explain his razor-thin loss in the 1960 presidential race, Nixon often singled out a last-minute decision by Life publisher Henry Luce to scrap an article in which Graham had given him a strong endorsement. Both Nixon and Graham believed the article would have made the difference.

Eight years later, they were determined not to repeat that mistake. Echoing his earlier service to Eisenhower, Graham proved pivotal both in Nixon’s decision to run and in his performance on the campaign trail. “You are the best prepared man in the United States to be president,” Graham reportedly told him in January 1968. “I think it is your destiny to be president.” Unlike his coy approach in 1952, this time he made no secret of his support. At a Billy Graham crusade in Portland, Oregon, he introduced Nixon’s daughters to the crowd and announced that “there is no American I admire more than Richard Nixon.” At the Republican National Convention in Miami in August, Graham provided a prayer after Nixon’s acceptance speech and then participated in top-level discussions about potential running mates. In September, Nixon took a place of honor next to Graham on stage at another crusade in Pittsburgh, where the preacher told the worshipers and those watching at home that his long friendship with Nixon had been “one of the most moving religious experiences of my life.” Shortly before the election, Graham informed the press that he had already cast an absentee ballot for Nixon, a fact that was repeated in Republican television ads right up to election day.

Graham’s influence in the Nixon White House was profound. His words and deeds helped make piety and patriotism seem the sole property of the right.

“Every president in American history had invoked the name and blessings of God during his inauguration address, and many . . . had made some notable public display of their putative piety,” religious scholar William Martin observed, “but none ever made such a conscious, calculating use of religion as a political instrument as did Richard Nixon.” Not even Eisenhower came close. While his purposely bland public religion had helped unite Americans around a seemingly nonpartisan cause, the starkly conservative brand of faith and politics advanced by Nixon and Graham only drove them apart.

“Even in this period when religion is not supposed to be fashionable, when agnosticism and skepticism seem to be on the upturn,” he reflected, “most of the people seem to be saying ‘We are praying for you, Mr. President, and for the country.’” He appeared sincere, but later, when an aide praised his performance, Nixon laughed it off. He’d simply fed the crowd some “church stuff” to keep them happy.

Behind the scenes, however, the ulterior motives were clear. “Sure, we used the prayer breakfasts and church services and all that for political ends,” Nixon aide Charles Colson later admitted. “One of my jobs in the White House was to romance religious leaders. We would bring them into the White House and they would be dazzled by the aura of the Oval Office, and I found them to be about the most pliable of any of the special interest groups that we worked with.” The East Room church services were crucial to his work. “We turned those events into wonderful quasi-social, quasi-spiritual, quasi-political events, and brought in a whole host of religious leaders to [hold] worship services for the president and his family—and three hundred guests carefully selected by me for political purposes.

Well versed in the public relations value of public piety, Haldeman exploited the services to their full potential. At his suggestion, for instance, the supposedly private programs were broadcast over the radio, with print reporters, photographers, and TV cameramen on hand to record the spectacle for wider distribution.

Other officiants were even more direct in blessing the president. In June 1969, Rabbi Louis Finkelstein, chancellor of the Jewish Theological Seminary of America, concluded his sermon with a bold prophecy. “I hope it is not too presumptuous of me, in the presence of the President,” he noted, “to say that future historians, looking back at our generation, may say that in a period of great trials and tribulations the finger of God pointed to Richard Milhous Nixon, giving him the vision and the wisdom to save the world and civilization.

Such comments were no accident. The White House staff went to great lengths to ensure that clergymen invited to the East Room were conservatives connected to a major political constituency. In recommending Archbishop Joseph Bernardin of Cincinnati as officiant for a service before St. Patrick’s Day, a cover memo noted bluntly that “Bernardin was selected because he is the most prominent Catholic of Irish extraction and a strong supporter of the President. We have verified this.” Harry Dent, a former aide to Strom Thurmond who directed the administration’s “southern strategy,” likewise forwarded a list of “some good conservative Protestant Southern Baptists” who could be trusted to preach a message that pleased the president.

Political concerns also dictated who attended each service. Low-level members of the White House staff, such as switchboard operators or limousine drivers, were occasionally invited, to support the illusion that these were private affairs for the larger White House “family,” but internal policies instructed that no more than a quarter of the attendees should be “non-VIPs.” Instead, the congregation was composed of prominent members of the White House and its supporters, so much so that the New York Times joked: “The administration that prays together, stays together.” Invitations usually went to the administration’s allies in Congress, but occasionally they were used to lobby more independent members about particular bills.

With the bulk of the seats reserved for administration officials and congressmen they might sway, the remaining few were precious political commodities. Potential campaign donors were always given preference. An early “action memo” to Colson ordered him to follow up on the “President’s request that you develop a list of rich people with strong religious interest to be invited to the White House church services.” At this, Colson had quick success. The guests for an ensuing East Room service, for instance, included the heads of AT&T, Bechtel, Chrysler, Continental Can, General Electric, General Motors, Goodyear, PepsiCo, Republic Steel, and other leading corporations.

As the political purpose of the White House church services became obvious, criticism from the press increased. Originally, Nixon thought it would be “very useful” to win the media’s approval for the new tradition and decided to invite several prominent reporters, pundits, newspaper publishers, and network presidents to a service early in his administration. Guests included CBS anchorman Walter Cronkite and newspaper publisher Samuel I. Newhouse, as well as prominent reporters from major dailies. For his sermon to the press, Reverend Louis H. Evans Jr. dwelled on the dangers of passing judgment without having the full facts at hand. “Can we be accepted for what we truly are, can we accept others for what they are,” Evans asked, “or will they cling to stereotypes, to distorted priori portraits?” Such blunt entreaties did not, of course, keep the press from passing judgment. In July 1969, the Washington Post challenged the sincerity of this “White House Religion.” “Unfortunately, the way religion is being conducted these days—amid hand-picked politicians, reporters, cameras, guest-lists, staff spokesmen—has not only stirred needless controversy, but invited, rightly or not, the suspicion that religion has somehow become entangled (again needlessly) with politics,” the editors chided. “Kings, monarchs, and anyone else brash enough to try this have always sought to cajole, seduce or invite the clergy to support official policy—not necessarily by having them personally bless that policy, but by having the clergy on hand in a smiling and prominent way.” In the end, the Post gently suggested it might be best “to avoid using the White House as a church.

Religious leaders began to denounce the East Room church services as well. Reinhold Niebuhr, once an outspoken critic of Spiritual Mobilization, now targeted its apparent heirs. For an August 1969 issue of Christianity and Crisis, the seventy-seven-year-old theologian penned a scathing critique titled “The King’s Chapel and the King’s Court.” The founding fathers had expressly prohibited establishment of a national religion, he wrote, because they knew from experience that “a combination of religious sanctity and political power represents a heady mixture for status quo conservatism.” In creating a “kind of sanctuary” in the East Room, Nixon committed the very sin the founders had sought to avoid. “By a curious combination of innocence and guile, he has circumvented the Bill of Rights’ first article,” Niebuhr charged. “Thus he has established a conforming religion by semi-officially inviting representatives of all the disestablished religions, of whose moral criticism we were [once] naturally so proud.” The “Nixon-Graham doctrine of the relation of religion to public morality and policy” neutered the critical functions of independent religion, he warned. “It is wonderful what a simple White House invitation will do to dull the critical faculties, thereby confirming the fears of the Founding Fathers.

“I call upon Americans to bend low before God and go to their knees as Washington and Lincoln called us to our knees many years ago,” he implored. “I submit that we can best honor America by rededicating ourselves to God and the American dream.” A return to religion, Graham argued, would bind the wounds of the nation and “stop this polarization before it is too late.” As Graham looked out from the Lincoln Memorial, though, it seemed it might already be too late. The crowd before him welcomed his message, but they had become increasingly distracted by a smaller contingent of radicals arrayed behind them. Roughly a thousand sprawled in the shadows of the Washington Monument, smoking red-white-and-blue joints and waving Vietcong flags. Though Graham had hoped to win them over, they still viewed him and his supporters with suspicion. (Speaking with a reporter, a young man with long brown hair and a drooping mustache referred to Graham’s clean-cut crowd as “the Americans.”) As the service went on, a few hundred radicals, some completely nude, waded waist deep into the reflecting pool and launched into antiwar chants.

When mounted policemen finally intervened to keep the hecklers at bay, the conservative crowd cheered them on. “Push ’em back,” yelled a man in yellow Bermuda shorts. “They can use a bath!” “They ought to be clubbed,” said a bald man in a striped shirt. An angry housewife upped the ante: “I hope they break a few necks, that’s what I hope.

As the speakers descended the steps, they joined the crowd in a procession down Constitution Avenue. US servicemen and Boy Scouts led the way with the American flag and the flags of states and territories. Hippies stood on the sidelines chanting “One, two, three, four! We don’t want your fucking war!

Once in office, Reagan helped deepen the sacralization of the state. “I am told that tens of thousands of prayer meetings are being held on this day; for that I am deeply grateful,” he said in his first inaugural address. “We are a nation under God, and I believe God intended for us to be free.

[ And that’s just some of what this book has to say – find out about Nixon, Reagan, and what’s happened since by reading the book ]

References

  • Aleklett, K., et al. 2012. Peeking at peak oil. Berlin: Springer.
  • Hook, M., et al. 2009. Giant oil field decline rates and their influence on world oil production. Energy Policy 37(6):2262–2272.
  • Friedemann, A. 2016. Limits to Growth? 2016 United Nations report provides best evidence yet. www.energyskeptic.com
  • Friedemann, A. 2015. When trucks stop running, Energy and the Future of Transportation. Springer.
  • Friedemann A (2021) Life After Fossil Fuels: A Reality Check on Alternative Energy. Springer
  • Kerr, R. 2011. Peak oil production may already be here. Science 331:1510–11.
  • Montgomery, D.R. 2007. Dirt: the erosion of civilizations. California: University of California Press.
  • Murray, J., et al. 2012. Oil’s tipping point has passed. Nature 481:43–4.
  • Newby, J. 2011. Oil Crunch (Fatih Birol). Catalyst. ABC TV.
  • IEA. 2010. World energy outlook 2010, 116. International Energy Agency.
  • Smil, V. 2010. Prime Movers of Globalization: The History and Impact of Diesel Engines and Gas Turbines. MIT press.
  • Solomon, L. May 2, 2008. Author Rex Weyler on sorting myth from history, and why we need both. TheTyee.ca
  • Zittel, W, et al. 2013. Fossil and nuclear fuels. Energy Watch Group.

P.S. My favorite books about how corporations manipulate government are “Republic, Lost” and Dark Money

Posted in Corruption, Corruption & Finance, Distribution of Wealth, Religion | Tagged , , , , , , , | 1 Comment