How will 500,000 products made with fossils as feedstock & process energy be created post fossil fuels?

Preface. It is quite likely that after fossils are gone, plastics will no longer be made, since they are incredibly complex – PhDs in numerous fields make them possible – and most kinds have been around for only 50 years or less. Thwaites (2011) showed how hard replicating a complex process that we take for granted would be by performing a simple exercise:  He tried to make an ordinary toaster from scratch. Even the simplest toaster had 404 parts of plastic, steel, mica, copper, and nickel. After a great deal of struggle, he was able to make the metal pieces, which mankind has made since the Iron Age. But plastics were beyond him. He’d have had to refine crude oil to make propylene, which takes at least six chemical transformations to make into the simplest plastic, polyethylene.

Crude oil is the feedstock for half a million products. What follows is a description of how plastic is made. My book “Life After Fossil Fuels” discusses plastic in more depth — how much biomass is needed, how to replace asphalt and lubricants, and recycling.

Alice Friedemann  www.energyskeptic.com  Author of Life After Fossil Fuels: A Reality Check on Alternative Energy; When Trucks Stop Running: Energy and the Future of Transportation”, Barriers to Making Algal Biofuels, & “Crunch! Whole Grain Artisan Chips and Crackers”.  Women in ecology  Podcasts: WGBH, Crazy Town, Collapse Chronicles, Derrick Jensen, Practical Prepping, Kunstler 253 &278, Peak Prosperity,  Index of best energyskeptic posts

***

We consume about ONE BILLION TONS of products a year. We live like kings. Of all the fossil fuels we use in a year, about seven percent – 500 million metric tons of oil equivalent, the weight of all the people on earth – is used as both feedstock and energy to make these one billion tons of products (IEA 2018).  Mostly its oil for high-value chemicals. Natural gas and coal are used to make ammonia and methanol, but difficult to turn into other products because they require multiple energy-intensive steps (IEA 2018, KAUST 2020).

How do I love thee crude oil? Let me count the ways: Plastic, asphalt, glue, aspirin, insecticides, antiseptics, bandages, purses, boats, cameras, shampoo, candles, cell phones, curtains, luggage, dashboards, fertilizers, ink, pharmaceuticals, refrigerants, shower curtains, surf boards, synthetic rubber, tents, toothpaste, Legos and my umbrella. And unfortunately, single use plastic bottles. 

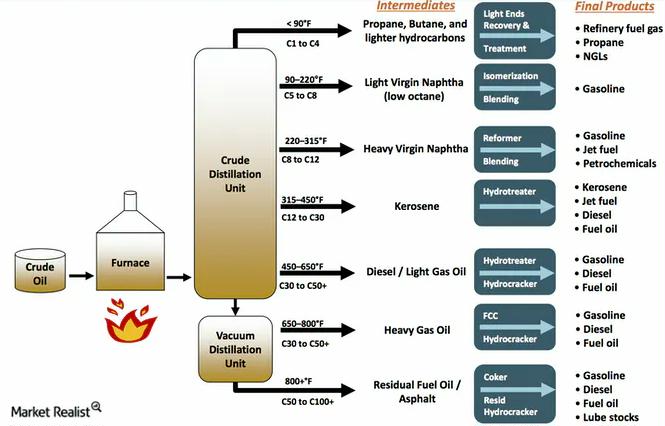
Crude oil flows like molasses and needs to be heated to separate the hydrocarbons into different products based on their number of atoms and therefore molecular weight. They’re fed into a distillation tube where the heavier oil sinks to the bottom while the shorter, lighter chains of hydrocarbon float to the top.

The segment made into plastic and other petrochemicals is Naptha, which contains ethane and propene. They will need to be further broken down into smaller fragments with high heat and pressure, and then formed into long repeating chains called polymers. Especially polyethylene and polypropylene, the most common polymers on earth because they can make plastics ranging from pliable to tough (Bryce 2021).

Many other kinds of polymers can be made as well, and mixed with additives such as dyes, chemicals, antioxidants, foaming agents, plasticizers, and flame retardants for food storage, cosmetics, medicine, technology, and health care products.

Unfortunately this is an alien substance never before seen in nature that microbes don’t know how to break down into water and carbon dioxide. That’s why it can take centuries to decompose, leaching added chemicals back into the environment.

After the oil is gone, how will we make half a million tons of products every year?

The oil most plastics and other products are made from is petroleum 84% Carbon and 12% Hydrogen. There has to be a hell of a lot of whatever replaces oil.

Dirt? Nope, it’s 47% oxygen, 28% silicon, 8% aluminum, 5% iron, 3.6% calcium, 3% sodium, 3% potassium, and 2% magnesium. Air is nitrogen and oxygen. Water? No, that’s just hydrogen and oxygen.

That leaves biomass. In decreasing order of abundance, the most common elements in biomass are carbon, oxygen, hydrogen, nitrogen and Ca, K, Si, Mg, Al, S, Fe, P, Cl, Na, Mn, Ti.  Biomass varies quite a bit in mineral composition, with carbon 35 to 65% of the dry weight, and hydrogen roughly six percent.

It’s not surprising biomass is chemically similar to fossils fuels, which were made from plants. Mother Nature’s recipe for fossil fuels is as follows: Find an anaerobic (no oxygen) basin, fill with remains of mostly marine plants, crush fields of decaying plant remains under tons of earth, pressure cook for hundreds of millions of years. Yield: One gallon of crude oil per 196,0000 tons of plants. That’s a lot of plants! Imagine cruising through Kansas and having to cram 40 acres of wheat into your gas tank every 20 miles (Dukes 2003).  Nature has done a whole lot of economic work for us!

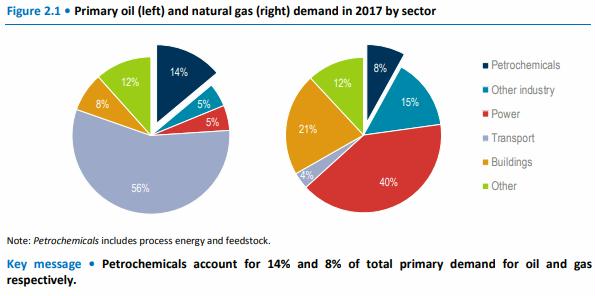
Petrochemicals from fossil fuels (IEA 2018)

Check out the Sankey diagram here.  The main chemicals made by natural gas are fertilizer, ammonia, and urea as well as some plastics, but petroleum is preferred for HVC’s (high value chemicals) because it has long carbon chains.  As you can see, large chunks of oil and natural gas are used to make petrochemicals.  Not shown is coal, which is also used — the feedstocks are interchangeable for some products so which one is used as the feedstock can depend on which is the cheapest.

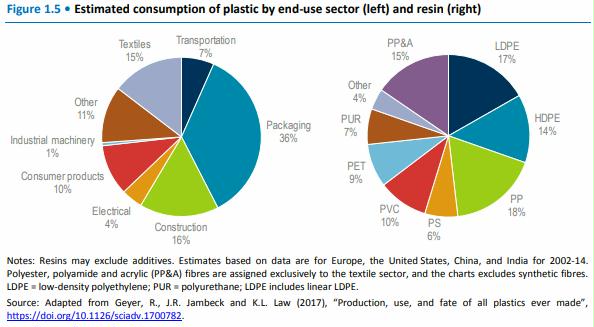
Key thermoplastics, types 1 through 7

  • 1 PET is mainly used to make polyester fiber, but its other key end-use is food and beverage packaging. Its key properties are its high crystallinity and strength
  • 2 HDPE is one of the most versatile plastics, used in anything from shampoo bottles to hard hats. It is made entirely of ethylene and is among the most recycled plastics.
  • 3 PVC is a tough resin that is most frequently used in construction. PVC windows, doors and pipes are commonplace on construction sites and in buildings throughout the world.
  • 4 LDPE was the first polyethylene plastic to be invented and is another key plastic used for packaging. It is the key constituent of most plastic carrier bags.
  • 5 PP is a versatile plastic with many end-uses. Because it has a higher melting point than some other key polymers, it is often used in automotive applications, where high temperatures can be encountered.
  • 6 PS comes in three main forms: “general purpose” “high impact” and “expandable”. The latter is used in packaging applications to protect goods during transport and storage.
  • 07 O. Other thermoplastics include polycarbonate, acrylonitrile butadiene styrene, styrene acrylonitrile, polymethyl methacrylate, polyacrylonitrile, polyvinyl acetate, and many others. They have a wide range of uses, but produced in much smaller volumes than 1-6 above

References

Bryce E (2021) How do we turn oil into plastic? LiveScience.com.

Dukes JS (2003) Burning buried sunshine: Human consumption of ancient solar energy. Climatic Change 61: 31–44.

IEA (2018) The future of petrochemicals. Towards more sustainable plastics and fertilisers. International Energy Agency.

KAUST (2020) Making more of methane. King Abdullah University of Science and Technology. News release. https://www.eurekalert.org/pub_releases/2020-09/kauo-mmo090220.php

Thwaites T (2011) The Toaster Project: or a heroic attempt to build a simple electric appliance from scratch. Princeton Architectural Press.

Posted in Biomass, Manufacturing & Industrial Heat, Oil | Tagged , , , , , , | 1 Comment

Why wind and solar will cause more blackouts

Preface. Clearly fossil fuel plants need to be replaced with energy storage — batteries, pumped hydro, or compressed air. Many hours of backup power will be needed since, unfortunately, over two-thirds of total wind power in the U.S. happens outside the 9–5 peak weekdays maximum demand (Baxter 2005).

Peak solar generation is at high noon, which is not the same time of day as peak people demand. For example, in New England the morning demand starts at 5 am and ramps up to 9 am, stays that high until 5 pm, and then reaches an even higher evening peak from 5:30 to 7:30 pm when people come home (EIA 2011).

A much bigger problem is that wind and solar are seasonal, requiring massive storage to solve the “gigawatt-day” problem of days or weeks when renewable generation is insufficient to meet demand, even after all available load flexibility and short-term storage resources have been deployed (CEC 2011; CCST 2012).

Imagine a future in which wind and solar supply up to 100 % of U.S. electricity. You would need to store hundreds of hours of power (Houseman 2014). Winds are highly variable. Seasonal wind—March comes in like a lion, goes out like a lamb— might require 200 hours of storage, which could clearly be done only with very inexpensive storage media, such as water or air (Cavallo et al. 1995).

Grid operators are ringmasters. They have had to cope with the mismatch between demand and supply, and over decades have learned what the patterns are, and how to turn power plants up and down, on and off, accordingly. But wind goes from a whisper to a roar when storms arrive (Halper 2015), a bucking bronco that gets increasingly hard to manage and control the more wind and solar penetrate as a percentage of overall power (IEA 2013).

So far, wind and solar power penetration is so small that operators can balance it with natural gas peaker plants, dispersing excess generation across a larger region, more frequent scheduling (15 min or less), (pumped) hydropower, or curtailment.

But that is starting to change as renewables penetrate more. I’ll add more blackout stories as I see them in the news below.

Renewables caused or almost caused blackouts in the news:

2021-1-10 Europe narrowly escaped blackout: electricity suppliers warn – Austria

2020-8-20 Poor Planning Left California Short of Electricity in a Heat Wave. Scores of power plants were down or operating below their capacity just as hot weather drove up demand.

As you probably know, the supply and demand of electricity must match within a very small range. There’s yet another quality of electricity called VARs that I’ve read about but never understood. Renewables do not generate Volt-Ampere Reactives (VARs), but wind and solar farms can be expensively altered to generate them, and if they don’t, utilities will curtail their power. Alternating current has electromagnetic properties that have to be kept in balance. It’s a lot like riding a bicycle: The energy you put into the pedals will move the bike forward, but you also have to put some energy into maintaining your balance, or you’ll fall over and won’t be able to move forward at all. If you are a good bicyclist on a smooth road, the “maintaining your balance energy” will be small. If you are a poor bicyclist who swerves around a lot, or if you’re on a bad road, the “maintaining your balance” energy will be larger. In either case, the “maintaining your balance” energy is necessary. That energy is also a parasitical drain on your energy effort: it doesn’t move the bike forward. A well-run grid is like a good bicyclist on a smooth road.  Rotating electric machinery puts VARs on the grid, and if the entire grid was thermal (nuclear, gas, coal) and hydro units with rotating electric machinery.  But wind turbines and solar make direct current that needs to be changed into alternating current, and that process does not put VARs on the grid in the same fashion, which can mess up the grid (Angwin M (2020) Shorting the Grid. The Hidden Fragility of Our Electric Grid)

Alice Friedemann   www.energyskeptic.com  author of “Life After Fossil Fuels: A Reality Check on Alternative Energy”, 2021, Springer; “When Trucks Stop Running: Energy and the Future of Transportation”, 2015, Springer, Barriers to Making Algal Biofuels, and “Crunch! Whole Grain Artisan Chips and Crackers”. Podcasts: Collapse Chronicles, Derrick Jensen, Practical Prepping, KunstlerCast 253, KunstlerCast278, Peak Prosperity , XX2 report

***

Starn J (2021) The Day Europe’s Power Grid Came Close to a Massive Blackout. Bloomberg.

A fault occurred at a substation in Croatia and caused an overload in parts of the grid, which in a domino effect spread beyond the country’s borders as far as France and Italy. Although not directly caused by intermittent sources such as wind or solar in this case , it’s only a matter of time before too many renewables and too few balancing fossil fuel plants lead to more blackouts. Similar outages have happened in California, Australia and Germany as well.

The reason is that transmission grids need to stay at a frequency of 50 hertz to operate smoothly and any deviations can damage equipment that’s connected. Had the frequency swings not been reduced within minutes, it could have caused damage across the entire European high voltage network, potentially causing blackouts for millions.

Spinning turbines of thermal plants powered by coal or natural gas connected to the grid create kinetic energy called inertia which helps keep the network at the right frequency. This spinning can’t be created by wind turbines or solar panels. The main solution being proposed for energy storage to replace fossil generation are batteries, but they cannot create inertia either. Batteries to store just one day of U.S. electricity will cost $40 trillion or more and last only 5 to 15 years, depending on battery type (Friedemann 2016). No other kind of energy storage will do the trick, not pumped hydro, compressed air energy storage (there are few sites to put more than the single one that exists in Alabama), or concentrated solar power. Or a national super grid.

Currently, too many renewables are being added while fossil fuel plants are shut down too quickly.

So Germany, despite it’s plan to ditch fossil fuels continues to generate more energy from coal than from wind, because the wind does not blow permanently. It is also generating zero energy from solar at the moment because it’s winter.  And in 2018, the UK went for nine days with zero power generations from wind farms because of  a wind draught.  

We might see an unwelcome repeat of what many Soviet bloc countries experienced in the 1980s—timed blackouts lasting months and even years.

References

Baxter, R. 2005. Energy storage: a nontechnical guide. Tulsa: PennWell.

Cavallo, A., et al. 1995. Cost effective seasonal storage of wind energy, 119–125. TX: Houston, CRC Press.

CCST. 2012. California’s energy future: electricity from renewable energy and fossil fuels with carbon capture and sequestration. California: California Council on Science and Technology.

CEC. 2011. 2020 Strategic analysis of energy storage in California. California: California Energy Commission.

EIA. 2011. Demand for electricity changes through the day. U.S. Energy Information Administration. http://www.eia.gov/todayinenergy/detail.cfm?id=830.

Friedemann AJ (2016) When Trucks Stop Running: Energy and the Future of Transportation. Springer.

Posted in Blackouts, Blackouts Electric Grid, Grid instability, National Super Grid | Tagged , , , | Comments Off on Why wind and solar will cause more blackouts

Water Theft

Preface. As fresh water supplies are depleted worldwide and water crises increase, water theft is becoming more common.  And damage to marine environments as well.

It is estimated that between 30% and 50% of the global water supply is stolen (Loch et al 2020).

Goundwater is a third of California’s water, but its use in California isn’t regulated, and so farmers may drain them as early as the 2030s (de Graaf et al. 2015).  From 2000-2008, California used up a fifth of all the aquifer water that had ever existed there (Konikow 2013), and even more during the great drought of 2011 to 2017. There are plans to finally monitor groundwater (California is the only state that doesn’t do so), but not until 2040.   So the theft of water from future generations goes unpunished.

Agriculture uses 70% of fresh water, and surprisingly, this is the area of greatest thefts.

It’s not theft, but perhaps ought to be: crops that require a huge amount of water, such as soy and corn in drought-prone California, should be replaced with more drought-tolerant crops, such as corn and soy which use more water than most other crops, even fruit and nut crops (Levy et al 2020).

Human-induced climate change will steal water as well.  California’s snow banks supply half of all water, and may decline by 13 to 50% from climate change (Qin et al 2020). Since snow provides water year round for up to 3 crops a year, production may be reduced to just one crop in a state that produces a third of America’s food, raising prices for everyone.

Also in California, pot farms are wreaking destruction. Creek water is diverted to ponds to grow marijuana, rather than continuing on to the eel river, lowering water levels so much that the spawning grounds for salmon and other fish are endangered. Growers also use pesticides and other toxic chemicals that wash into streams and pollute watersheds.   

Water theft isn’t always literally stealing water – farms and industry that discharge toxic wastes into water rather than treat them are also stealing fresh water by making it undrinkable, or expensive to treat. And since treatment is very expensive, it can be avoided by water fraud that alters samples to make the water look clean.

In addition, leaks from sewer lines and underground storage tanks release hazardous substances, such as sulphates, chlorides, nitrates, or petroleum products (e.g. gasoline, diesel, kerosene, oil). They contaminate not only underground and drinking water, but also rivers and oceans;

Mining and dredging of the marine environment and underwater construction of offshore wind turbines and other construction projects endanger the marine ecosystem, as does the illegal dumping of garbage offshore.

As incentives to steal water increase, so does the challenge for regulators with respect to resourcing, detection, enforcement and appropriate sanctions.    

I’ve included the section on water theft from Interpol and the UN below since it is the shortest most comprehensive overview.  This paper also covers environmental destruction of air and land, biodiversity loss of elephants and other trafficked animals, stealing of natural resources from illegal logging, fishing, and mining.

And here’s an amazing factoid: Humans control the majority of freshwater on earth because human-managed reservoirs comprise only a small percentage of all water bodies, they account for 57% of the total seasonal water storage changes globally (Cooley 2021).

Alice Friedemann   www.energyskeptic.com  author of “Life After Fossil Fuels: A Reality Check on Alternative Energy”, 2021, Springer; “When Trucks Stop Running: Energy and the Future of Transportation”, 2015, Springer, Barriers to Making Algal Biofuels, and “Crunch! Whole Grain Artisan Chips and Crackers”. Podcasts: Collapse Chronicles, Derrick Jensen, Practical Prepping, KunstlerCast 253, KunstlerCast278, Peak Prosperity , XX2 report

***

INTERPOL & UNEP (2016) Strategic report.  Environment, peace, & security: A convergence of threats. International Criminal Police Organization & UN Environment.

Water is one of the most plentiful resources on our planet. Although it is a key factor for development, some populations still suffer from water deprivation. As a scarce commodity, states and institutions are facing pressing challenges to ensure water security, as they aim to provide access to clean water and sanitation. The quality of water is particularly compromised by human induced pollution, such as:

  • Improper waste management: until the 1970s, there was no or inadequate waste management planning to dispose of waste, which was discharged into the water. The transition towards disposing properly of waste accumulated as a result of a growing urbanization rate, the development of tourism, and the intensification of industrial activities proved challenging, as the Khian Sea episode illustrates. The main issues now concern consumer behavior, which contributes to marine litter and plastic pollution, as well as developing countries confronted with the need to adopt waste-management policies adapted to their growth;
  • Marine projects: environmental impact assessments have demonstrated the detrimental effect of underwater construction projects, such as the Öresund crossing, but more importantly of ocean mining. As the seabed offers large quantities of minerals and metals, it draws considerable attention. The exploitation and extraction of the seabed’s resources, however, endangers the marine ecosystem, notably by disrupting the marine habitat of species;
  • Leakages from sewer lines and underground storage: leaks from damaged and/or old sewage systems and underground storage tanks release hazardous substances, such as sulphates, chlorides, nitrates, or petroleum products (e.g. gasoline, diesel, kerosene, oil). They contaminate not only underground and drinking water, but also rivers and oceans;
  • Leachates from landfills, pesticides, and fertilizers: these toxic substances eventually pollute groundwater, rivers, and oceans, as a result of infiltrations in the soil and land runoffs;
  • Oil pollution: one of the most devastating sources of water pollution is oil spills, which typically involves the discharge of petroleum into the water. They generally occur through negligence or intentional non-compliance. Although the number of incidents has significantly decreased over the past years, this remains an issue for concern, as the environmental impact is considerable and long-lasting.

Criminal Activity

There is a wide variety of water-related crimes but this report distinguishes between three categories: water fraud, water pollution, and water theft.

Water fraud involves the alteration of sampling techniques or results to avoid treatment costs. The main danger from these practices is the negative health implications. For instance, when statistics are manipulated deceitfully to promote water as being clean, it poses a genuine health risk as the water supplied may not be as clean and safe as advertised;

Water pollution implies the intentional contamination of water, usually by companies or vessels (e.g. improper disposal of sewage, chemicals and waste, oil spills). The following trends can be underlined with regard to:

  1. Oil-pollution crimes include illegal oil discharges, false statements or records, and bypassing pollution prevention equipment. Illegally operating vessels have sailed under the national flags of countries, such as Cyprus, Denmark, Djibouti, United Kingdom, Hong Kong (China), Italy, Liberia, the Netherlands, Norway, and Russia;
  2. Illegal garbage discharges entail the illegal discharge of garbage and the absence or the illegal alteration of garbage record books.

Water theft is understood, here, as non-revenue water, that is the unauthorized use and consumption of water before it reaches the intended end-user. It is estimated that between 30 and 50 per cent of the global water supply is illegally purchased. Regions experiencing chronic water stress (e.g. Southern Europe, Africa) and marginalized deprived areas (e.g. slums in India, Bangladesh, or Brazil) are particularly vulnerable. Local communities are, therefore, forced to find alternative solutions to fulfil their daily needs for water. In Africa, the number of unregulated wells has skyrocketed from 2 million to an estimated 23-25 million in a decade. While this reflects poor water management, this practice is also conducive to the major degradation of water resources.

Criminal Supply Chain

In cases of pollution (e.g. illegal waste discharge and oil spill), water is not considered as a commodity, which can be traded. In other words, water pollution is not about obtaining water as a raw product and trafficking in it: water suffers collateral damage of negligence or criminal behavior. Water pollution not only affects environmental quality but it also disrupts business activities. Oil spills contaminate an area which can sometimes be very large (e.g. BP oil spill in 201438), thereby destabilizing other sectors, such as fisheries, and disrupting the supply chain of the companies active in the polluted region. Criminals involved in other water-related crimes, such as water fraud and water theft, jeopardize the integrity of the existing supply chain. The supply of water takes place in two general stages:

Production: before reaching its end-users, water is usually collected from a source point, such as lake, river, or groundwater. It is then routed, through a ground-level or underground structure, to a treatment facility. After being purified, the water is piped to a storage system, such as a reservoir, tank, or cistern. An underground network finally connects the storage facility to the end-users. To ensure the quality of the water supplied, different samples are collected and analyzed at each point (collection, treatment, and storage). However, the samples and the results provided are sometimes tainted with fraud, undermining the supply chain integrity and posing a serious health risk, as mentioned earlier.

Distribution: the delivery of water to end-users highlights two issues. On the supply side, the

public sector is sometimes involved in over-billing or imposing maintenance charges which should not be borne by the consumers. Alternatively, on the demand side, end-users are sometimes engaging in reprehensible behavior to evade costs associated with the access to water (e.g. concealing illegal connections, tampering with meter readings).

Crime Convergence

Water crimes intersect with other criminal activities. Financial motivations spur on unscrupulous individuals wishing to avoid costs. Fraud and document forgery are common practices (e.g. presenting forged or false declarations, manipulating the vessels’ records detailing their waste and oil discharges, reporting fake results of analyses to eliminate costs associated with water treatment). This is compounded by endemic corruption. In the public sector, bribery, misappropriation of funds, and fraud plague the tendering and procurement processes in creating the water-supply infrastructure. This also highlights the disregard for health and safety regulations, which put the life of consumers at risk. In parallel, corrupt practices between public and private actors can take place at several stages: some consumers engage in administrative corruption to influence the design of the water-supply infrastructure to ensure easier access to water or to benefit from preferential treatment in general (e.g. higher flow of water, repairs). This exacerbates the problem of unequal and unfair distribution of a vital resource, based on a corrupt system that relies on bribes.

Corruption in the water sector is also fueled by the involvement of organized crime, and more specifically mafia-type groups. The monopoly over the water supply underpins the power and influence that organized crime groups have over vulnerable communities living in poor and/or marginalized areas (e.g. slums), particularly in Bangladesh, Brazil, and India.

The misuse of water for terrorist purposes is not new and highlights the problem of water being exploited for criminal ends. More recently, the control of dams in Iraq by the terrorist group Daesh, (also known as the Islamic State or ISIL), has raised concerns about some populations which could be threatened by the group’s decision to flood villages or deprive them of water in regions already facing water scarcity. Similarly, the Nigerian terrorist group, Boko Haram, is believed to have poisoned water sources, resulting in the death of cattle as well as the displacement of populations. Not only do terrorist acts targeting water or the water infrastructure directly affect populations, but they can also contribute to pollution.

References

Cooley SWet al (2021) Human alteration of global surface water storage variability. Nature.

Konikow LF (2013) Groundwater depletion in the United States (1900-2008): Scientific Investigations Report 2013-U.S. Geological Survey. https://doi.org/10.3133/sir20135079

Levy MC, Neely WR, Borsa AA et al (2020) Fine-scale spatiotemporal variation in subsidence across California’s San Joaquin Valley explained by groundwater demand. Environmental Research Letters 16.

Loch A, Perez-Blanco CD, Carmody E (2020) Grand theft water and the calculus of compliance. Nature Sustainability 3: 1012-1018.

Qin Y, Abatzoglou JT, Siebert S (2020) Agricultural risks from changing snowmelt. Nature Climate Change 10: 459-465.

Posted in Food production, Groundwater, Peak Water, Water Pollution | Tagged , , , , | Comments Off on Water Theft

Rex Weyler: Why is the political process so slow to respond to our ecological crisis?

Preface.  Rex Weyler is one of the co-founders of Greenpeace in Canada, a brilliant ecologist and journalist, and more. His blog is here: https://www.rexweyler.ca/greenpeace

***

Rex Wyler. September 2021. Ecological crisis: Might as well speak the truth

Why is the political process — worldwide — so slow in responding appropriately to our ecological crisis?

We may point out that most political processes are hobbled by corruption, self-interest, and bureaucratic incompetence. However, there may be a deeper reason, connected to how the status quo protects itself, not just against foreign aggressors, but against dissident ideas that threaten its accepted narrative.

Regarding our ecological problems, the popular narrative of most societies and governments today is that we have a “climate problem,” which can be solved with “renewable technologies” such as windmills, carbon capture, and efficient batteries.

However, global heating is a symptom of a much larger, more fundamental ecological crisis articulated by William Rees, the Limits to Growth study, the Post-Carbon Institute  and other ecologically aware observers. Humanity’s urgent and primary challenge is what ecologists call “overshoot,” the predicament of any species that grows beyond the capacity of its environment. Wolves overshoot the prey in their watershed, algae overshoot the nutrient capacity of a lake, and humanity has overshot the entire capacity of Earth. Global heating, the biodiversity crisis, depleted soils, and disappearing forests are all symptoms of ecological overshoot.

All paths out of overshoot (genuine solutions) involve a contraction of the species and a decline of material/energy throughput. There are no exceptions.

Furthermore, the contraction of humanity is inevitable, so all genuine options exist within this framework, whether we respond appropriately or not. And finally, every day that we ignore this reality, the deeper humanity falls into the overshoot rut, the faster the feedbacks take over (forest fires, methane from melting permafrost), and the less chance we have of mitigation.

In several cases, scientists and other colleagues who have attempted to introduce these facts in political settings have told me: “It is a non-starter. They don’t want to hear it.” Okay. That reveals a deeper problem: political inertia and the paradigm trap.

If mentioning the real problem to any given group that wants to help is a “non-starter,” I cannot imagine how that group is ever going to be effective.

In my experience, this is how the status quo maintains itself: Not necessarily with conspiracy or evil plotting (although those phenomena exist), but rather with social gravity, pulling every alternative idea or narrative toward itself, until the alternative idea is safely inside the event horizon and there is no escape. The capitalist/growth status quo black hole has virtually gobbled up the entire environmental movement, and the civil rights movements, this way.

Politicians reach out to scientists for an articulation of our problems, but typically reject the warnings from scientists if those warnings violate the accepted paradigm. The message from serious ecological science suggests that a clear understanding of overshoot is absolutely essential for anyone or any group hoping to understand the problem. Non-starter or not, I suggest it would help anyone attempting to influence governments to have a one-pager on “Overshoot” available for everyone, to distribute it relentlessly, and to articulate it at every opportunity. Don’t wait until it is acceptable.

Paul Ehrlich bravely and brilliantly warned humanity of the population crisis in the 1960s, and tried to get the topic on the UN agenda in Stockholm in 1972, and almost succeeded, but was sabotaged by people (including Barry Commoner) who claimed the subject, though correct, was a “non-starter.” So here we are, fifty years down the road, having wasted half a century on pretending, with the population having doubled, and material throughput quadrupled. Meanwhile, we’ve wasted 42 years of climate meetings, allowing political appointees to avoid the real dilemma, while pretending that carbon-capture and mechanical efficiencies would solve the erroneously-described problem.

A leading environmental leader once told me that, although true, she could get “no traction” with the overshoot warning or with population issues. I sympathize, but my response was, and still is: What good is traction if you’re going down the wrong road?

Sometimes the “traction” is to help with fundraising, but I don’t believe that funding is the solution. As often as not, funding is the problem, because the funding represents a huge packet of energy, resources, and person-power, so if the funding is creating traction down the wrong road — tech fixes, better lives for 9, 10, 12 billion people, a marginally more benign American or European empire — it is part of the problem.

So the articulation of the problem includes this: We don’t have another half-century to quibble.

Governments claim to care about risk mitigation, but ignoring the real dilemma is the biggest risk of all. It’s like turning on the air conditioner when the house is on fire.

I believe most of the solutions that will matter will be local: Learn to grow food, grow food, learn about energy, reduce energy throughput, build up local and regional energy sources, protect local ecosystems, build community cohesion, establish systems to create soil, enrich the soil, recycle everything locally, reduce material throughput, set local limits on growth.

Virtually none of this can be achieved globally, but there still exists useful global efforts — including efforts to inform governments of the genuine challenges. I would engage in any global effort that is realistic about the problems we face.

In that case, what are the global priorities: My list starts with universal women’s rights, available contraception, a global promotion campaign for small families, to address unrestrained population growth; a vast reduction of militarism and weapons manufacturing; reduce psychopathic behaviour in governments and institutions; limit corporate power in government and in ecological regulation; reduce/eliminate frivolous consumption, and so forth.

I suggest that to be effective, all this has to be done within the biophysically, ecologically correct context: Humanity is in a state of overshoot, getting worse daily, and all paths out, all genuine solutions, include a large-scale contraction of human enterprise.

So, when you lobby your government for action, don’t equivocate. If your government ignores you because you insist on bringing up these issues, it is better to find out now, rather than in another decade or half century.

Rex Weyler

September 2021


Posted in Experts, Overshoot | Tagged , , | 3 Comments

Over 250 Cognitive biases, fallacies, and errors

Preface. All of us, no matter how much we’ve read about critical thinking, or have a PhD in science, and are even on the lookout for our biases and fallacies can still fall prey to them, after all, we’re only human.

But false belief systems get dangerous when taken too far, resulting in fascism and cults. Consider Qanon, which has inspired violence, intimidation, discourages vaccinations and denies climate change. Trump has yet to deny these claims or disavow QAnon even after the FBI has called them a domestic terror threat. And good luck dissuading them from their beliefs, they will see you as spouting fake news and a part of the problem.

Conspiracy theories and fascism go hand in hand, to see how, read this article:  2021 American fascism isn’t going away.

A scientific paper on Bullsh*t was recently published: “On the reception and detection of pseudo-profound bullshit”, which attempts to identify what makes people susceptible to nonsense. The authors defined BS as a statement that “implies but does not contain adequate meaning or truth”. To form a BS Receptivity scale, they used satirical sites such as www.wisdomofchopra.com (a random phrase generator trained on the online excretions of guru Deepak Chopra) to create vapid, portentous-sounding aphorisms, which were then judged by participants for profundity. The authors found that those who judged this BS as profound were more likely to hold a belief in the supernatural, and that “a bias toward accepting statements as true may be an important component of pseudo-profound BS receptivity” (NewScientist 12 Dec 2015).

What follows is from Wikipedia.  Yikes — we are all delusional!

Critical thinking in the news:

2020 Even If It’s ‘Bonkers,’ Poll Finds Many Believe QAnon And Other Conspiracy Theories

Alice Friedemann   www.energyskeptic.com  author of “Life After Fossil Fuels: A Reality Check on Alternative Energy”, 2021, Springer; “When Trucks Stop Running: Energy and the Future of Transportation”, 2015, Springer, Barriers to Making Algal Biofuels, and “Crunch! Whole Grain Artisan Chips and Crackers”. Podcasts: Collapse Chronicles, Derrick Jensen, Practical Prepping, KunstlerCast 253, KunstlerCast278, Peak Prosperity , XX2 report

***

Cognitive Biases: Decision-making, belief & behavioral biases

  • Ambiguity effect – the tendency to avoid options for which missing information makes the probability seem “unknown.”
  • Anchoring – the tendency to rely too heavily, or “anchor,” on a past reference or on one trait or piece of information when making decisions (also called “insufficient adjustment”).
  • Attentional Bias – the tendency of emotionally dominant stimuli in one’s environment to preferentially draw and hold attention and to neglect relevant data when making judgments of a correlation or association.
  • Availability heuristic – estimating what is more likely by what is more available in memory, which is biased toward vivid, unusual, or emotionally charged examples.
  • Availability cascade – a self-reinforcing process in which a collective belief gains more and more plausibility through its increasing repetition in public discourse (or “repeat something long enough and it will become true”).
  • Backfire effect – Evidence disconfirming our beliefs only strengthens them.
  • Bandwagon effect – the tendency to do (or believe) things because many other people do (or believe) the same. Related to groupthink and herd behavior.
  • Base rate neglect or Base rate fallacy – the tendency to base judgments on specifics, ignoring general statistical information.
  • Belief bias – an effect where someone’s evaluation of the logical strength of an argument is biased by the believability of the conclusion.
  • Bias blind spot – the tendency to see oneself as less biased than other people.
  • Choice-supportive bias – the tendency to remember one’s choices as better than they actually were.
  • Clustering illusion – the tendency to see patterns where actually none exist. Also referred to as “patternicity” by author Michael Shermer.
  • Confirmation bias – the tendency to search for or interpret information in a way that confirms one’s preconceptions.
  • Congruence bias – the tendency to test hypotheses exclusively through direct testing, in contrast to tests of possible alternative hypotheses.
  • Conjunction fallacy – the tendency to assume that specific conditions are more probable than general ones.
  • Conservatism or Regressive Bias – tendency to underestimate high values and high likelihoods/probabilities/frequencies and overestimate low ones. Based on the observed evidence, estimates are not extreme enough
  • Contrast effect – the enhancement or diminishing of a weight or other measurement when compared with a recently observed contrasting object.
  • Denomination effect – the tendency to spend more money when it is denominated in small amounts (e.g. coins) rather than large amounts (e.g. bills).[14]
  • Distinction bias – the tendency to view two options as more dissimilar when evaluating them simultaneously than when evaluating them separately.
  • Empathy gap – the tendency to underestimate the influence or strength of feelings, in either oneself or others.
  • Endowment effect – the fact that people often demand much more to give up an object than they would be willing to pay to acquire it.
  • Exaggerated expectation – based on the estimates, real-world evidence turns out to be less extreme than our expectations (conditionally inverse of the conservatism bias).
  • Experimenter’s or Expectation bias – the tendency for experimenters to believe, certify, and publish data that agree with their expectations for the outcome of an experiment, and to disbelieve, discard, or downgrade the corresponding weightings for data that appear to conflict with those expectations.
  • Focusing effect – the tendency to place too much importance on one aspect of an event; causes error in accurately predicting the utility of a future outcome.
  • Forward Bias – the tendency to create models based on past data which are validated only against that past data.
  • Framing effect – drawing different conclusions from the same information, depending on how that information is presented.
  • Frequency illusion – the illusion in which a word, a name or other thing that has recently come to one’s attention suddenly appears “everywhere” with improbable frequency (see also recency illusion). AKA “The Baader-Meinhof phenomenon”.
  • Gambler’s fallacy – the tendency to think that future probabilities are altered by past events, when in reality they are unchanged. Results from an erroneous conceptualization of the Law of large numbers. For example, “I’ve flipped heads with this coin five times consecutively, so the chance of tails coming out on the sixth flip is much greater than heads.”
  • Hard-easy effect – Based on a specific level of task difficulty, the confidence in judgments is too conservative and not extreme enough
  • Hindsight bias – sometimes called the “I-knew-it-all-along” effect, the tendency to see past events as being predictable at the time those events happened.
  • Hostile media effect – the tendency to see a media report as being biased due to one’s own strong partisan views.
  • Hyperbolic discounting – the tendency for people to have a stronger preference for more immediate payoffs relative to later payoffs, where the tendency increases the closer to the present both payoffs are.
  • Illusion of control – the tendency to overestimate one’s degree of influence over other external events.
  • Illusory correlation – inaccurately perceiving a relationship between two unrelated events.
  • Impact bias – the tendency to overestimate the length or the intensity of the impact of future feeling states.
  • Information bias – tendency to seek information even when it cannot affect action.
  • Irrational escalation – the phenomenon where people justify increased investment in a decision, based on the cumulative prior investment, despite new evidence suggesting that the decision was probably wrong.
  • Just-world hypothesis – the tendency for people to want to believe that the world is fundamentally just, causing them to rationalize an otherwise inexplicable injustice as deserved by the victim(s).
  • Loss aversion – “the disutility of giving up an object is greater than the utility associated with acquiring it”. (see also Sunk cost effects and Endowment effect).
  • Mere exposure effect – the tendency to express undue liking for things merely because of familiarity with them.
  • Money illusion – the tendency to concentrate on the nominal (face value) of money rather than its value in terms of purchasing power.
  • Moral credential effect – the tendency of a track record of non-prejudice to increase subsequent prejudice.
  • Negativity bias – the tendency to pay more attention and give more weight to negative than positive experiences or other kinds of information.
  • Neglect of probability – the tendency to completely disregard probability when making a decision under uncertainty.
  • Normalcy bias – the refusal to plan for, or react to, a disaster which has never happened before.
  • Observer-expectancy effect – when a researcher expects a given result and therefore unconsciously manipulates an experiment or misinterprets data in order to find it (see also subject-expectancy effect).
  • Omission bias – the tendency to judge harmful actions as worse, or less moral, than equally harmful omissions (inactions).
  • Optimism bias – the tendency to be over-optimistic, overestimating favorable and pleasing outcomes (see also wishful thinking, optimism bias, valence effect, positive outcome bias).
  • Ostrich effect – ignoring an obvious (negative) situation.
  • Outcome bias – the tendency to judge a decision by its eventual outcome instead of based on the quality of the decision at the time it was made.
  • Overconfidence effect – excessive confidence in one’s own answers to questions. For example, for certain types of questions, answers that people rate as “99% certain” turn out to be wrong 40% of the time.
  • Pareidolia – a vague and random stimulus (often an image or sound) is perceived as significant, e.g., seeing images of animals or faces in clouds, the man in the moon, and hearing hidden messages on records played in reverse.
  • Pessimism bias – the tendency for some people, especially those suffering from depression, to overestimate the likelihood of negative things happening to them.
  • Placement bias – tendency to believe ourselves to be better than others at tasks at which we rate ourselves above average (also Illusory superiority or Better-than-average effect) and tendency to believe ourselves to be worse than others at tasks at which we rate ourselves below average (also Worse-than-average effect
  • Planning fallacy – the tendency to underestimate task-completion times.
  • Post-purchase rationalization – the tendency to persuade oneself through rational argument that a purchase was a good value.
  • Primacy effect – the greater ease of recall of initial items in a sequence compared to items in the middle of the sequence.
  • Pro-innovation bias – the tendency to reflect a personal bias towards an invention/innovation, while often failing to identify limitations and weaknesses or address the possibility of failure.
  • Pseudocertainty effect – the tendency to make risk-averse choices if the expected outcome is positive, but make risk-seeking choices to avoid negative outcomes.
  • Reactance – the urge to do the opposite of what someone wants you to do out of a need to resist a perceived attempt to constrain your freedom of choice.
  • Recency bias – a cognitive bias that results from disproportionate salience of recent stimuli or observations — the tendency to weigh recent events more than earlier events (see also peak-end rule).
  • Recency illusion – the illusion that a phenomenon, typically a word or language usage, that one has just begun to notice is a recent innovation (see also frequency illusion).
  • Regressive Bayesian likelihood – estimates of conditional probabilities are conservative and not extreme enough
  • Restraint bias – the tendency to overestimate one’s ability to show restraint in the face of temptation.
  • Selective perception – the tendency for expectations to affect perception.
  • Semmelweis reflex – the tendency to reject new evidence that contradicts a paradigm.[46]
  • Social comparison bias – the tendency, when making hiring decisions, to favour potential candidates who don’t compete with one’s own particular strengths.
  • Status quo bias – the tendency to like things to stay relatively the same (see also loss aversion, endowment effect, and system justification).
  • Stereotyping – expecting a member of a group to have certain characteristics without having actual information about that individual.
  • Subadditivity effect – the tendency to estimate that the likelihood of an event is less than the sum of its (more than two) mutually exclusive components.
  • Subjective validation – perception that something is true if a subject’s belief demands it to be true. Also assigns perceived connections between coincidences.
  • Unit bias — the tendency to want to finish a given unit of a task or an item. Strong effects on the consumption of food in particular.
  • Well travelled road effect – underestimation of the duration taken to traverse oft-traveled routes and over-estimate the duration taken to traverse less familiar routes.
  • Zero-risk bias – preference for reducing a small risk to zero over a greater reduction in a larger risk.

Social biases

  1. Actor–observer bias – the tendency for explanations of other individuals’ behaviors to overemphasize the influence of their personality and underemphasize the influence of their situation (see also Fundamental attribution error), and for explanations of one’s own behaviors to do the opposite (that is, to overemphasize the influence of our situation and underemphasize the influence of our own personality).
  2. Defensive attribution hypothesis – defensive attributions are made when individuals witness or learn of a mishap happening to another person. In these situations, attributions of responsibility to the victim or harm-doer for the mishap will depend upon the severity of the outcomes of the mishap and the level of personal and situational similarity between the individual and victim. More responsibility will be attributed to the harm-doer as the outcome becomes more severe, and as personal or situational similarity decreases.
  3. Dunning–Kruger effect an effect in which incompetent people fail to realize they are incompetent, because they lack the skill to distinguish between competence and incompetence
  4. Egocentric bias – occurs when people claim more responsibility for themselves for the results of a joint action than an outside observer would.
  5. Forer effect (aka Barnum effect) – the tendency to give high accuracy ratings to descriptions of their personality that supposedly are tailored specifically for them, but are in fact vague and general enough to apply to a wide range of people. For example, horoscopes.
  6. False consensus effect – the tendency for people to overestimate the degree to which others agree with them.
  7. Fundamental attribution error – the tendency for people to over-emphasize personality-based explanations for behaviors observed in others while under-emphasizing the role and power of situational influences on the same behavior
  8. Halo effect – the tendency for a person’s positive or negative traits to “spill over” from one area of their personality to another in others’ perceptions of them (see also physical attractiveness stereotype).
  9. Illusion of asymmetric insight – people perceive their knowledge of their peers to surpass their peers’ knowledge of them.
  10. Illusion of transparency – people overestimate others’ ability to know them, and they also overestimate their ability to know others.
  11. Illusory superiority – overestimating one’s desirable qualities, and underestimating undesirable qualities, relative to other people. (Also known as “Lake Wobegon effect,” “better-than-average effect,” or “superiority bias”).
  12. Ingroup bias – the tendency for people to give preferential treatment to others they perceive to be members of their own groups.
  13. Just-world phenomenon – the tendency for people to believe that the world is just and therefore people “get what they deserve.”
  14. Moral luck – the tendency for people to ascribe greater or lesser moral standing based on the outcome of an event rather than the intention
  15. Outgroup homogeneity bias – individuals see members of their own group as being relatively more varied than members of other groups.
  16. Projection bias – the tendency to unconsciously assume that others (or one’s future selves) share one’s current emotional states, thoughts and values.
  17. Self-serving bias – the tendency to claim more responsibility for successes than failures. It may also manifest itself as a tendency for people to evaluate ambiguous information in a way beneficial to their interests (see also group-serving bias).
  18. System justification – the tendency to defend and bolster the status quo. Existing social, economic, and political arrangements tend to be preferred, and alternatives disparaged sometimes even at the expense of individual and collective self-interest. (See also status quo bias.)
  19. Trait ascription bias – the tendency for people to view themselves as relatively variable in terms of personality, behavior, and mood while viewing others as much more predictable.
  20. Ultimate attribution error – similar to the fundamental attribution error, in this error a person is likely to make an internal attribution to an entire group instead of the individuals within the group.

Memory errors

  • Cryptomnesia – a form of misattribution where a memory is mistaken for imagination.
  • Egocentric bias – recalling the past in a self-serving manner, e.g., remembering one’s exam grades as being better than they were, or remembering a caught fish as being bigger than it was.
  • False memory – a form of misattribution where imagination is mistaken for a memory.
  • Hindsight bias – filtering memory of past events through present knowledge, so that those events look more predictable than they actually were; also known as the “I-knew-it-all-along effect.”
  • Positivity effect – older adults remember relatively more positive than negative things, compared with younger adults
  • Reminiscence bump – the effect that people tend to recall more personal events from adolescence and early adulthood than from other lifetime periods.
  • Rosy retrospection – the tendency to rate past events more positively than they had actually rated them when the event occurred.
  • Self-serving bias – perceiving oneself responsible for desirable outcomes but not responsible for undesirable ones.
  • Suggestibility – a form of misattribution where ideas suggested by a questioner are mistaken for memory.
  • Telescoping effect – the effect that recent events appear to have occurred more remotely and remote events appear to have occurred more recently.
  • Von Restorff effect – the tendency for an item that “stands out like a sore thumb” to be more likely to be remembered than other items.

Common theoretical causes of some cognitive biases

List of memory biases

  1. Choice-supportive bias: remembering chosen options as having been better than rejected options
  1. Change bias: after an investment of effort in producing change, remembering one’s past performance as more difficult than it actually was
  2. Childhood amnesia: the retention of few memories from before the age of four
  3. Consistency bias: incorrectly remembering one’s past attitudes and behaviour as resembling present attitudes and behaviour.
  4. Context effect: that cognition and memory are dependent on context, such that out-of-context memories are more difficult to retrieve than in-context memories (e.g., recall time and accuracy for a work-related memory will be lower at home, and vice versa)
  5. Cross-race effect: the tendency for people of one race to have difficulty identifying members of a race other than their own
  6. Cryptomnesia: a form of misattribution where a memory is mistaken for imagination, because there is no subjective experience of it being a memory.
  7. Egocentric bias: recalling the past in a self-serving manner, e.g., remembering one’s exam grades as being better than they were, or remembering a caught fish as bigger than it really was
  8. Fading affect bias: a bias in which the emotion associated with unpleasant memories fades more quickly than the emotion associated with positive events.
  9. Generation effect (Self-generation effect): that self-generated information is remembered best. For instance, people are better able to recall memories of statements that they have generated than similar statements generated by others.
  10. Google effect: the tendency to forget information that can be easily found online.
  11. Hindsight bias: the inclination to see past events as being predictable; also called the “I-knew-it-all-along” effect.
  12. Humor effect: that humorous items are more easily remembered than non-humorous ones, which might be explained by the distinctiveness of humor, the increased cognitive processing time to understand the humor, or the emotional arousal caused by the humor.
  13. Illusion-of-truth effect: that people are more likely to identify as true statements those they have previously heard (even if they cannot consciously remember having heard them), regardless of the actual validity of the statement. In other words, a person is more likely to believe a familiar statement than an unfamiliar one.
  14. Leveling and Sharpening: memory distortions introduced by the loss of details in a recollection over time, often concurrent with sharpening or selective recollection of certain details that take on exaggerated significance in relation to the details or aspects of the experience lost through leveling. Both biases may be reinforced over time, and by repeated recollection or re-telling of a memory.
  15. Levels-of-processing effect: that different methods of encoding information into memory have different levels of effectiveness
  16. List-length effect: a smaller percentage of items are remembered in a longer list, but as the length of the list increases, the absolute number of items remembered increases as well.
  17. Misinformation effect: misinformation affects people’s reports of their own memory.
  18. Misattribution: when information is retained in memory but the source of the memory is forgotten. One of Schacter’s (1999) Seven Sins of Memory, Misattribution was divided into Source Confusion, Cryptomnesia and False Recall/False Recognition.
  19. Modality effect: that memory recall is higher for the last items of a list when the list items were received via speech than when they were received via writing.
  20. Mood congruent memory bias: the improved recall of information congruent with one’s current mood.
  21. Next-in-line effect: that a person in a group has diminished recall for the words of others who spoke immediately before or after this person.
  22. Osborn effect: that being intoxicated with a mind-altering substance makes it harder to retrieve motor patterns from the Basal Ganglion.
  23. Part-list cueing effect: being shown some items from a list makes it harder to retrieve the other items
  24. Peak-end effect: that people seem to perceive not the sum of an experience but the average of how it was at its peak (e.g. pleasant or unpleasant) and how it ended.
  25. Persistence: the unwanted recurrence of memories of a traumatic event.
  26. Picture superiority effect: that concepts are much more likely to be remembered experientially if they are presented in picture form than if they are presented in word form.
  27. Positivity effect: older adults favor positive over negative information in their memories.
  28. Primacy effect, Recency effect & Serial position effect: that items near the end of a list are the easiest to recall, followed by the items at the beginning of a list; items in the middle are the least likely to be remembered
  29. Processing difficulty effect
  30. Reminiscence bump: the recalling of more personal events from adolescence and early adulthood than personal events from other lifetime periods
  31. Rosy retrospection: the remembering of the past as having been better than it really was.
  32. Self-relevance effect: that memories relating to the self are better recalled than similar information relating to others.
  33. Source Confusion: misattributing the source of a memory, e.g. misremembering that one saw an event personally when actually it was seen on television.
  34. Spacing effect: that information is better recalled if exposure to it is repeated over a longer span of time.
  35. Stereotypical bias: memory distorted towards stereotypes (e.g. racial or gender), e.g. “black-sounding” names being misremembered as names of criminals
  36. Suffix effect: the weakening of the recency effect in the case that an item is appended to the list that the subject is not required to recall
  37. Suggestibility: a form of misattribution where ideas suggested by a questioner are mistaken for memory.
  38. Telescoping effect: tendency to displace recent events backward in time and remote events forward in time, so that recent events appear more remote, and remote events, more recent.
  39. Testing effect: frequent testing of material that has been committed to memory improves memory recall.
  40. Tip of the tongue phenomenon: when a subject is able to recall parts of an item, or related information, but is frustratingly unable to recall the whole item. This is thought an instance of “blocking” where multiple similar memories are being recalled and interfere with each other
  41. Verbatim effect: the “gist” of what someone has said is better remembered than the verbatim wording
  42. Von Restorff effect: that an item that sticks out is more likely to be remembered than other items
  43. Zeigarnik effect: uncompleted or interrupted tasks are remembered better than completed ones.

Formal fallacies is an error in logic that can be seen in the argument’s form without an understanding of the argument’s content. All formal fallacies are specific types of non sequiturs.

  • Appeal to authority – (argumentum ad verecundiam) deductively fallacious; even legitimate authorities speaking on their areas of expertise may affirm a falsehood. However, if not using a deductive argument, a logical fallacy is only asserted when the source is not a legitimate expert on the topic at hand, or their conclusion(s) are in direct opposition to other expert consensus. Appeal to authority does not condone to agreeing to the argument.
  • Appeal to probability – assumes that because something could happen, it is inevitable that it will happen.
  • Argument from fallacy – assumes that if an argument for some conclusion is fallacious, then the conclusion itself is false.
  • Base rate fallacy – making a probability judgment based on conditional probabilities, without taking into account the effect of prior probabilities.
  • Conjunction fallacy – assumption that an outcome simultaneously satisfying multiple conditions is more probable than an outcome satisfying a single one of them.
  • Masked man fallacy (illicit substitution of identicals) – the substitution of identical designators in a true statement can lead to a false one.

Propositional fallacies

Quantificational fallacies

Existential fallacy – an argument has two universal premises and a particular conclusion.

Formal syllogistic fallacies– logical fallacies that occur in syllogisms.

Informal fallacies — arguments that are fallacious for reasons other than structural (formal) flaws and which usually require examination of the argument’s content.

  • Argument from ignorance (appeal to ignorance, argumentum ad ignorantiam) – assuming that a claim is true (or false) because it has not been proven false (true) or cannot be proven false (true).
  • Argument from repetition (argumentum ad nauseam) – signifies that it has been discussed extensively until nobody cares to discuss it anymore
  • Argument from silence (argumentum e silentio) – where the conclusion is based on silence of opponent, failing to give proof, based on “lack of evidence”
  • Argumentum verbosium – See Proof by verbosity, below.
  • Begging the question (petitio principii) – where the conclusion of an argument is implicitly or explicitly assumed in one of the premises
  • (shifting the) Burden of proof (see – onus probandi) – I need not prove my claim, you must prove it is false
  • Circular cause and consequence – where the consequence of the phenomenon is claimed to be its root cause
  • Continuum fallacy (fallacy of the beard, line-drawing fallacy, sorites fallacy, fallacy of the heap, bald man fallacy) – improperly rejecting a claim for being imprecise.
  • Correlation does not imply causation (cum hoc ergo propter hoc)–a faulty assumption that correlation between 2 variables implies that one causes the other.
  • Correlative-based fallacies
  • Equivocation – the misleading use of a term with more than one meaning (by glossing over which meaning is intended at a particular time)
  • Ecological fallacy – inferences about the nature of specific individuals are based solely upon aggregate statistics collected for the group to which those individuals belong.
  • Etymological fallacy – which reasons that the original or historical meaning of a word or phrase is necessarily similar to its actual present-day meaning.
  • Fallacy of composition – assuming that something true of part of a whole must also be true of the whole
  • Fallacy of division – assuming that something true of a thing must also be true of all or some of its parts
  • False dilemma (false dichotomy, fallacy of bifurcation, black-or-white fallacy) – two alternative statements are held to be the only possible options, when in reality there are more.
  • If-by-whiskey – an argument that supports both sides of an issue by using terms that are selectively emotionally sensitive.
  • Fallacy of many questions (complex question, fallacy of presupposition, loaded question, plurium interrogationum) – someone asks a question that presupposes something that has not been proven or accepted by all the people involved. This fallacy is often used rhetorically, so that the question limits direct replies to those that serve the questioner’s agenda.
  • Ludic fallacy – the belief that the outcomes of a non-regulated random occurrences can be encapsulated by a statistic; a failure to take into account unknown unknowns in determining the probability of an event’s taking place.
  • Fallacy of the single cause (causal oversimplification) – it is assumed that there is one, simple cause of an outcome when in reality it may have been caused by a number of only jointly sufficient causes.
  • False attribution – an advocate appeals to an irrelevant, unqualified, unidentified, biased or fabricated source in support of an argument
    • Fallacy of quoting out of context (contextomy) – refers to the selective excerpting of words from their original context in a way that distorts the source’s intended meaning.
  • Argument to moderation (false compromise, middle ground, fallacy of the mean) – assuming that the compromise between two positions is always correct
  • Gambler’s fallacy – the incorrect belief that separate, independent events can affect the likelihood of another random event.
  • Historian’s fallacy – occurs when one assumes that decision makers of the past viewed events from the same perspective and having the same information as those subsequently analyzing the decision. (Not to be confused with presentism, which is a mode of historical analysis in which present-day ideas, such as moral standards, are projected into the past.)
  • Homunculus fallacy – where a “middle-man” is used for explanation, this usually leads to regressive middle-man. Explanations without actually explaining the real nature of a function or a process. Instead, it explains the concept in terms of the concept itself, without first defining or explaining the original concept.
  • Incomplete comparison – where not enough information is provided to make a complete comparison
  • Inconsistent comparison – where different methods of comparison are used, leaving one with a false impression of the whole comparison
  • Intentional fallacy – addresses the assumption that the meaning intended by the author of a literary work is of primary importance
  • Ignoratio elenchi (irrelevant conclusion, missing the point) – an argument that may in itself be valid, but does not address the issue in question.
  • Kettle logic – using multiple inconsistent arguments to defend a position.
  • Mind projection fallacy – when one considers the way he sees the world as the way the world really is.
  • Moving the goalposts (raising the bar) – argument in which evidence presented in response to a specific claim is dismissed and some other (often greater) evidence is demanded
  • Nirvana fallacy (perfect solution fallacy) – when solutions to problems are rejected because they are not perfect.
  • Onus probandi – from Latin “onus probandi incumbit ei qui dicit, non ei qui negat” the burden of proof is on the person who makes the claim, not on the person who denies (or questions the claim). It is a particular case of the “argumentum ad ignorantiam” fallacy, here the burden is shifted on the person defending against the assertion
  • Petitio principii – see begging the question
  • Post hoc ergo propter hoc (false cause, coincidental correlation, correlation not causation) – X happened then Y happened; therefore X caused Y
  • Proof by verbosity (argumentum verbosium, proof by intimidation) – submission of others to an argument too complex and verbose to reasonably deal with in all its intimate details. (See also Gish Gallop and argument from authority.)
  • Prosecutor’s fallacy – a low probability of false matches does not mean a low probability of some false match being found
  • Psychologist’s fallacy – an observer presupposes the objectivity of his own perspective when analyzing a behavioral event
  • Red herring – a speaker attempts to distract an audience by deviating from the topic at hand by introducing a separate argument which the speaker believes will be easier to speak to.
  • Regression fallacy – ascribes cause where none exists. The flaw is failing to account for natural fluctuations. It is frequently a special kind of the post hoc fallacy.
  • Reification (hypostatization) – a fallacy of ambiguity, when an abstraction (abstract belief or hypothetical construct) is treated as if it were a concrete, real event or physical entity. In other words, it is the error of treating as a “real thing” something which is not a real thing, but merely an idea.
  • Retrospective determinism – the argument that because some event has occurred, its occurrence must have been inevitable beforehand
  • Special pleading – where a proponent of a position attempts to cite something as an exemption to a generally accepted rule or principle without justifying the exemption
  • Straw man – an argument based on misrepresentation of opponent’s position twisting his words, or by means of [false]assumptions
  • Wrong direction – cause and effect are reversed. The cause is said to be the effect and vice versa.

Faulty generalizations reach a conclusion from weak premises. Unlike fallacies of relevance, in fallacies of defective induction, the premises are related to the conclusions yet only weakly buttress the conclusions. A faulty generalization is thus produced.

  • Accident – an exception to a generalization is ignored.
    • No true Scotsman – when a generalization is made true only when a counterexample is ruled out on shaky grounds.
  • Cherry picking (suppressed evidence, incomplete evidence) – act of pointing at individual cases or data that seem to confirm a particular position, while ignoring a significant portion of related cases or data that may contradict that position.
  • False analogy – an argument by analogy in which the analogy is poorly suited.
  • Hasty generalization (fallacy of insufficient statistics, fallacy of insufficient sample, fallacy of the lonely fact, leaping to a conclusion, hasty induction, secundum quid, converse accident) – basing a broad conclusion on a small sample.
  • Misleading vividness – involves describing an occurrence in vivid detail, even if it is an exceptional occurrence, to convince someone that it is a problem.
  • Overwhelming exception – an accurate generalization that comes with qualifications which eliminate so many cases that what remains is much less impressive than the initial statement might have led one to assume.
  • Pathetic fallacy – when an inanimate object is declared to have characteristics of animate objects.
  • Thought-terminating cliché – a commonly used phrase, sometimes passing as folk wisdom, used to quell cognitive dissonance, conceal lack of thought-entertainment, move onto other topics etc. but in any case, end the debate with a cliche—not a point.

Red herring fallacies  — argument given in response to another argument, which is irrelevant and draws attention away from subject of argument. See also irrelevant conclusion.

  • Ad hominem – attacking the arguer instead of the argument.
    • Poisoning the well – a type of ad hominem where adverse information about a target is presented with the intention of discrediting everything that the target person says
    • Abusive fallacy – a subtype of “ad hominem” when it turns into name-calling rather than arguing about the originally proposed argument.
  • Argumentum ad baculum (appeal to the stick, appeal to force, appeal to threat) – an argument made through coercion or threats of force to support position
  • Argumentum ad populum (appeal to belief, appeal to the majority, appeal to the people) – where a proposition is claimed to be true or good solely because many people believe it to be so
  • Appeal to equality – where an assertion is deemed true or false based on an assumed pretense of equality.
  • Association fallacy (guilt by association) – arguing that because two things share a property they are the same
  • Appeal to authority – where an assertion is deemed true because of the position or authority of the person asserting it.
  • Appeal to consequences (argumentum ad consequentiam) – the conclusion is supported by a premise that asserts positive or negative consequences from some course of action in an attempt to distract from the initial discussion
  • Appeal to emotion – where an argument is made due to the manipulation of emotions, rather than the use of valid reasoning
    • Appeal to fear – a specific type of appeal to emotion where an argument is made by increasing fear and prejudice towards the opposing side
    • Appeal to flattery – a specific type of appeal to emotion where an argument is made due to the use of flattery to gather support.
    • Appeal to pity (argumentum ad misericordiam) – an argument attempts to induce pity to sway opponents
    • Appeal to ridicule – an argument is made by presenting the opponent’s argument in a way that makes it appear ridiculous
    • Appeal to spite – a specific type of appeal to emotion where an argument is made through exploiting people’s bitterness or spite towards an opposing party
    • Wishful thinking – a specific type of appeal to emotion where a decision is made according to what might be pleasing to imagine, rather than according to evidence or reason.
  • Appeal to motive – where a premise is dismissed by calling into question the motives of its proposer
  • Appeal to novelty (argumentum ad novitam) – where a proposal is claimed to be superior or better solely because it is new or modern.
  • Appeal to poverty (argumentum ad Lazarum) – supporting a conclusion because the arguer is poor (or refuting because the arguer is wealthy).
  • Appeal to tradition (argumentum ad antiquitam) – a conclusion supported solely because it has long been held to be true.
  • Appeal to wealth (argumentum ad crumenam) – supporting a conclusion because the arguer is wealthy (or refuting because the arguer is poor). (Sometimes taken together with the appeal to poverty as a general appeal to the arguer’s financial situation.)
  • Argument from silence (argumentum ex silentio) – a conclusion based on silence or lack of contrary evidence
  • Chronological snobbery – where a thesis is deemed incorrect because it was commonly held when something else, clearly false, was also commonly held
  • Genetic fallacy – where a conclusion is suggested based solely on something or someone’s origin rather than its current meaning or context.
  • Judgmental language – insulting or pejorative language to influence the recipient’s judgment
  • Naturalistic fallacy (is–ought fallacy, naturalistic fallacy) – claims about what ought to be on the basis of statements about what is.
  • Reductio ad Hitlerum (playing the Nazi card) – comparing an opponent or their argument to Hitler or Nazism in an attempt to associate a position with one that is universally reviled (See also – Godwin’s law)
  • Straw man – an argument based on misrepresentation of an opponent’s position
  • Texas sharpshooter fallacy – improperly asserting a cause to explain a cluster of data
  • Tu quoque (“you too”, appeal to hypocrisy) – the argument states that a certain position is false or wrong and/or should be disregarded because its proponent fails to act consistently in accordance with that position[
  • Two wrongs make a right – occurs when it is assumed that if one wrong is committed, another wrong will cancel it out.

Conditional or questionable fallacies

  1. Black swan blindness – the argument that ignores low probability, high impact events, thus down playing the role of chance and under representing known risks
  2. Broken window fallacy – an argument which disregards lost opportunity costs (typically non-obvious, difficult to determine or otherwise hidden) associated with destroying property of others, or other ways of externalizing costs onto others. For example, an argument that states breaking a window generates income for a window fitter, but disregards the fact that the money spent on the new window cannot now be spent on new shoes.
  3. Definist fallacy – involves the confusion between two notions by defining one in terms of the other.
  4. Naturalistic fallacy – attempts to prove a claim about ethics by appealing to a definition of the term “good” in terms of either one or more claims about natural properties (sometimes also taken to mean the appeal to nature)
  5. Slippery slope (thin edge of the wedge, camel’s nose) – asserting that a relatively small first step inevitably leads to a chain of related events culminating in some significant impact

Public relations methods and approaches

Airborne leaflet propaganda        Astroturfing / Astroturf PR: fake grassroots       Atrocity story   Bandwagon effect    Big lie    Black propaganda    Buzzword    Card stacking    Code word    Communist propaganda     Corporate image  Corporate propaganda   Cult of personality     Demonization    Doublespeak  Disinformation: providing false information   Dog-whistle politics       Enterperience: fusing entertainment and experience together          Euphemisms, to advance a cause or position (see also Political correctness)      Factoid   Fedspeak   Framing   Front organization    Glittering generality     Indoctrination       Information warfare: the practice of disseminating information in an attempt to advance your agenda relative to a competing viewpoint          Junk science           Lesser of two evils principle           Loaded language         Marketing: commercial and business techniques                Media bias                 Media manipulation: the attempt to influence broadcast media decisions in an attempt to present your view to a mass audience     Misuse of statistics        News management: PR techniques concerned with the news media    News propaganda   Newspeak        Plain folks         Propaganda film    Public service announcement       Revolutionary propaganda          Self propaganda    Social marketing: techniques used in behavioral change, such as health promotion      Sound science    Rebuttal: a type of news management technique    Rhetoric        Slogan       Transfer (propaganda)      Video news release    Weasel Word          White propaganda                     Yellow journalism

Cognitive distortion

  • All-or-nothing thinking (splitting) – Conception in absolute terms, like “always”, “every”, “never”, and “there is no alternative”. (See also “false dilemma” or “false dichotomy”.)
  • Overgeneralization – Extrapolating limited experiences and evidence to broad generalizations. (See also faulty generalization and misleading vividness.)
  • Magical thinking – Expectation of certain outcomes based on performance of unrelated acts or utterances. (See also wishful thinking.)
  • Mental filter – Inability to view positive or negative features of an experience, for example, noticing only tiny imperfection in a piece of otherwise useful clothing.
  • Disqualifying the positive – Discounting positive experiences for arbitrary, ad hoc reasons.
  • Jumping to conclusions – Reaching conclusions (usually negative) from little (if any) evidence. Two specific subtypes are also identified:
    • Mind reading – Sense of access to special knowledge of the intentions or thoughts of others.
    • Fortune telling – Inflexible expectations for how things will turn out before they happen.
  • Magnification and minimization – Magnifying or minimizing a memory or situation such that they no longer correspond to objective reality. This is common enough in the normal population to popularize idioms such as “make a mountain out of a molehill.” In depressed clients, often the positive characteristics of other people are exaggerated and negative characteristics are understated. There is one subtype of magnification:
    • Catastrophizing – Inability to foresee anything other than the worst possible outcome, however unlikely, or experiencing a situation as unbearable or impossible when it is just uncomfortable.
  • Emotional reasoning – Experiencing reality as a reflection of emotions, e.g. “I feel it, therefore it must be true.”
  • Should statements – Patterns of thought which imply the way things “should” or “ought” to be rather than the actual situation the person is faced with, or having rigid rules which the person believes will “always apply” no matter what the circumstances are. Albert Ellis termed this “Musturbation”.
  • Labeling and mislabeling – Limited thinking about behaviors or events due to reliance on names; related to overgeneralization. Rather than describing the specific behavior, the person assigns a label to someone or himself that implies absolute and unalterable terms. Mislabeling involves describing an event with language that is highly colored and emotionally loaded.
  • PersonalizationAttribution of personal responsibility (or causal role or blame) for events over which a person has no control.
Posted in Critical Thinking | Tagged , , | Comments Off on Over 250 Cognitive biases, fallacies, and errors

Aquifer decline in California

Groundwater basins in California with the following color key: red: critically over drafted, orange: high priority, yellow: medium priority (Henry 2019)

Preface. On top of aquifer depletion, water shortages in California are also expected in the future as rainfall and snowfall decline and snow melts earlier.

Over half of Americans rely on underground aquifers for drinking water (Glennon 2002). Seventy percent of our groundwater is used to grow irrigated crops. The rest is used by livestock, aquaculture, industry, mining, and thermoelectric power plants (USGS 2018). 

Two of the most important aquifers in the U.S. are the multiple aquifers beneath the Central Valley in California, and the Ogallala beneath the Great Plains. Both are in arid regions, but they are also the nation’s breadbaskets. More than half of America’s food is grown in these two regions.

Aquifers in California provide a third of the state’s water. 

At the rate farmers are depleting California aquifers, which lie beneath the best soil in the nation, this region could run out of groundwater as early as the 2030s (de Graaf et al. 2015).  Poof, a big bite of U.S. food disappears from our plates. From 2000-2008, California used up a fifth of all the aquifer water that had ever existed there (Konikow 2013), and even more during the great drought of 2011 to 2017.

When too much groundwater is withdrawn, the ground can literally sink beneath us. Irreversible compaction can occur, causing permanent subsidence and loss of storage capacity. Subsidence also breaks roads, pipelines, and canals.   

When too much water is pumped from aquifers, rivers and lakes can dry up. Saltwater may intrude, rendering water undrinkable. This problem is quite serious in California as well as Florida, Texas, and South Carolina (Glennon 2002).

California grows a large percentage of the food in the nationalmost half of all fruits, nuts, and vegetables and a whopping share of livestock and dairy as well.  There are 66 food crops produced in California more than any other state, including nearly all of the almonds, artichokes, dates, figs, raisins, kiwi, olives, peaches, pistachios, prunes, pomegranates, sweet rice and walnuts.

Crops require a mind-boggling amount of water. It takes 13,676 liters (3613 gallons) of rainfall or irrigation water to produce enough soybeans to make just one liter (0.25 gallon) of biodiesel.  Corn is more efficient, though still a heavy drinker, using 2,570 liters (680 gallons) of water per liter of ethanol produced (Gerbens-Leenes et al. 2009).  

Although most Californians are under the impression that fruit and nut crops use the most water, the crop types with the greatest rates of aquifer subsidence and groundwater use are field crops like corn and soy, followed by pasture crops like alfalfa, truck crops like tomatoes, and lastly, fruit and nut crops like almonds and grapes (Levy et al 2020).

2016-9-27 California’s almond boom has ramped up water use, consumed wetlands and stressed pollinators.  Geological Society of America. Land converted to grow almonds (16,000 acres were wetlands) between 2007 & 2014 has led to a 27% annual increase in irrigation demand despite the worst drought in over a millennia

Alice Friedemann   www.energyskeptic.com  author of “Life After Fossil Fuels: A Reality Check on Alternative Energy”, 2021, Springer; “When Trucks Stop Running: Energy and the Future of Transportation”, 2015, Springer, Barriers to Making Algal Biofuels, and “Crunch! Whole Grain Artisan Chips and Crackers”. Podcasts: Collapse Chronicles, Derrick Jensen, Practical Prepping, KunstlerCast 253, KunstlerCast278, Peak Prosperity , XX2 report

***

Gasparini A (2021) Scientists worry that California’s ‘fossil water’ is vanishing. Mercury News.

California has ancient aquifers created by rain and snow over 10,000 years ago. Research on fossil water from Lawrence Livermore National Laboratory suggests that managers of drinking wells that pump fossil water can’t rely on it being replenished — especially during times of drought. This water wont be replenished for hundreds or even thousands of years.

The study found clear evidence that 7% of the 2,330 California’s drinking wells tested are producing fossil water — and 22% of those wells are pumping mixed-age water containing at least some ancient water. That means that many Californians are already using fossil water to shower, flush their toilets and irrigate their lawns without knowing it.

Excessive agricultural and urban water use has depleted many of California’s aquifers, which serve as massive underground reservoirs. In some areas, the problem is so severe that the land is sinking — permanently in some cases.

Konikow, L.F., 2013, Groundwater depletion in the United States (1900−2008): U.S. Geological Survey Scientific Investigations Report 2013−5079, 63 pages.

GroundwaterDepletion 1900-2008 CACumulative groundwater depletion in the Central Valley of California, 20,000 square miles, 1900 through 2008

California lost nearly 145 cubic kilometers of groundwater since 1880, with a fifth of that water disappearing in just 9 years from 2000 to 2008 (31.4 km3).

In parts of the San Joaquin Valley and Tulare Basin, water levels had declined nearly 400 feet, depleting groundwater from storage and lowering water levels to as much as 100 feet below sea level. Long-term water-level records in some wells indicate that water levels were already declining at substantial rates when water levels were first observed as early as the 1930s. The extensive groundwater pumping caused changes to the groundwater flow system, changes in water levels, changes in aquifer storage, and widespread land subsidence in the San Joaquin Valley, which began in the 1920s.

The thickness of sediments comprising the freshwater parts of the aquifer averages about 3000 feet in the San Joaquin Valley and 1500 feet in the Sacramento Valley. The shallow part of the aquifer system is unconfined, whereas the deeper part is semi-confined or confined.

References

de Graaf IEM, van Beek LPH, Sutanudjaja EH, et al (2015), Limits to global groundwater consumption, AGU Fall Meeting, San Francisco, California, oral presentation.  https://news.agu.org/press-release/agu-fall-meeting-groundwater-resources-around-the-world-could-be-depleted-by-2050s/

Gerbens-Leenes W, Hoekstra AY, van der Meer TH (2009) The water footprint of bioenergy. Proceedings of the National Academy of Sciences 106: 10219-10223.

Glennon R (2002) Water Follies. Groundwater Pumping and the Fate of America’s Fresh Waters. Island Press.

Henry L (2019) Groundwater. A firehose of paperwork is pointed at state water officials. SJV water.  https://sjvwater.org/a-firehose-of-paperwork-is-pointed-at-state-water-officials/

Konikow LF (2013) Groundwater depletion in the United States (1900-2008): Scientific Investigations Report 2013-U.S. Geological Survey. https://doi.org/10.3133/sir20135079

Levy MC, Neely WR, Borsa AA et al (2020) Fine-scale spatiotemporal variation in subsidence across California’s San Joaquin Valley explained by groundwater demand. Environmental Research Letters 16.

USGS (2018) Estimated use of water in the U.S. in 2015. Table 4A. U.S. Geological Survey.

Posted in Groundwater, Peak Water | Tagged , , , | Comments Off on Aquifer decline in California

The cost of farming

Preface. One of the best ways to survive the coming energy crisis and reduce biodiversity loss, soil erosion and toxic chemicals is to start an organic farm. Today, that’s hard to pull off unless you have a 9 to 5 job, because to pay back the cost of the land and equipment, you’ve got to grow a lot of food, and that requires expensive equipment.

The result since 1935 is that farms have gotten larger and larger. In 1935 there were about 7 million averaging 155 acres farms, today just 2 million farms averaging 444 acres.

Since oil peaked in 2018, it’s a shame that ways to split up large farms into smaller ones is highly unlikely to happen in order to prepare for energy decline. So that means a future feudal system of mega land-owners and their serfs, or more likely, endless civil wars as land is redistributed the hard way.

Another way to go about farming even if you don’t know how would be to buy land and invite a farmer to live there to do the work: McKeough (2020) Their Dream Was a Working Farm (but They Weren’t Farmers). So one urban couple had a brainstorm: Why not build a house they could share with farmers just starting out, on land that could be farmed? New York Times.

Alice Friedemann   www.energyskeptic.com  author of “Life After Fossil Fuels: A Reality Check on Alternative Energy”, 2021, Springer; “When Trucks Stop Running: Energy and the Future of Transportation”, 2015, Springer, Barriers to Making Algal Biofuels, and “Crunch! Whole Grain Artisan Chips and Crackers”. Podcasts: Collapse Chronicles, Derrick Jensen, Practical Prepping, KunstlerCast 253, KunstlerCast278, Peak Prosperity , XX2 report

***

Krymowski J (2020) New technology and machinery’s improved efficiency are bumping up the costs of being a farmer. AGdaily.

No wonder industrial farms keep getting larger. An average-size new, basic model with no optional add-ons, such as John Deere or Case IH combine starts at about $300,000.  Some of the larger tractors in this industry can hit $700,000 or more. Most have proprietary software, leaving farmers without the right-to-repair since most problems will need to be fixed by the dealer at greater cost. Used tractors are cheaper but even here a decent combine will cost $100,000.  

Now, what about the more basic stuff? Take a look at your average utility tractor, something non-articulated to just satisfy everyday loading, moving, and trailering needs. Again, as a base price, you can go to your local dealer and expect to pay well within the bounds of $20,000 to $50,000 for something mid-sized, in the 25 to 80 horsepower range. Used these machines still run $10,000 to $30,000. As you can imagine, the price tag goes up significantly based on greater horsepower and add-ons.

If you plant row crops (like corn or soybeans), there are a variety of implements you need. One of Kinze’s 4705 24-row no-till planters will cost you at least $310,000, for example, while a John Deere corn head for that combine you already paid hundreds of thousands of dollars for will add another $55,000 to $100,000 to the cost. Of course, when you rotate soybeans or wheat in your fields, you’ll need harvesting implements for them, too. Don’t forget tillage equipment, sprayers, hay raking and baling equipment, and augers, all of which may be necessary to conduct business.

The ever-increasing prices of equipment, in part due to ever-increasing technological advancements, almost seem more suited as luxuries than essential pieces of work equipment. Even a standard new skid loader (and like a tractor, irreplaceable on many farms) can easily cost you $25,000 to $65,000. Or if you need a side-by-side utility vehicle for hauling feed or doing other odd jobs around the farm, expect to drop more than $20,000 on a Can-Am Defender Pro or roughly $10,000 for a Kubota RTV series. It’s no wonder many farmers opt to run their compact pickup trucks into the ground for these kinds of tasks — it cuts costs.

The cost of arable land

Arable land, the most fundamental agrarian natural resource, seems to be increasing in value while decreasing in availability. In 2016, tillable acreage in the U.S. made up only 16.65 percent of landmass. This isn’t surprising when we consider that from 1962 to 2012 we lost 31 million acres of farmland to some sort of development.

Cost per acre fluctuates greatly by state and region. But in some of our prime farm country, affordability is virtually impossible for just anyone without an inheritance to waltz into the industry and acquire enough acreage to get into cost-of-living-sustainable production agriculture.

In California, one of America’s agricultural powerhouses, the average cost of farmland is $10,000 per acre. Iowa isn’t too far behind at $7,190 an acre or even Florida at $5,950 an acre. When you consider than many production farmers say (https://www.agriculture.com/farm-management/business-planning/how-much-does-it-take-to-become-a-farmer) they need at least 500 owned acres and hundreds more leased acres to actually make a living solely on the farm, the sum of the money spent can be staggering.

The cost of crop farming

With the unfriendly cost of entry, so to speak, it may lead you to wonder about the generational farmers fortunate enough to inherit land, equity, and even equipment. If you have the foundation set, it should be easy to make an honest living in this business, no? Unfortunately, even this case isn’t so simplistic.

Your annual costs of operation vary greatly according to season, commodity, and region. But in general, costs are going up, and market values just can’t keep up sufficiently.

Profitability per acre of any crop is difficult to accurately depict in a blanket statement. It will vary greatly by the needs of a particular soil, weather, bushels per acre, labor, time of marketing, and much more. But for some perspective, let’s look at the 2018 Illinois reports for corn and soybeans cost of production. Corn averaged $854 cost of production across all of the state’s various regions, and it ranged anywhere from $3.70 to $4.33 a bushel when sold. Being conservative for with the national 176.4 bushels per acre yield average in 2018, that means each acre brought in only about $653 to $764.

Illinois soybeans averaged $639 cost of production per acre, for a value of $8.99 to $10.64 per bushel. That year the average was 51.6 bushels an acre, with a potential income of $464 to $549 an acre.

Other crops aren’t much more cheerful looking. Looking at historical commodity costs and returns per the USDA, national wheat production had a -$71.42 value of production, less total costs.

The reliance on off-farm income

This brings us to another important reality — the majority of farmers are reliant on an off-farm income of some sort to help pay the bills. This isn’t new — in fact I’d say most people in ag know this very well, if not statistically than in practicality. Think about it, how many farmers does anyone know running an operation as the sole source of income for them, their spouse, and perhaps the children? Chances are very, very few, if any.

According to the USDA, while it appears median income is expected to rise for farm households, it’s important to be aware off-farm income is directly related to this.

What “off-farm income” looks like varies quite a bit. It could take the form of a spouse with a full- or part-time job, it could be both spouses working full- or part-time in addition to farming, or even an affiliated parent or adult child working off the farm in some capacity. But the root cause tends to be the same — the farm just doesn’t pay for itself (or perhaps it can pay for itself but not the line of interest, the equipment loans, or health insurance).

We’ve seen how the cost of production has continued to rise and the return on investment of the major commodities has simply been unable to keep up, severely regressing in some years.

In 2017, the USDA released a nice “Food Dollar Series,” which showed exactly how America’s food dollars broke down and where each sent went after purchasing a processed and packaged food product.

The biggest chunk of change went to the food services sector getting 36.7 cents, followed by food processing getting 15 cents, and the wholesale trade with 9.1 cents. Farm production sat at fourth getting just 7.8 cents of every dollar spent. Now, in a food system so heavily reliant on widespread distribution and processing, a shift in how the dollar is cut up is reasonable — after all you can’t just go to the farm down the road and purchase a bundle of wheat and go through all the intricate steps to get a handful of bread flour. But when this number is visualized so plainly, coupled by the ways in which farmers have been struggling for decades, something doesn’t bode well with a lot of people.

There isn’t any one solution from any one organization, sector, or group to answer to the many financial issues farmers face in the modern era. But it seems to stand that commodity farming as we know it won’t get incredibly easier any time soon. What we can do is support our farmers, local and maybe not so local, and recognize the contributions they make to our food supply system. Pay attention to your local Farm Bureau and see what issues and concerns they are raising for farmers in your areas and show your support if you can. We all need to eat, and we all can’t have answers, but we can work for the future of agriculture and try to make it the best we can.

The cost of livestock production

Other commodities, such as livestock and poultry, haven’t fared much better. According to the USDA in 2019, the dollars per hundredweight gain value of hog production, less total costs was -$5.62. Less operating costs, that value would be a whopping profit of $11.10 . Note the reason in difference between these two numbers is that operating costs, present in the first dollar amount, account for the most expensive parts of all animal production. To calculate this unit, the USDA took into account things like purchased feed, on-farm grown/harvested feed, animal purchase, bedding, veterinary care, repairs, marketing and so forth.

Dollars per cow in the cow-calf segment of the beef industry that same year were a net value of -$786.87, less total costs. Even without operating costs, that leaves another slim profit margin of $49.65.

A benefit (or not so much of a benefit depending on whom you ask) to commodity poultry and pork are the wide availability of contracts with corporations such as Tyson, Cargill, and Smithfield. Granted, this does provide the safety net of a guaranteed buyer, but it doesn’t necessarily mean significantly better finances or lower startup costs. For example, the USDA said 60 percent of contract broiler growers earned household incomes that exceeded the U.S.-wide median, with a pretty wide range in annual salaries. However, this report noted: “On average, off-farm income accounts for half of the total household income earned by contract growers, and off-farm income varies widely.”

Posted in Farming & Ranching | Tagged , | 2 Comments

Not enough fossil fuels left to trigger another mass extinction

Preface. Since both conventional and unconventional oil peaked in 2018, we clearly won’t be burning fossils at exponentially increasing rates until 2400 as the IPCC expected. Quite the opposite, currently the decline rate of oil is 8% a year, which can be reduced to 4% by enhanced oil recovery techniques. The other 4% could be remedied by finding more oil, but discoveries have been at their lowest point for decades the past 7 years, and with oil prices so low, exploration and new projects are on hold.

Many books, starting with Ward’s “Under a Green Sky” warned that we would bring on another major extinction event burning fossil fuels. News reports continue to assume that this will be the eventual outcome as well. So you may not be aware of what it took to bring on the mother of all extinctions: The Permian. Although it’s commonly said that we are emitting far more CO2 faster than ever in history, this isn’t true.

Amazingly, researchers don’t blame the 300,000 to 1 million years of volcanic traps. Rather, it appears there were two pulses of lava from deep beneath the earth that rose to the surface, burning through underground deposits of coal, oil, and natural gas. That released an enormous amount of CO2 into the atmosphere; 100,000 billion tonnes (= 1 × 10¹⁴ tonnes). That is an almost incomprehensible amount of carbon injected into the atmosphere in a short (geologically speaking) period of time. This is more than 40 times the amount of all carbon available in modern fossil fuel reserves including carbon already burned since the industrial revolution.”

Researchers also don’t find methane hydrates a suspect, because it was “highly unlikely based on our data” according to Dr. Marcus Gutjahr from GEOMAR, co-author of the study (SD 2020).

Related articles:

Clarkson, M. O., et al. 2015. Ocean acidification and the Permo-Triassic mass extinction. Science 348:229.

Cui Y, Li M, van Soelen EE, et al (2021) Massive and rapid predominantly volcanic CO2 emission during the end-Permian mass extinction. PNAS.  https://www.pnas.org/content/118/37/e2014701118

Sobolev, S. V., et al. 2011. Linking mantle plumes, large igneous provinces and environmental catastrophes. Nature 477:312-316.

Svensen, H., et al. 2009. Siberian gas venting and the end-Permian environmental crisis. Earth and Planetary Science Letters 277: 490-500.

Alice Friedemann   www.energyskeptic.com  author of “Life After Fossil Fuels: A Reality Check on Alternative Energy”, 2021, Springer; “When Trucks Stop Running: Energy and the Future of Transportation”, 2015, Springer, Barriers to Making Algal Biofuels, and “Crunch! Whole Grain Artisan Chips and Crackers”. Podcasts: Collapse Chronicles, Derrick Jensen, Practical Prepping, KunstlerCast 253, KunstlerCast278, Peak Prosperity , XX2 report

***

Jurikova H et al (2020) Permian–Triassic mass extinction pulses driven by major marine carbon cycle perturbations. Nature Geoscience 13: 745-750

Approximately 252 million years ago, long before the emergence of dinosaurs, at the Permian-Triassic boundary (PTB), the largest of the known mass extinctions on Earth occurred. With more than 95% of marine species becoming extinct, life in Permian seas, once a thriving and diverse ecosystem, was wiped out within only tens of thousands of years, a geological blink of an eye. This is now referred to as the ‘Great Dying’, a period when life on Earth has never been so close to becoming extinct.

Scientists have long debated the theories of the cause of the extinction ranging from bolide impact and dissolution of gas hydrates to volcanoes, which could have caused climatic and environmental changes making Earth so inhospitable to life.

This paper provides, for the first time, a conclusive picture of the underlying mechanism and consequences of the extinction and finally answers the key questions – what exactly caused Earth’s biggest mass extinction and how could an event of such a deadly magnitude unfold?

The team were able to determine that the trigger of the Permian-Triassic crisis was a large pulse of CO2 to the atmosphere originating from a massive flood basalt province, the result of a giant volcanic eruption in today’s Siberia. It was a rather rapid catastrophe (~61 ± 48 kyr). Analyses showed that the volcanisms released more than 100,000 billion tonnes of carbon into the atmosphere, triggering the onset of the extinction. This is more than 40 times the amount of all carbon available in modern fossil fuel reserves including carbon already burned since the industrial revolution.

Initially, the atmospheric CO2 is relatively low in the Late Permian (~500 to ~800 ppm). Following the CIE, at the onset of the extinction, CO2 levels rise abruptly to peak at 44 kyr after the CIE (up to a maximum of 4,400 ppm) and remain elevated (~1,500 ppm) throughout the Early Triassic, consistent with previous palaeo CO2 estimates.  Our model predicts warming by almost 10 °C.

Given the vastly differing timescales and carbon budgets involved, LIP carbon cycle dynamics is a poor analogy for present-day fossil fuel emissions> And today’s geological carbon reservoirs are insufficient for anthropogenic release beyond a century.  Even so, the peak emissions rate during the largest known mass extinction of 0.7 Pg C per year is 14 times less than the current anthropogenic rate (9.9 ± 0.5 Pg C per year). The environmental deterioration during the PTB took several thousands of years to unfold.

The research team used innovative modelling to reconstruct the effect of such large CO2 release on global biogeochemical cycles and the marine environment. The findings showed that, initially, the CO2 perturbation led to extreme warming and acidification of the ocean that was lethal to many organisms, especially those building calcium carbonate shells and skeletons. The greenhouse effect, however, led to further dramatic changes in chemical weathering rates on land and nutrient input and cycling in the ocean that resulted in vast deoxygenation and probably also sulphide poisoning of the oceans, killing the remaining organism groups.

The Permian-Triassic mass extinction was therefore a cascading collapse of vital global cycles sustaining the environment driven by an immense multi-millennial carbon injection to the atmosphere. The extreme changes and multiple stressors – high temperatures, acidification, oxygen loss, sulphide poisoning – combined to wipe out a large variety of marine organisms, explaining the severity of the extinction.

References

SD (2020) Driver of the largest mass extinction in the history of the Earth identified: New study provides a comprehensive reconstruction of the Permian-Triassic boundary event. ScienceDaily.

Jurikova H, Gutjahr M, Wallmann K et al (2020) Permian–Triassic mass extinction pulses driven by major marine carbon cycle perturbations. Nature Geoscience 13: 745-750.


Posted in But not from climate change: Peak Fossil Fuels, CO2 and Methane, Global Warming, Mass Extinction, Planetary Boundaries, Runaway Greenhouse | Tagged , , | 6 Comments

Increased flooding

Preface. It’s not just sea level rise, but increased precipitation, sinking land, hurricanes, and dam failures that will cause more floods in the future.

Dams will fail more often in extreme rain as at least half are older than their lifespan. In 2017 the Oroville Dam crisis in California forced more than 180,000 residents to evacuate after a spillway failure caused by massive rainfall. This is a good example of how existing infrastructure is already vulnerable to flooding.

The east coast is sinking, a hangover from the past weight of glaciers in the last ice age, increasing flooding. The San Francisco Bay Area is sinking too.

And as carbon levels rise, plants absorb less water from the air, allowing more rainfall to reach rivers and streams, increasing their flooding potential (Retallack 2020).

See “flooding in the news” at the end of this post for details.

Alice Friedemann   www.energyskeptic.com  author of “Life After Fossil Fuels: A Reality Check on Alternative Energy”, 2021, Springer; “When Trucks Stop Running: Energy and the Future of Transportation”, 2015, Springer and “Crunch! Whole Grain Artisan Chips and Crackers”. Podcasts: Derrick Jensen, Practical Prepping, KunstlerCast 253, KunstlerCast278, Peak Prosperity , XX2 report

***

Davenport FV, Burke M, Diffenbaugh NS (2021). Contribution of historical precipitation change to US flood damages. Proceedings of the National Academy of Sciences.

Intensifying precipitation contributed 36% of the financial costs of flooding in the United States over the past three decades from 1988 to 2017, totaling almost $75 billion of the estimated $199 billion in flood damages from 1988 to 2017.

Flooding in the news (from ScienceDaily)

Since California provides a third of U.S. food and exports food world-wide, rainfall variability and less snowpack will impact non-Californians:

  • 2018 Sinking land will exacerbate flooding from sea level rise in Bay Area. Subsidence combined with sea level rise around San Francisco Bay doubles flood-risk area: Hazard maps use estimated sea level rise due to climate change to determine flooding risk for today’s shoreline, but don’t take into account that some land is sinking. A precise study of subsidence around San Francisco Bay shows that for conservative estimates of sea level rise, twice the area is in danger of flooding by 2100 than previously thought. And in King tides and 100-year storms, the water level will rise even higher
  • 2018 Houston’s urban sprawl increased rainfall, flooding during Hurricane Harvey
  • 2017 USA threatened by more frequent flooding. The East Coast of the USA is slowly sinking into the sea: the states of Virginia, North Carolina, and South Carolina are most at risk. Cities such as Miami on the East Coast of the USA are being affected by flooding more and more frequently. The causes are often not hurricanes with devastating rainfall such as Katrina, or the recent hurricanes Harvey or Irma. On the contrary: flooding even occurs on sunny, relatively calm days. It causes damage to houses and roads and disrupts traffic, yet does not cost any people their lives. It is thus also known as ‘nuisance flooding’.  And this nuisance is set to occur much more frequently in the future.
  • 2018 Dramatic increase in flooding on East coastal roads:  High tide floods, or so-called “nuisance flooding,” that happen along shore roadways during seasonal high tides or minor wind events are occurring far more frequently than ever before. In the past 20 years roads along the East Coast have experienced a 90% increase in flooding — often making the roads in these communities impassable, causing 100 million hours of delays rising to 3.4 billion hours by 2100, as well as stress, and impacting transportation of goods and services.
  • 2017 Flooding risk: America’s most vulnerable communities: Floods are the natural disaster that kill the most people. They are also the most common natural disaster.

References

Retallack G et al (2020) Gregory Retallack et al. Flooding Induced by Rising Atmospheric Carbon Dioxide. GSA TodayDOI: 10.1130/GSATG427A.1

Posted in Extreme Weather, Floods | Tagged , | Comments Off on Increased flooding

Global Ice melting

Preface. As the Arctic ice melt accelerates due to climate change it could release more than 1 trillion pieces of plastic into the ocean over the next decade, possibly posing a major threat to marine life (Lewis 2014).

The rate at which ice is disappearing across the planet is speeding up, with 28 trillion tons of ice between 1994 and 2017 – equal to a sheet of ice 100 meters thick covering the whole of the United Kingdom (Slater 2021).

And 50 to 70% of Antarctic ice shelves could become weak and collapse from surges of melt water (Lai 2020).

Related:

2015: Plastic for dinner: A quarter of fish sold at markets contain human-made debris. Original article here]

Alice Friedemann   www.energyskeptic.com  author of “Life After Fossil Fuels: A Reality Check on Alternative Energy”, 2021, Springer; “When Trucks Stop Running: Energy and the Future of Transportation”, 2015, Springer, Barriers to Making Algal Biofuels, and “Crunch! Whole Grain Artisan Chips and Crackers”. Podcasts: Collapse Chronicles, Derrick Jensen, Practical Prepping, KunstlerCast 253, KunstlerCast278, Peak Prosperity , XX2 report

***

Slater T, Lawrence IR, Otosaka IN et al (2021) Earth’s ice imbalance. The Cryosphere.

Ice melt across the globe raises sea levels, increases the risk of flooding to coastal communities, and threatens to wipe out natural habitats which wildlife depend on. Overall, there has been a 65 % increase in the rate of ice loss over the 23-year survey. This has been mainly driven by steep rises in losses from the polar ice sheets in Antarctica and Greenland, where ice melt has accelerated the most int he world.  Sea-level rise on this scale will have very serious impacts on coastal communities this century.

The majority of all ice loss was driven by atmospheric melting (68 %), with the remaining losses (32%) being driven by oceanic melting.

The survey covers 215,000 mountain glaciers spread around the planet, the polar ice sheets in Greenland and Antarctica, the ice shelves floating around Antarctica, and sea ice drifting in the Arctic and Southern Oceans.

Rising atmospheric temperatures have been the main driver of the decline in Arctic sea ice and mountain glaciers across the globe, while rising ocean temperatures have increased the melting of the Antarctic ice sheet. For the Greenland ice sheet and Antarctic ice shelves, ice losses have been triggered by a combination of rising ocean and atmospheric temperatures.

During the survey period, every category lost ice, but the biggest losses were from Arctic Sea ice (7.6 trillion tons) and Antarctic ice shelves (6.5 trillion tons), both of which float on the polar oceans.

Sea ice loss doesn’t contribute directly to sea level rise but it does have an indirect influence. One of the key roles of Arctic sea ice is to reflect solar radiation back into space which helps keep the Arctic cool.

Not only is this speeding up sea ice melt, it’s also exacerbating the melting of glaciers and ice sheets which causes sea levels to rise.”

Half of all losses were from ice on land — including 6.1 trillion tons from mountain glaciers, 3.8 trillion tons from the Greenland ice sheet, and 2.5 trillion tons from the Antarctic ice sheet. These losses have raised global sea levels by 35 millimetres.

It is estimated that for every centimeter (0.4 inch) of sea level rise, approximately a million people are in danger of being displaced from low-lying homelands.

Despite storing only 1 % of the Earth’s total ice volume, glaciers have contributed to almost a quarter of the global ice losses over the study period, with all glacier regions around the world losing ice.

Lewis R (2014) Arctic ice melt to release 1 trillion pieces of plastic into sea Increasing ice melt due to climate change will pose a major threat to marine life. Aljazeera.

This report, titled “Global Warming Releases Microplastic Legacy Frozen in Arctic Sea Ice,” said ice in some remote locations contains at least twice as much plastic as previously reported areas of surface water such as the Great Pacific Garbage Patch – an area of plastic waste estimated to be bigger than the state of Texas.

Researchers behind the report, published last week in the scientific journal Earth’s Future, said they found the unusual concentrations of plastics by chance while studying sediments trapped in ice cores. The researchers are based at Dartmouth College in New Hampshire.

Many scientists and activists have raised alarms over the massive amount of plastic waste building up in the world’s oceans. In the film “Midway,” documentary maker Chris Jordan showed how tens of thousands of baby albatrosses are dying – their bodies filled with plastic most likely from the Garbage Patch – on the Pacific atoll of Midway, one of the most remote islands on the planet.

Increasing ice melt due to climate change will likely release the even-higher concentrations of plastic trapped in Arctic ice into the sea, and thus into the food chain, the new report in Earth’s Future said.

“The environmental consequences of microplastic fragments are not fully understood, but they are clearly ingested by a wide range of marine organisms including commercially important species,” the report said.

The term “microplastics” refers to tiny particles created as plastic materials that break down but never biodegrade. They are being increasingly found on surface waters and shorelines around the world.

Plastic materials are introduced to the ocean by various means, including from cosmetic ingredients known as microbeads, from the release of semi-synthetic fibers such as rayon from washing machines, and from larger discarded plastic items. The plastics reach the sea via sewers, rivers, and littering along coastlines or at sea.

Researchers said in the new report that Arctic ice contains such high concentrations of plastics because of the way sea ice forms. It concentrates particulates from the surrounding waters, and the particulates become trapped until the ice melts. Scientists said in the report that they found 38-234 plastic particles per cubic meter of ice in some parts of the Arctic areas they studied.

In the next decade the scientists predict that at least 2,000 trillion cubic meters of Arctic ice will melt. If that ice contains the lowest concentrations of microplastics reported in the study, this could result in the release of more than 1 trillion pieces of plastic, the report said.

Researchers worry that a wide range of organisms could ingest the microplastics, leading to physical injury and poisoning.

Plastic products often contain potentially harmful additives to make them last longer, the report said. Other studies have shown that small fragments of plastic can act a bit like magnets, attracting pollutants from the environment and making them even more toxic.

Other recent scientific studies have shown that tiny plastic “microbeads,” added to many body cleansers and toothpastes, have been found in major lakes and other waterways used for drinking water. The studies said the plastic balls absorb toxic chemicals released into the environment, and are then eaten by fish and thus introduced into the food chain.

Mass production of plastic began in the 1940s, and by 2009 at least 230 million tons of plastic were produced each year – equivalent to the weight of a double-decker bus every two seconds.

References

Lai CY, Kingslake J, Wearing MG et al (2020) Vulnerability of Antarctica’s ice shelves to meltwater-driven fracture. Nature 584.

Posted in Biodiversity Loss, Oceans, Sea Level Rise | Tagged , , , , , | Comments Off on Global Ice melting